Quarterly Theory For ThinkOrSwim

Is there anyone who could has turned the 90m, 6hr, Daily & Weekly into upper labels? Having some issues make it happen for some reason.
This is what I have so far. Though the 90m still won't generate anything for me.


input showLabels = yes;
addlabel(showlabels, "90-" + if isq1 and !isq1[1] then "ACC" else if isQ2 and !isq2[1] then "MAN" else if isQ3 and !isQ3[1] then "DIS" else if isQ4 and isQ4[1] then "REV" else " ", if isq1 then Globalcolor("a") else if isQ2 then Globalcolor("m") else if isq3 then Globalcolor("d") else if isq4 then Globalcolor("x") else color.white);
 

Join useThinkScript to post your question to a community of 21,000+ developers and traders.

Is there anyone who could has turned the 90m, 6hr, Daily & Weekly into upper labels? Having some issues make it happen for some reason.
The following shows labels for Weekly down to 90m cycles as an upper study.

Ruby:
# Created by @tony_futures inspired by @traderdaye's quarterly theory concept
# Labels only for upper study
declare hide_on_daily;

DefineGlobalColor("divider", Color.WHITE);
DefineGlobalColor("a", Color.DARK_GRAY);
DefineGlobalColor("m", CreateColor(223,83,107));#Color.DARK_RED);
DefineGlobalColor("d", CreateColor(97,208,79));#Color.DARK_GREEN);
DefineGlobalColor("x", CreateColor(34,151,230));#Color.BLUE);


def DayOfWeek = getDayOfWeek(getYyyyMmDd());

# days of month
# 1-7  1st week
# 8-14  2nd
# 15-21  3rd
# 22-28  4th
# weekly/daily stuff
def first_week = 1;
def second_week = 7;
def third_week = 14;
def fourth_week = 21;
def last_week = 28;
def daymo = GetDayofMonth( GetYyyyMmDd() );
def weekNumber = if dayOfWeek == 1 and daymo >= first_week and daymo <= second_week then 1 else if dayOfWeek == 1 and daymo > second_week and daymo <= third_week then 2 else if dayOfWeek == 1 and daymo > third_week and daymo <= fourth_week then 3 else if dayOfWeek == 1 and daymo <= last_week then 4 else if dayOfWeek == 1 then 0 else weekNumber[1];
def whichWeek = weekNumber;

############
# 6hr/90m stuff
def Midnight = 0000;   #Midnight Open
def six = 0600;
def noon = 1200;
def eighteen = 1800;
def currentAgg = getAggregationPeriod() / 60000;
def bn = barNumber();


def isMidnight2 = SecondsFromTime(Midnight) >= 0;
def isSix2 = SecondsFromTime(six) >= 0;
def isNoon2 = SecondsFromTime(noon) >= 0;
def isEighteen = SecondsFromTime(eighteen) >= 0;

# 6hr sections
def isQ2_6 = isMidnight2 and !isSix2;
def isQ3_6 = isSix2 and !isNoon2;
def isQ4_6 = isNoon2 and !isEighteen;
def isQ1_6 = isEighteen;

# 90m sections
def DividerTF1 = RoundDown((90 / currentAgg),0);
def qStart_90 = if (isQ1_6 and !isQ1_6[1]) OR (isQ2_6 and !isQ2_6[1]) OR (isQ3_6 and !isQ3_6[1]) OR (isQ4_6 and !isQ4_6[1]) then bn else qStart_90[1];
def Q1 = bn >= qStart_90 and bn < (qStart_90 + DividerTF1);
def Q2 = bn >= (qStart_90 + DividerTF1) and bn < (qStart_90 + (2 * DividerTF1));
def Q3 = bn >= (qStart_90 + (2 * DividerTF1)) and bn < (qStart_90 + (3 * DividerTF1));
def Q4 = bn >= (qStart_90 + (3 * DividerTF1));

# ------------------------------------
input showWeeklyLabels = yes;
AddLabel(showWeeklyLabels and whichWeek == 1, "Weekly Accumulation", GlobalColor("a"));
AddLabel(showWeeklyLabels and whichWeek == 2, "Weekly Manipulation", GlobalColor("m"));
AddLabel(showWeeklyLabels and whichWeek == 3, "Weekly Distribution", GlobalColor("d"));
AddLabel(showWeeklyLabels and whichWeek == 4, "Weekly Reversal/Continuation", GlobalColor("x"));
input showDailyLabels = yes;
AddLabel(showDailyLabels and dayOfWeek == 1, "Daily Accumulation", GlobalColor("a"));
AddLabel(showDailyLabels and dayOfWeek == 2, "Daily Manipulation", GlobalColor("m"));
AddLabel(showDailyLabels and dayOfWeek == 3, "Daily Distribution", GlobalColor("d"));
AddLabel(showDailyLabels and dayOfWeek == 4, "Daily Reversal/Continuation", GlobalColor("x"));
input show6hrLabels = yes;
AddLabel(show6hrLabels and isQ1_6, "6hr Accumulation", GlobalColor("a"));
AddLabel(show6hrLabels and isQ2_6, "6hr Manipulation", GlobalColor("m"));
AddLabel(show6hrLabels and isQ3_6, "6hr Distribution", GlobalColor("d"));
AddLabel(show6hrLabels and isQ4_6, "6hr Reversal/Continuation", GlobalColor("x"));
input show90mLabels = yes;
AddLabel(show90mLabels and Q1, "90m Accumulation", GlobalColor("a"));
AddLabel(show90mLabels and Q2, "90m Manipulation", GlobalColor("m"));
AddLabel(show90mLabels and Q3, "90m Distribution", GlobalColor("d"));
AddLabel(show90mLabels and Q4, "90m Reversal/Continuation", GlobalColor("x"));
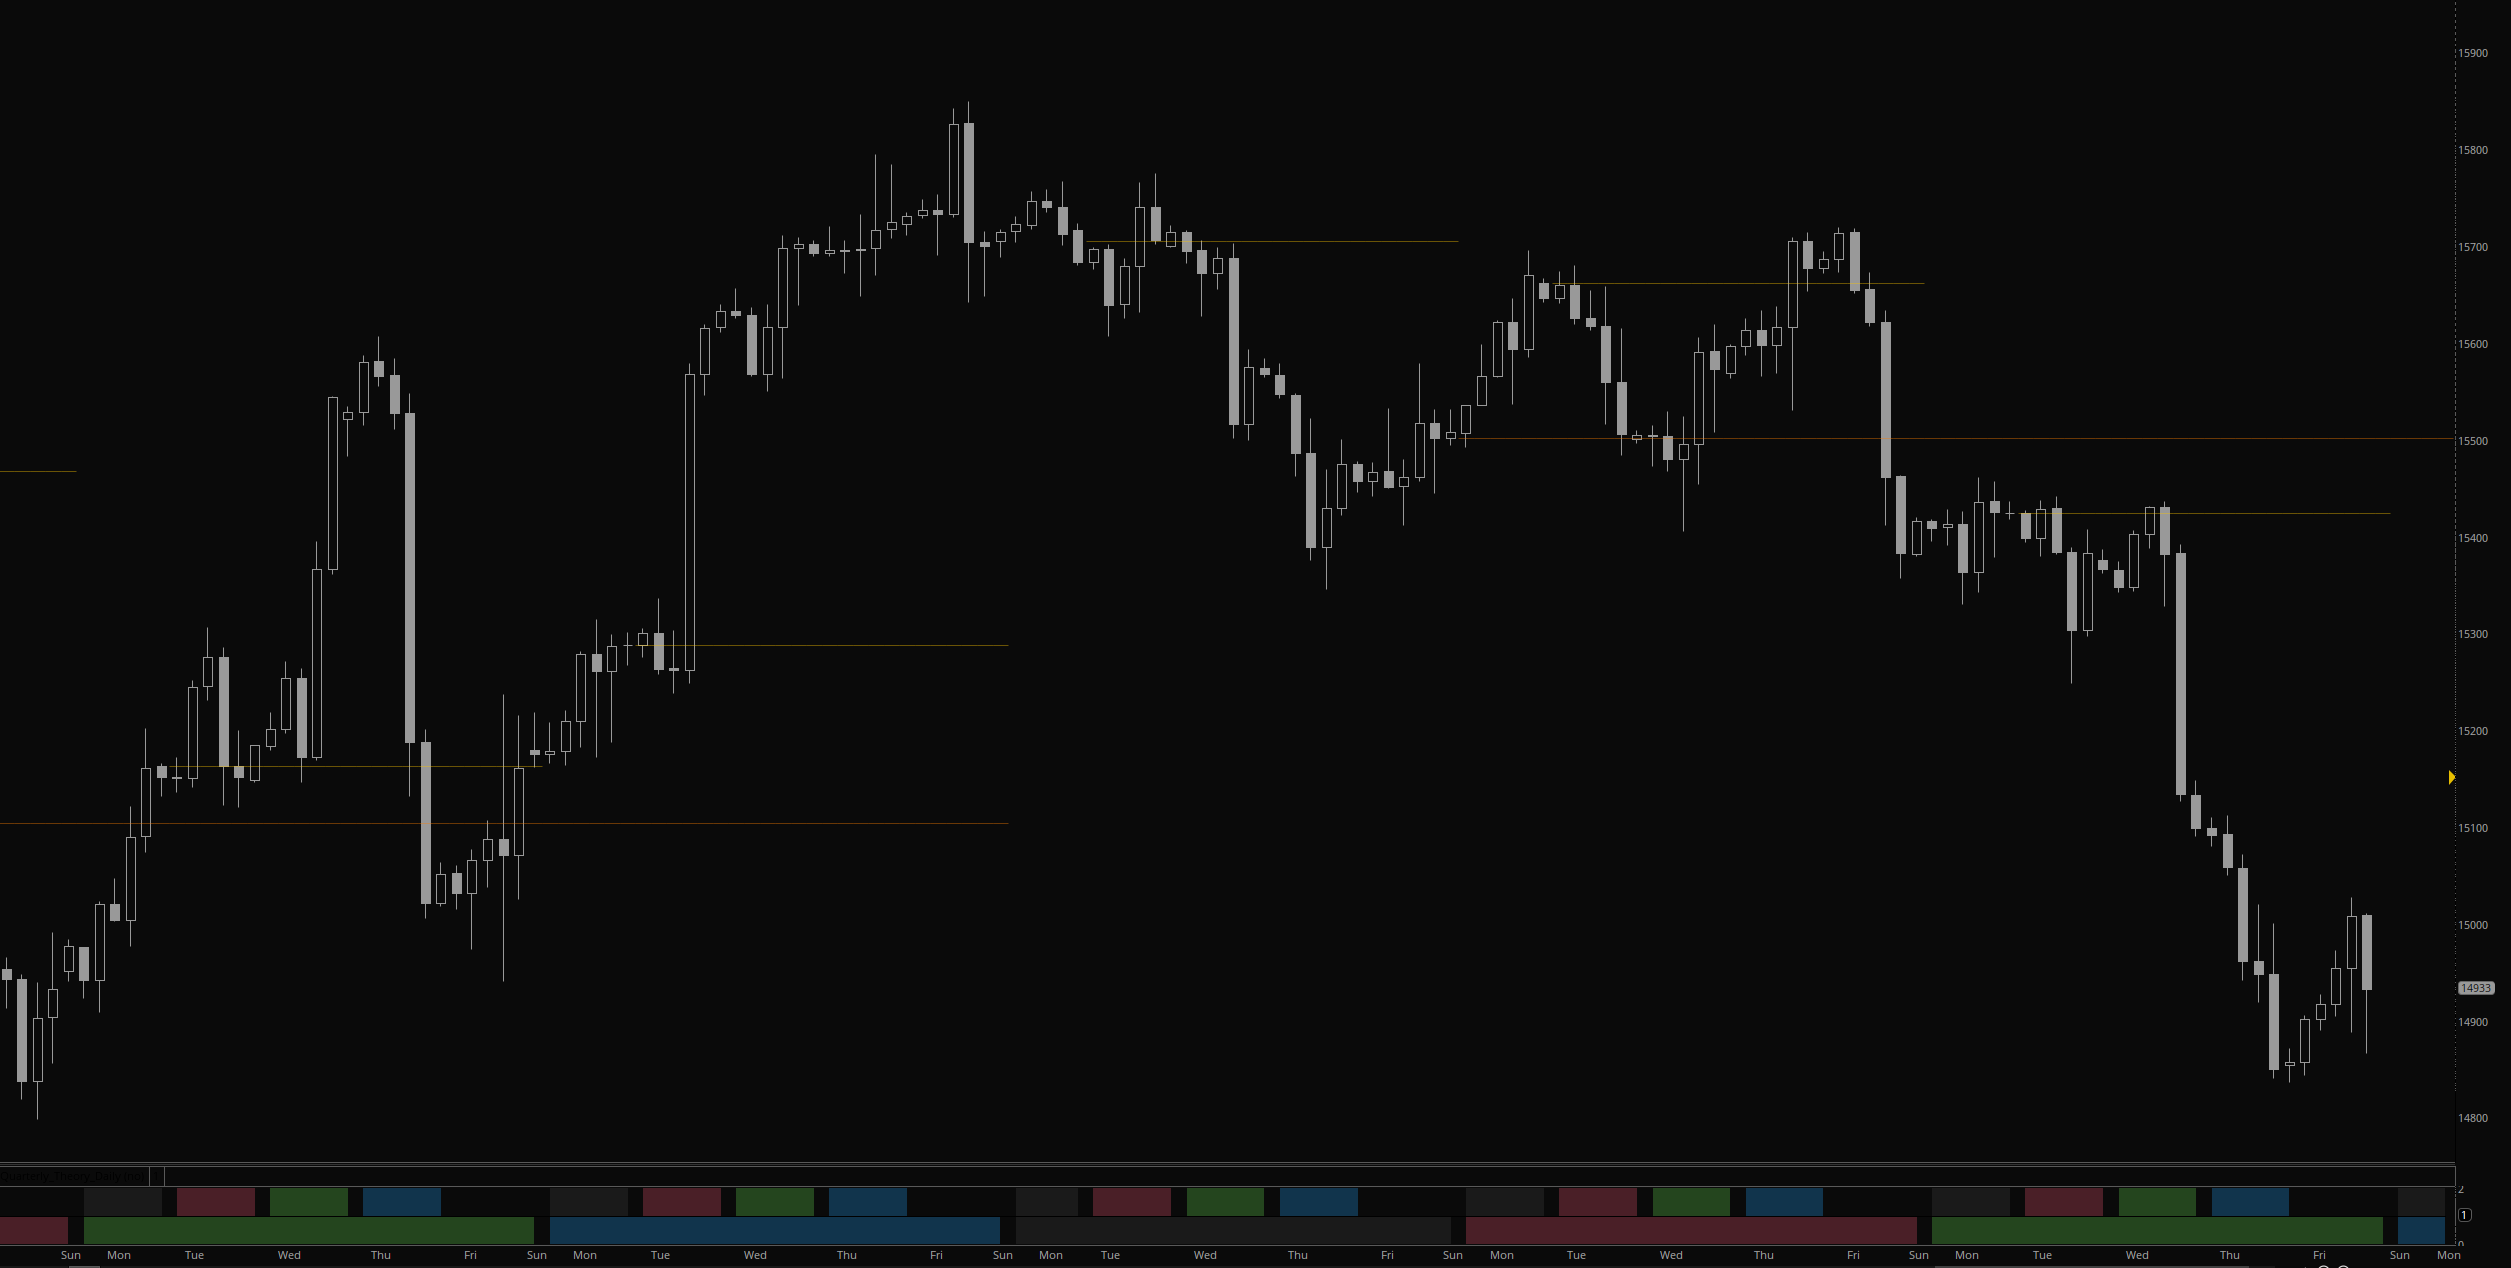
Thanks Tony!

I also was working on identifying the highs and lows of Q2 and Q3, which relative failure. I’m unsure of what I’m coding incorrectly.
My goal was to identify if Q2 breaks either high or low of Q1 to establish a bias for Q3 as bearish or bullish respectively.

I also was working on identifying the highs and lows of Q2 and Q3, which relative failure. I’m unsure of what I’m coding incorrectly.
My goal was to identify if Q2 breaks either high or low of Q1 to establish a bias for Q3 as bearish or bullish respectively.


Has anyone had any luck with plotting ACC2 high and lows and Q2 High lows? My script won't identify them correctly for some reason and I can't seem to crack it.

def q2high = if (isOneThirty or isSevenThirty2 or isThirteenThirty or isNineteenThirty) then high else q2high[1];
def q2low = if (isOneThirty or isSevenThirty2 or isThirteenThirty or isNineteenThirty) then low else q2low[1];

input showacc2levels = yes;
def acc2High = if (acc2) then high else if acc2 and high > acc2High[1] then high else acc2High[1];
def acc2Low = if acc2 then low else acc2low[1];
#def acc2Low = if (isEighteen and !isMidnight) then low else acc2low[1];
plot acc2highline = if (showacc2levels and man2) or (showacc2levels and dist2) then acc2high else double.nan;
plot acc2lowline = if showacc2levels and (man2 or dist2) then acc2low else double.nan;
 
Thanks Tony!

I also was working on identifying the highs and lows of Q2 and Q3, which relative failure. I’m unsure of what I’m coding incorrectly.
My goal was to identify if Q2 breaks either high or low of Q1 to establish a bias for Q3 as bearish or bullish respectively.


Has anyone had any luck with plotting ACC2 high and lows and Q2 High lows? My script won't identify them correctly for some reason and I can't seem to crack it.

def q2high = if (isOneThirty or isSevenThirty2 or isThirteenThirty or isNineteenThirty) then high else q2high[1];
def q2low = if (isOneThirty or isSevenThirty2 or isThirteenThirty or isNineteenThirty) then low else q2low[1];

input showacc2levels = yes;
def acc2High = if (acc2) then high else if acc2 and high > acc2High[1] then high else acc2High[1];
def acc2Low = if acc2 then low else acc2low[1];
#def acc2Low = if (isEighteen and !isMidnight) then low else acc2low[1];
plot acc2highline = if (showacc2levels and man2) or (showacc2levels and dist2) then acc2high else double.nan;
plot acc2lowline = if showacc2levels and (man2 or dist2) then acc2low else double.nan;
Personally, I would be a bit careful in assigning bias the way you have suggested. The break of these levels can either break and fail or break and extend in the same direction. So you might want to allow for that. As far as your code goes, I can see that the definition of acc2High will never evaluate the else if portion of the code so probably will always have the high of the last candle in acc2. I would try something like this:
Ruby:
def Q2High = if Q2 and !Q2[1] then high else if Q2 and high > Q2High[1] then high else Q2High[1];
def Q2Low = if Q2 and !Q2[1] then low else if Q2 and low < Q2Low[1] then low else Q2Low[1];

Hopefully that helps to move you forward.
 
Alright, I've added the larger timeframe quarters as a separate 'swing' type chart. I recommend using the 1h to 4h timeframe for this one.

reYBIfI.png


Share link: https://tos.mx/mf85Xe7

Ruby:
declare lower;
# HTF Quarterly Breakdown - created by @tony_futures inspired by @traderdaye's concept
declare hide_on_daily;

DefineGlobalColor("divider", Color.WHITE);
DefineGlobalColor("a", Color.DARK_GRAY);
DefineGlobalColor("m", CreateColor(223,83,107));#Color.DARK_RED);
DefineGlobalColor("d", CreateColor(97,208,79));#Color.DARK_GREEN);
DefineGlobalColor("x", CreateColor(34,151,230));#Color.BLUE);

plot divider = 1;
divider.setDefaultColor(Color.BLACK);
def DayOfWeek = getDayOfWeek(getYyyyMmDd());
AddCloud(if dayOfWeek == 1 then 1 else Double.NaN, 2, GlobalColor("a"), GlobalColor("a"));
AddCloud(if dayOfWeek == 2 then 1 else Double.NaN, 2, GlobalColor("m"), GlobalColor("m"));
AddCloud(if dayOfWeek == 3 then 1 else Double.NaN, 2, GlobalColor("d"), GlobalColor("d"));
AddCloud(if dayOfWeek == 4 then 1 else Double.NaN, 2, GlobalColor("x"), GlobalColor("x"));

# days of month
# 1-7  1st week
# 8-14  2nd
# 15-21  3rd
# 22-28  4th
def first_week = 1;
def second_week = 7;
def third_week = 14;
def fourth_week = 21;
def last_week = 28;
def daymo = GetDayofMonth( GetYyyyMmDd() );
def weekNumber = if dayOfWeek == 1 and daymo >= first_week and daymo <= second_week then 1 else if dayOfWeek == 1 and daymo > second_week and daymo <= third_week then 2 else if dayOfWeek == 1 and daymo > third_week and daymo <= fourth_week then 3 else if dayOfWeek == 1 and daymo <= last_week then 4 else if dayOfWeek == 1 then 0 else weekNumber[1];
def whichWeek = weekNumber;
AddCloud(if whichWeek == 1 then 0 else Double.NaN, 1, GlobalColor("a"), GlobalColor("a"));
AddCloud(if whichWeek == 2 then 0 else Double.NaN, 1, GlobalColor("m"), GlobalColor("m"));
AddCloud(if whichWeek == 3 then 0 else Double.NaN, 1, GlobalColor("d"), GlobalColor("d"));
AddCloud(if whichWeek == 4 then 0 else Double.NaN, 1, GlobalColor("x"), GlobalColor("x"));
# ------------------------------------
input showLabels = no;
AddLabel(showLabels and whichWeek == 1, "Weekly Accumulation", GlobalColor("a"));
AddLabel(showLabels and whichWeek == 2, "Weekly Manipulation", GlobalColor("m"));
AddLabel(showLabels and whichWeek == 3, "Weekly Distribution", GlobalColor("d"));
AddLabel(showLabels and whichWeek == 4, "Weekly Reversal/Continuation", GlobalColor("x"));
Can you add weekly, monthly, and yearly all in one.

Can Someone code the full https://usethinkscript.com/threads/quarterly-theory-for-thinkorswim.16647/post-131843Quarterly Theory with 90minute, 6H, daily, weekly, monthly and yearly all in one with labels just like how it is on tradingview. The exact one but for TOS if anyone can help me out please.
 
Last edited by a moderator:

Similar threads

Not the exact question you're looking for?

Start a new thread and receive assistance from our community.

87k+ Posts
301 Online
Create Post

Similar threads

Similar threads

The Market Trading Game Changer

Join 2,500+ subscribers inside the useThinkScript VIP Membership Club
  • Exclusive indicators
  • Proven strategies & setups
  • Private Discord community
  • ‘Buy The Dip’ signal alerts
  • Exclusive members-only content
  • Add-ons and resources
  • 1 full year of unlimited support

Frequently Asked Questions

What is useThinkScript?

useThinkScript is the #1 community of stock market investors using indicators and other tools to power their trading strategies. Traders of all skill levels use our forums to learn about scripting and indicators, help each other, and discover new ways to gain an edge in the markets.

How do I get started?

We get it. Our forum can be intimidating, if not overwhelming. With thousands of topics, tens of thousands of posts, our community has created an incredibly deep knowledge base for stock traders. No one can ever exhaust every resource provided on our site.

If you are new, or just looking for guidance, here are some helpful links to get you started.

What are the benefits of VIP Membership?
VIP members get exclusive access to these proven and tested premium indicators: Buy the Dip, Advanced Market Moves 2.0, Take Profit, and Volatility Trading Range. In addition, VIP members get access to over 50 VIP-only custom indicators, add-ons, and strategies, private VIP-only forums, private Discord channel to discuss trades and strategies in real-time, customer support, trade alerts, and much more. Learn all about VIP membership here.
How can I access the premium indicators?
To access the premium indicators, which are plug and play ready, sign up for VIP membership here.
Back
Top