This one is a bit out there and more in the category of tool then indicator. But I've seen too much confluence around this concept and decided to make something to help visualize it and share with the community. Quarterly Theory is a time-based concept derived from some early ICT work. As far as I am aware, it was coined and outlined by Trader Daye. I am not the author of these concepts and will not be well suited to answer all questions you might have. I suggest you study Daye's twitter to gain more insight. This is purely a graphical aid for traders to be able to quickly determine Daye's Quarterly Cycles, and save Time while on the charts.
I have been inspired to create this tool for TOS by a very clever creator on Twitter (too) who has published a TradingView version here.
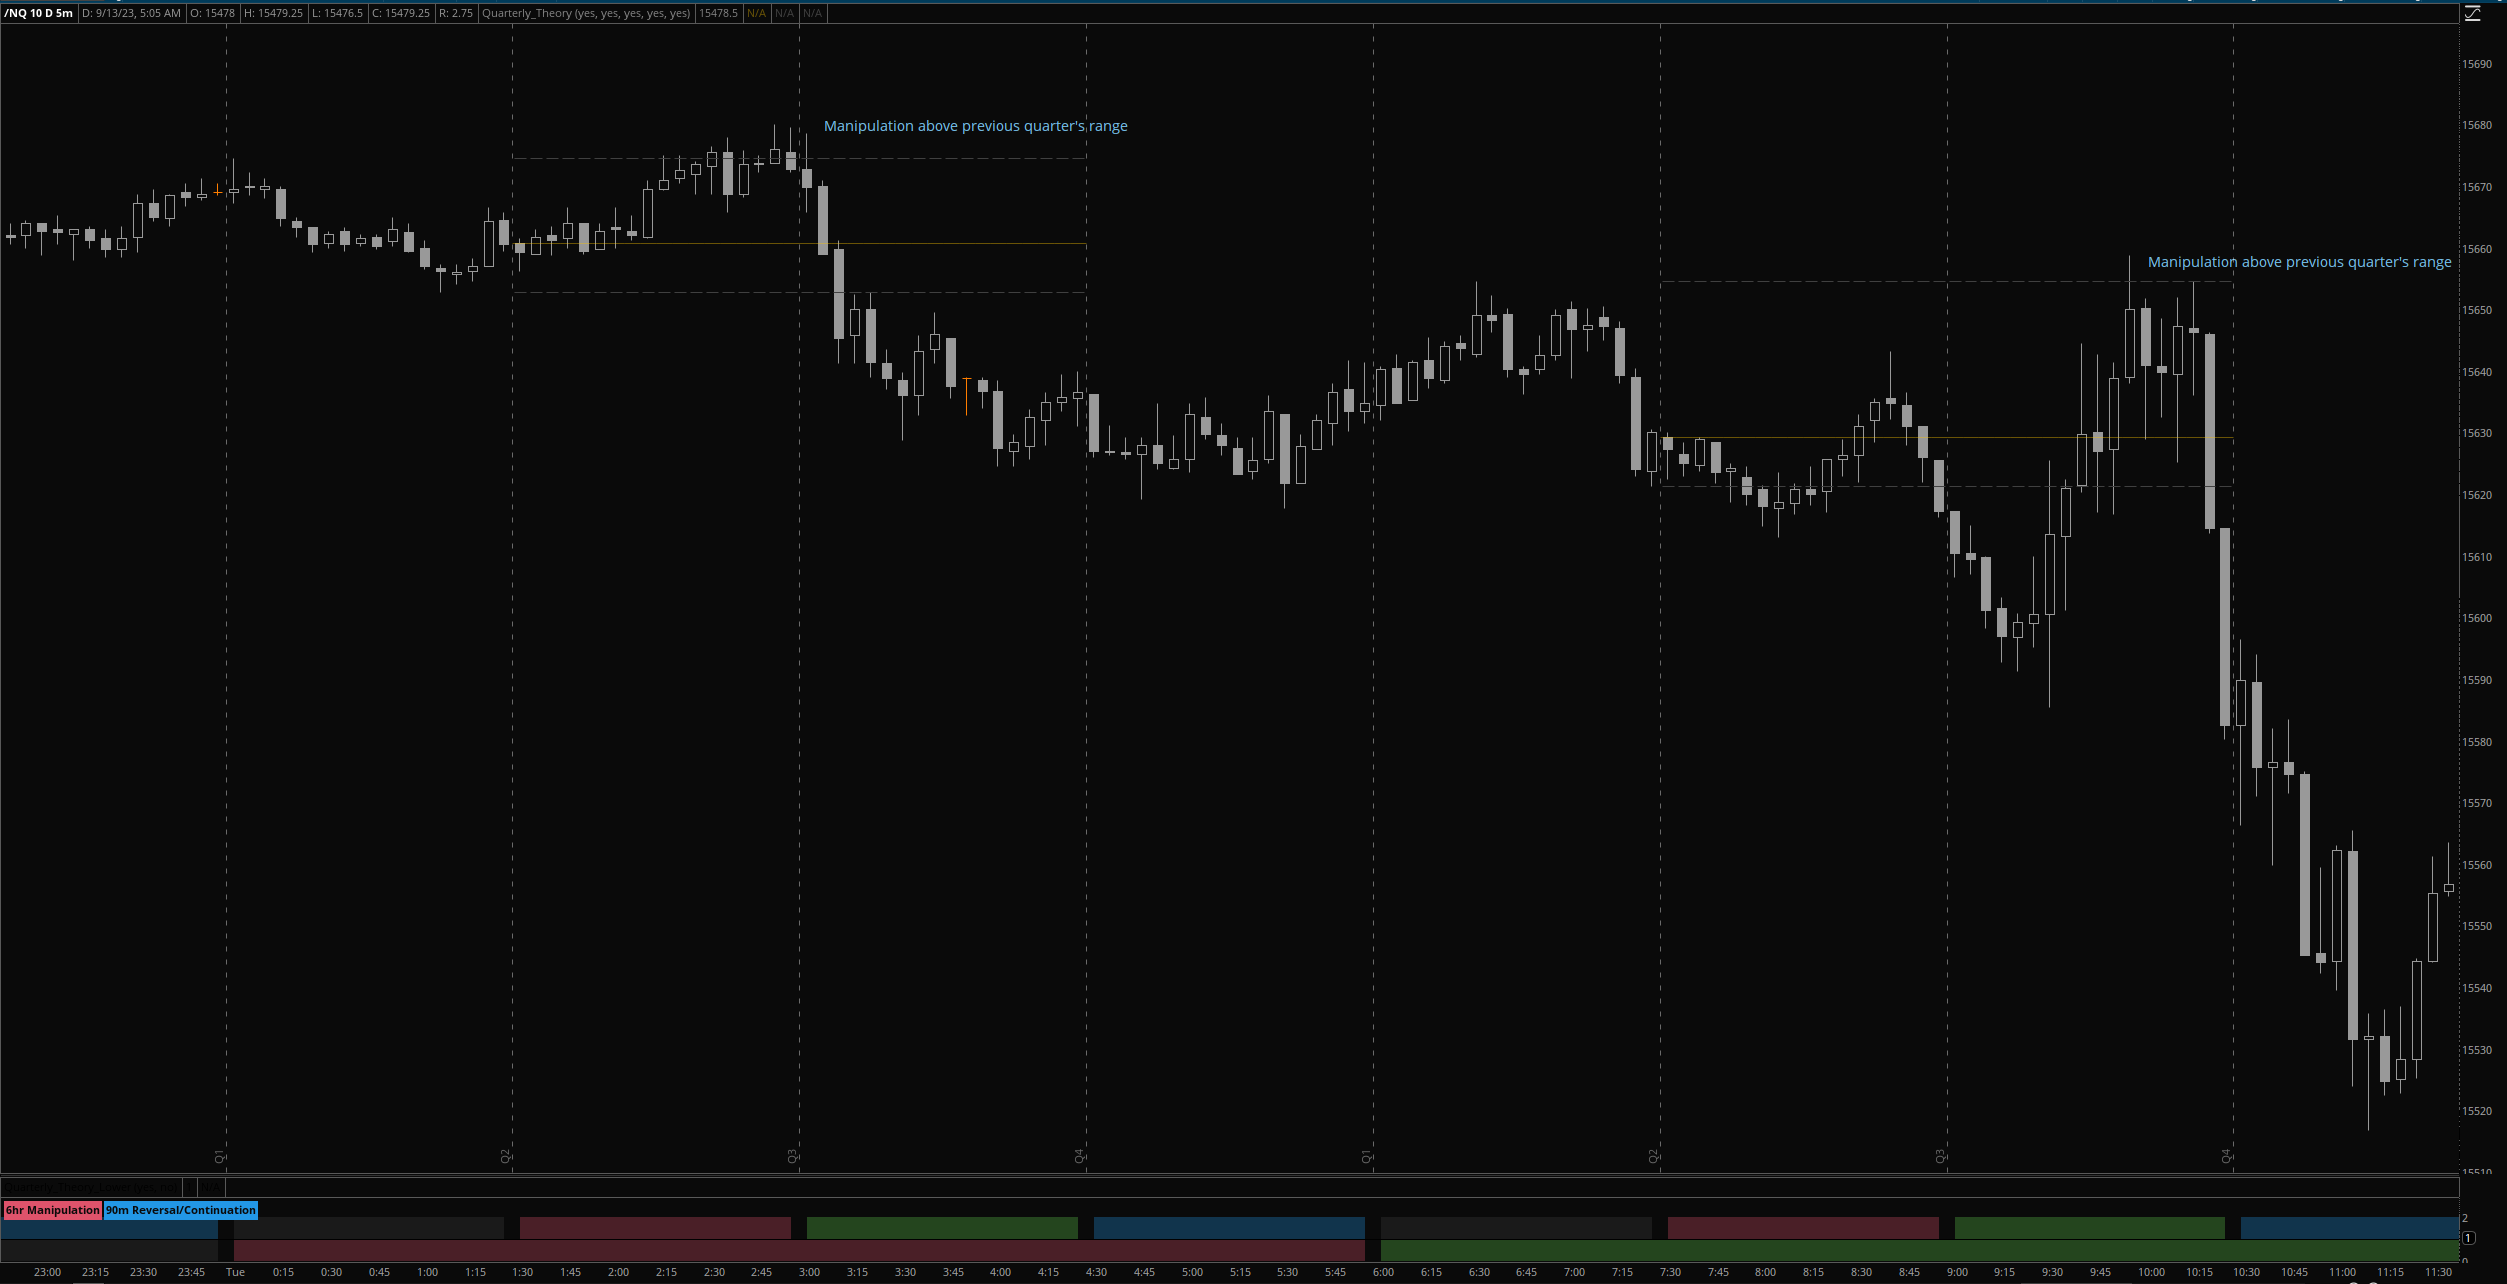
I have focused on the link above - the 6hr cycles and the 90m cycles.
These Quarters represent:
– Daily Cycle:
The Day can be broken down into 6H quarters. These Times roughly define the sessions of the Trading Day, reinforcing the Theory’s validity.
Dividing each of the above Daily Quarters into four, we obtain 90 minute quarters. The first one in a Trading Day – 90min Cycles of the Asian Session – follows as an example, in New York Time.
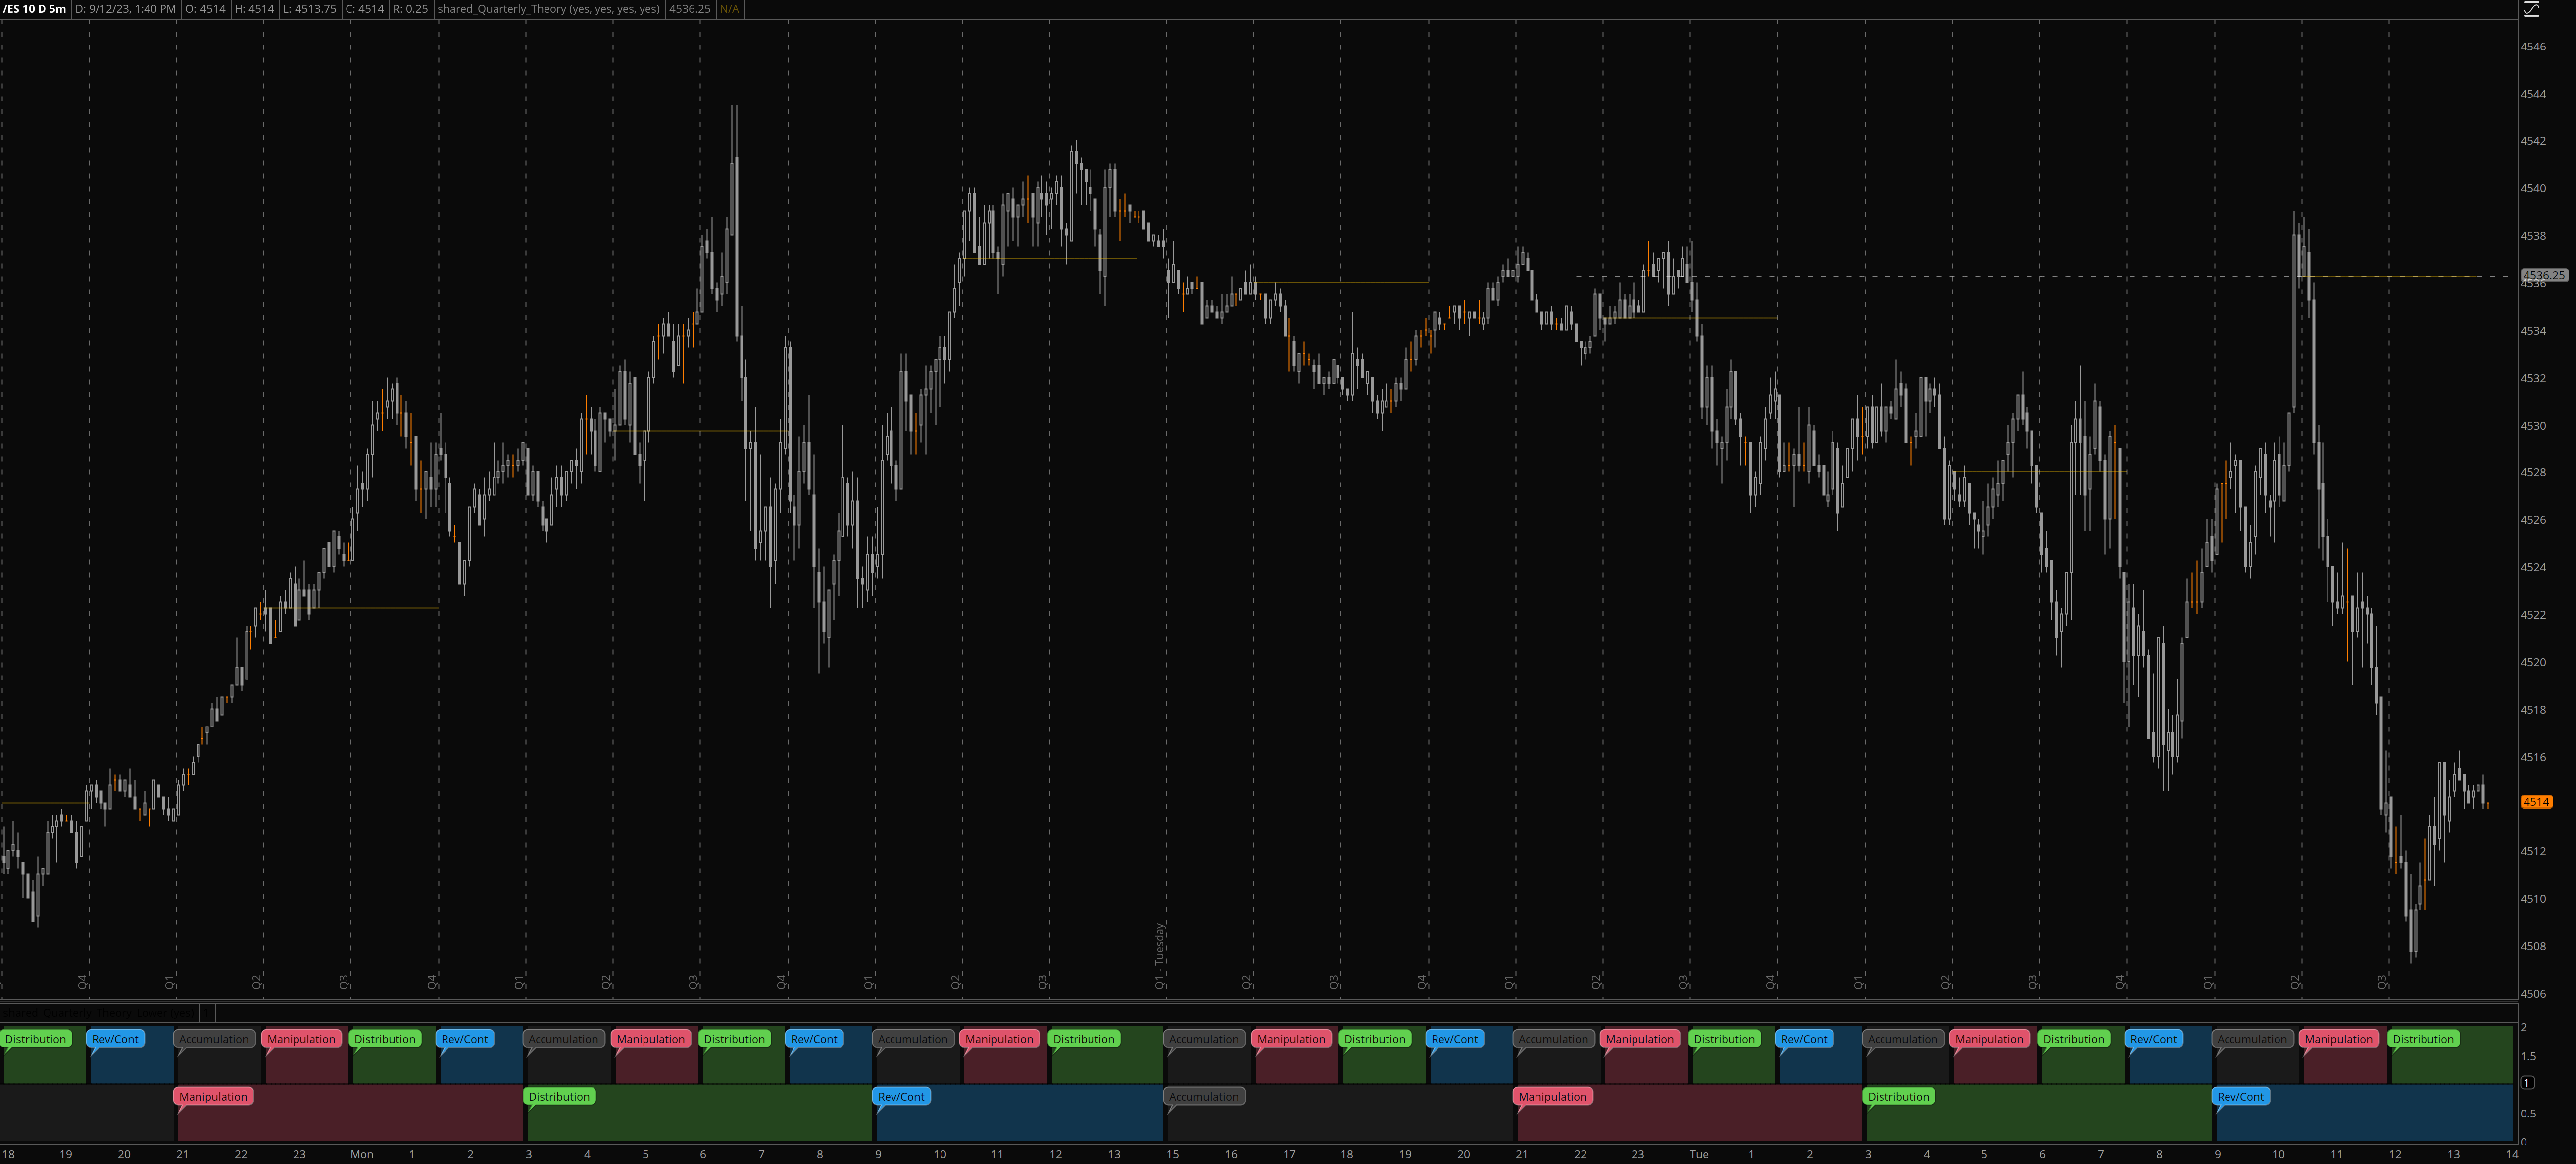
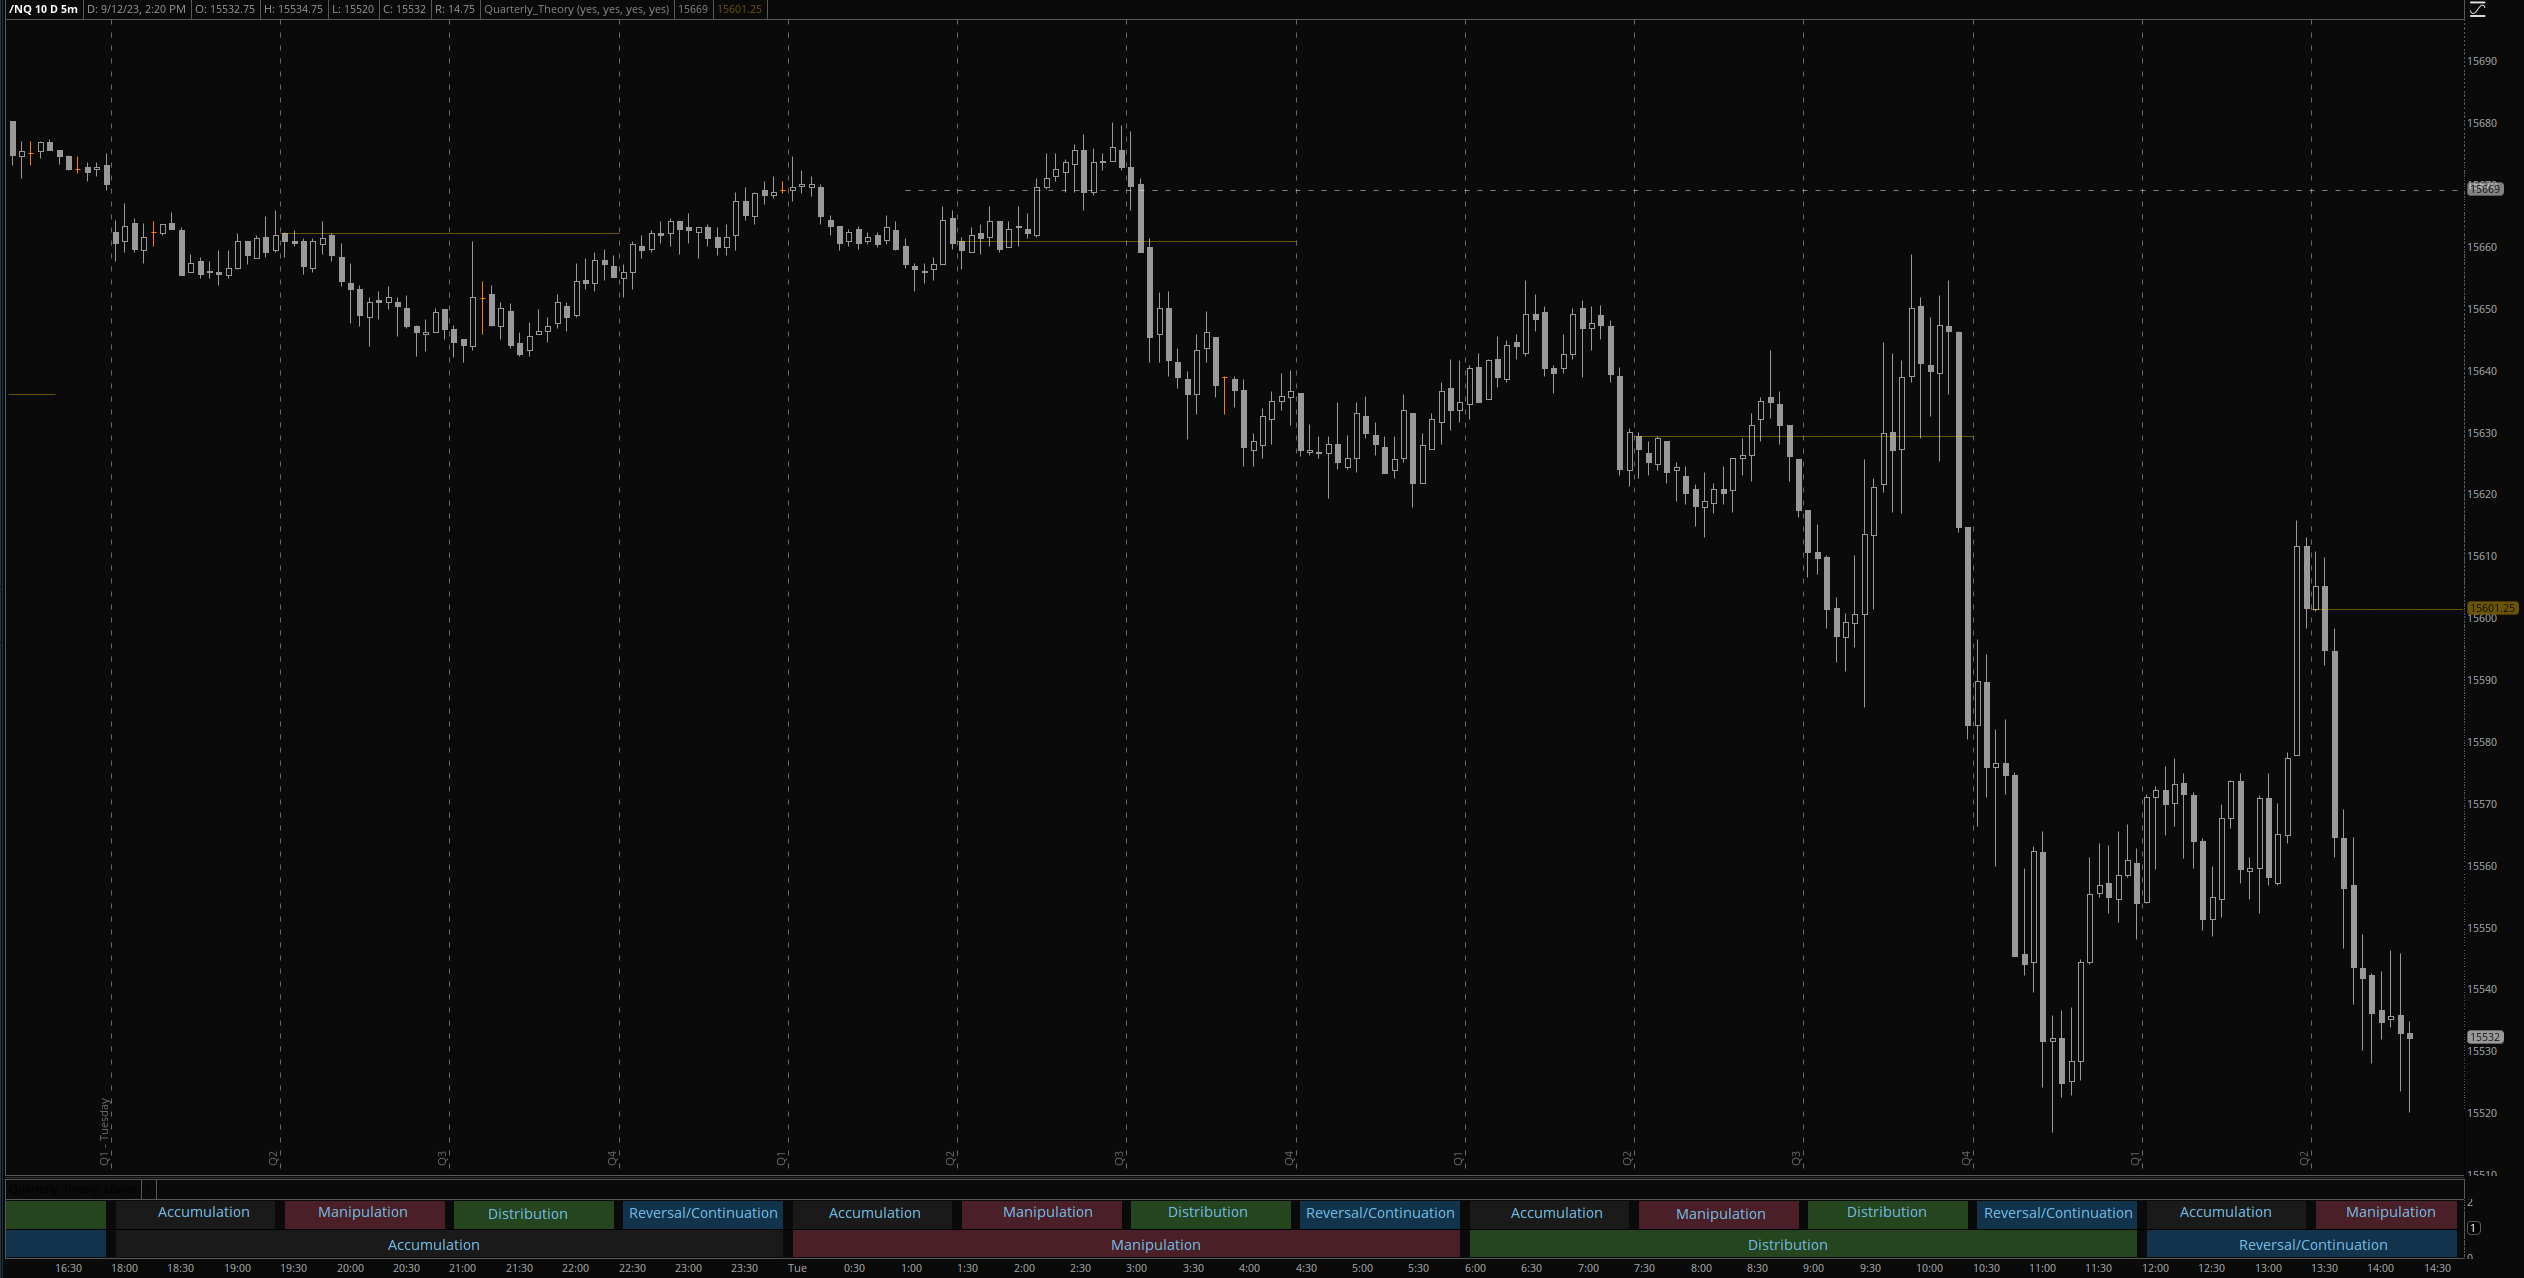
On to the tool and the options. The current version is intended to work on smaller, intraday timeframes. I recommend using it on 15 minutes or below. I have split the tool into two visual components - an upper study that plots the quarterly divisions, the true opens for each quarter (optional), midnight open (optional) and a label for each new day (optional). There is also an option to show vertical lines for the 6hr quarters vs the 90m quarters (default).
Please note that the text on the image has been added manually to assist in understanding the intent of the tool.
There are a couple of quirks with how this interacts with TOS. The 'clouds' at the bottom will always have small gaps between them as TOS wants to leave a candle or so space between them. The smaller your selected timeframe, the smaller the gaps appear. Also, because the session day does not actually go until 6pm, I have elected not to put a 'Q4' for the end of the NY session. Would be happy to offer a version with that but it just looks visually off to me. Here is the shared link for the chart exactly as I have shown. I believe the only thing you need to do is minimize the size of your lower indicator:
https://tos.mx/ER6in7e
The study color scheme is configurable - so you can select whichever 4 colors make the most sense for your charts for the 4 'phases' of the chart. And finally, on to the code:
Upper:
Lower:
I have been inspired to create this tool for TOS by a very clever creator on Twitter (too) who has published a TradingView version here.
I have focused on the link above - the 6hr cycles and the 90m cycles.
These Quarters represent:
- A - Accumulation (required for a cycle to occur)
- M - Manipulation
- D - Distribution
- X - Reversal/Continuation
– Daily Cycle:
The Day can be broken down into 6H quarters. These Times roughly define the sessions of the Trading Day, reinforcing the Theory’s validity.
- Q1 - 18:00 - 00:00, Asian Session
- Q2 - 00:00 - 06:00, London Session (True Open, Midnight New York Time)
- Q3 - 06:00 - 12:00, NY Session
- Q4 - 12:00 - 18:00, PM Session
Dividing each of the above Daily Quarters into four, we obtain 90 minute quarters. The first one in a Trading Day – 90min Cycles of the Asian Session – follows as an example, in New York Time.
- Q1 - 18:00 - 19:30
- Q2 - 19:30 - 21:00 (True Open)
- Q3 - 21:00 - 22:30
- Q4 - 22:30 - 00:00
On to the tool and the options. The current version is intended to work on smaller, intraday timeframes. I recommend using it on 15 minutes or below. I have split the tool into two visual components - an upper study that plots the quarterly divisions, the true opens for each quarter (optional), midnight open (optional) and a label for each new day (optional). There is also an option to show vertical lines for the 6hr quarters vs the 90m quarters (default).
Please note that the text on the image has been added manually to assist in understanding the intent of the tool.
There are a couple of quirks with how this interacts with TOS. The 'clouds' at the bottom will always have small gaps between them as TOS wants to leave a candle or so space between them. The smaller your selected timeframe, the smaller the gaps appear. Also, because the session day does not actually go until 6pm, I have elected not to put a 'Q4' for the end of the NY session. Would be happy to offer a version with that but it just looks visually off to me. Here is the shared link for the chart exactly as I have shown. I believe the only thing you need to do is minimize the size of your lower indicator:
https://tos.mx/ER6in7e
The study color scheme is configurable - so you can select whichever 4 colors make the most sense for your charts for the 4 'phases' of the chart. And finally, on to the code:
Upper:
Ruby:
# Created by @tony_futures inspired by @traderdaye's quarterly theory concept
declare hide_on_daily;
def Midnight = 0000;   #Midnight Open
def oneThirty = 0130;
def three = 0300;
def fourThirty = 0430;
def six = 0600;
def sevenThirty = 0730;
def nine = 0900;
def tenThirty = 1030;
def noon = 1200;
def thirteenThirty = 1330;
def fifteen = 1500;
def NYClose = 1630;
def eighteen = 1800;
def nineteenThirty = 1930;
def twentyOne = 2100;
def twentyTwoThirty = 2230;

DefineGlobalColor("divider", Color.WHITE);
DefineGlobalColor("trueOpen", Color.ORANGE);

def isMidnight = SecondsFromTime(Midnight) == 0;
def isMidnight2 = SecondsFromTime(Midnight) >= 0;
def isOneThirty = SecondsFromTime(oneThirty) == 0;
def isOneThirty2 = SecondsFromTime(oneThirty) >= 0;
def isThree = SecondsFromTime(three) == 0;
def isThree2 = SecondsFromTime(three) >= 0;
def isFourThirty = SecondsFromTime(fourThirty) == 0;
def isFourThirty2 = SecondsFromTime(fourThirty) >= 0;
def isSix = SecondsFromTime(six) == 0;
def isSix2 = SecondsFromTime(six) >= 0;
def isSevenThirty = SecondsFromTime(sevenThirty) == 0;
def isSevenThirty2 = SecondsFromTime(sevenThirty) >= 0;
def isNine = SecondsFromTime(nine) == 0;
def isNine2 = SecondsFromTime(nine) >= 0;
def isTenThirty = SecondsFromTime(tenThirty) == 0;
def isTenThirty2 = SecondsFromTime(tenThirty) >= 0;
def isNoon = SecondsFromTime(noon) == 0;
def isNoon2 = SecondsFromTime(noon) >= 0;
def isThirteenThirty = SecondsFromTime(thirteenThirty) == 0;
def isThirteenThirty2 = SecondsFromTime(thirteenThirty) >= 0;
def isFifteen = SecondsFromTime(fifteen) == 0;
def isFifteen2 = SecondsFromTime(fifteen) >= 0;
def isNYClose = SecondsFromTime(NYClose) == 0;
def isNYClose2 = SecondsFromTime(NYClose) >= 0;
def isEighteen = SecondsFromTime(eighteen) == 0;
def isEighteen2 = SecondsFromTime(eighteen) >= 0;
def isNineteenThirty = SecondsFromTime(nineteenThirty) == 0;
def isNineteenThirty2 = SecondsFromTime(nineteenThirty) >= 0;
def isTwentyOne = SecondsFromTime(twentyOne) == 0;
def isTwentyOne2 = SecondsFromTime(twentyOne) >= 0;
def isTwentyTwoThirty = SecondsFromTime(twentyTwoThirty) == 0;
def isTwentyTwoThirty2 = SecondsFromTime(twentyTwoThirty) >= 0;

input show90 = yes;
input showQ2Opens = yes;
input showMidnight = yes;

def midOpen = if isMidnight then open else midOpen[1];
def today = getDay() == getLastDay();
plot midnightLine = if (today and showMidnight) then midOpen else Double.NaN;
midnightLine.setDefaultColor(GlobalColor("divider"));
midnightLine.setPaintingStrategy(PaintingStrategy.DASHES);

def q2Open = if (isOneThirty OR isSevenThirty OR isThirteenThirty Or isNineteenThirty) then open else q2open[1];
plot trueOpenLine = if showQ2Opens and ((isOneThirty2 and !isFourThirty2) OR (isSevenThirty2 and !isTenThirty2) OR (isThirteenThirty2 and !isNYClose2) OR (isNineteenThirty2 and !isTwentyTwoThirty2)) then q2Open else Double.NaN;
trueOpenLine.setDefaultColor(GlobalColor("trueOpen"));

def DayOfWeek = getDayOfWeek(getYyyyMmDd());
input showDays = yes;
AddVerticalLine(show90 and (isMidnight OR isSix OR isNoon), "Q1", GlobalColor("divider"));
AddVerticalLine(isEighteen,"Q1" + if showDays then (if DayOfWeek == 1 then " - Monday" else if DayOfWeek == 2 then " - Tuesday" else if DayOfWeek == 3 then " - Wednesday" else if DayOfWeek == 4 then " - Thursday" else if DayOfWeek == 5 then " - Friday" else "") else "",GlobalColor("divider"));
AddVerticalLine(show90 and (isOneThirty OR isSevenThirty OR isThirteenThirty Or isNineteenThirty), "Q2", GlobalColor("divider"));
AddVerticalLine(show90 and (isThree OR isNine OR isFifteen OR isTwentyOne), "Q3", GlobalColor("divider"));
AddVerticalLine(show90 and (isFourThirty OR isTenThirty OR isTwentyTwoThirty), "Q4", GlobalColor("divider"));

AddVerticalLine(!show90 and isMidnight, "Q1", GlobalColor("divider"));
AddVerticalLine(!show90 and isSix, "Q2", GlobalColor("divider"));
AddVerticalLine(!show90 and isNoon, "Q3", GlobalColor("divider"));
AddVerticalLine(!show90 and isEighteen, "Q4", GlobalColor("divider"));

# 90m clouds
def isQ1 = (isMidnight2 and !isOneThirty2) OR (isSix2 and !isSevenThirty2) OR (isNoon2 and !isThirteenThirty2) OR (isEighteen2 and !isNineteenThirty2);
def isQ2 = (isOneThirty2 and !isThree2) OR (isSevenThirty2 and !isNine2) OR (isThirteenThirty2 and !isFifteen2) OR (isNineteenThirty2 and !isTwentyOne2);
def isQ3 = (isThree2 and !isFourThirty2) OR (isNine2 and !isTenThirty2) OR (isFifteen2 and !isNYClose2) OR (isTwentyOne2 and !isTwentyTwoThirty2);
def isQ4 = (isFourThirty2 and !isSix2) OR (isTenThirty2 and !isNoon2) OR (isTwentyTwoThirty);

def q1High = if (isMidnight OR isSix OR isNoon OR isEighteen) then high else if isQ1 and high > q1High[1] then high else q1High[1];
def q1Low = if (isMidnight OR isSix OR isNoon OR isEighteen) then low else if isQ1 and low < q1Low[1] then low else q1Low[1];
input showQ1Levels = yes;
plot q1HighLine = if (showQ1Levels and isQ2) OR (showQ1Levels and isQ3) then q1High else Double.NaN;
q1HighLine.setPaintingStrategy(PaintingStrategy.DASHES);
q1HighLine.setDefaultColor(Color.DARK_GRAY);
plot q1LowLine = if (showQ1Levels and isQ2) OR (showQ1Levels and isQ3) then q1Low else Double.NaN;
q1LowLine.setPaintingStrategy(PaintingStrategy.DASHES);
q1LowLine.setDefaultColor(Color.DARK_GRAY);
Lower:
Code:
# Created by @tony_futures inspired by @traderdaye's quarterly theory concept
declare lower;
declare hide_on_daily;
def Midnight = 0000;   #Midnight Open
def oneThirty = 0130;
def three = 0300;
def fourThirty = 0430;
def six = 0600;
def sevenThirty = 0730;
def nine = 0900;
def tenThirty = 1030;
def noon = 1200;
def thirteenThirty = 1330;
def fifteen = 1500;
def eighteen = 1800;
def nineteenThirty = 1930;
def twentyOne = 2100;
def twentyTwoThirty = 2230;

DefineGlobalColor("a", Color.DARK_GRAY);
DefineGlobalColor("m", CreateColor(223,83,107));#Color.DARK_RED);
DefineGlobalColor("d", CreateColor(97,208,79));#Color.DARK_GREEN);
DefineGlobalColor("x", CreateColor(34,151,230));#Color.BLUE);

def isMidnight2 = SecondsFromTime(Midnight) >= 0;
def isOneThirty2 = SecondsFromTime(oneThirty) >= 0;
def isThree2 = SecondsFromTime(three) >= 0;
def isFourThirty2 = SecondsFromTime(fourThirty) >= 0;
def isSix2 = SecondsFromTime(six) >= 0;
def isSevenThirty2 = SecondsFromTime(sevenThirty) >= 0;
def isNine2 = SecondsFromTime(nine) >= 0;
def isTenThirty2 = SecondsFromTime(tenThirty) >= 0;
def isNoon2 = SecondsFromTime(noon) >= 0;
def isThirteenThirty2 = SecondsFromTime(thirteenThirty) >= 0;
def isFifteen2 = SecondsFromTime(fifteen) >= 0;
def isEighteen = SecondsFromTime(eighteen) >= 0;
def isNineteenThirty = SecondsFromTime(nineteenThirty) >= 0;
def isTwentyOne = SecondsFromTime(twentyOne) >= 0;
def isTwentyTwoThirty = SecondsFromTime(twentyTwoThirty) >= 0;

plot divider = 1;
divider.setDefaultColor(Color.BLACK);

# 90m clouds
def isQ1 = (isMidnight2 and !isOneThirty2) OR (isSix2 and !isSevenThirty2) OR (isNoon2 and !isThirteenThirty2) OR (isEighteen and !isNineteenThirty);
AddCloud(if isQ1 then 1 else Double.NaN, 2, GlobalColor("a"), GlobalColor("a"));
def isQ2 = (isOneThirty2 and !isThree2) OR (isSevenThirty2 and !isNine2) OR (isThirteenThirty2 and !isFifteen2) OR (isNineteenThirty and !isTwentyOne);
AddCloud(if isQ2 then 1 else Double.NaN, 2, GlobalColor("m"), GlobalColor("m"));
def isQ3 = (isThree2 and !isFourThirty2) OR (isNine2 and !isTenThirty2) OR (isFifteen2 and !isEighteen) OR (isTwentyOne and !isTwentyTwoThirty);
AddCloud(if isQ3 then 1 else Double.NaN, 2, GlobalColor("d"), GlobalColor("d"));
def isQ4 = (isFourThirty2 and !isSix2) OR (isTenThirty2 and !isNoon2) OR (isTwentyTwoThirty);
AddCloud(if isQ4 then 1 else Double.NaN, 2, GlobalColor("x"), GlobalColor("x"));

# 6hr clouds
def isQ2_6 = isMidnight2 and !isSix2;
AddCloud(if isQ2_6 then 0 else Double.NaN, 1, GlobalColor("m"), GlobalColor("m"));
def isQ3_6 = isSix2 and !isNoon2;
AddCloud(if isQ3_6 then 0 else Double.NaN, 1, GlobalColor("d"), GlobalColor("d"));
def isQ4_6 = isNoon2 and !isEighteen;
AddCloud(if isNoon2 and !isEighteen then 0 else Double.NaN, 1, GlobalColor("x"), GlobalColor("x"));
def isQ1_6 = isEighteen;
AddCloud(if isQ1_6 then 0 else Double.NaN, 1, GlobalColor("a"), GlobalColor("a"));

# 90m labels
input showLabels = yes;
AddLabel(showLabels and isQ1_6, "6hr Accumulation", GlobalColor("a"));
AddLabel(showLabels and isQ2_6, "6hr Manipulation", GlobalColor("m"));
AddLabel(showLabels and isQ3_6, "6hr Distribution", GlobalColor("d"));
AddLabel(showLabels and isQ4_6, "6hr Reversal/Continuation", GlobalColor("x"));
AddLabel(showLabels and isQ1, "90m Accumulation", GlobalColor("a"));
AddLabel(showLabels and isQ2, "90m Manipulation", GlobalColor("m"));
AddLabel(showLabels and isQ3, "90m Distribution", GlobalColor("d"));
AddLabel(showLabels and isQ4, "90m Reversal/Continuation", GlobalColor("x"));

# daily clouds
input showDaily = no;
def DayOfWeek = getDayOfWeek(getYyyyMmDd());
plot divider2 = if showDaily then 0 else Double.NaN;
divider2.setDefaultColor(Color.BLACK);
AddCloud(if showDaily and dayOfWeek == 1 then -1 else Double.NaN, 0, GlobalColor("a"), GlobalColor("a"));
AddCloud(if showDaily and dayOfWeek == 2 then -1 else Double.NaN, 0, GlobalColor("m"), GlobalColor("m"));
AddCloud(if showDaily and dayOfWeek == 3 then -1 else Double.NaN, 0, GlobalColor("d"), GlobalColor("d"));
AddCloud(if showDaily and dayOfWeek == 4 then -1 else Double.NaN, 0, GlobalColor("x"), GlobalColor("x"));
Last edited: