
Author Message:
The Smart Money Range indicator is designed to provide traders with a holistic view of market structure, emphasizing potential key support and resistance levels within a predefined range. This indicator is not just a visually pleasing, but also a comprehensive guide to understanding the market’s dynamics at a given level.
Key Features:
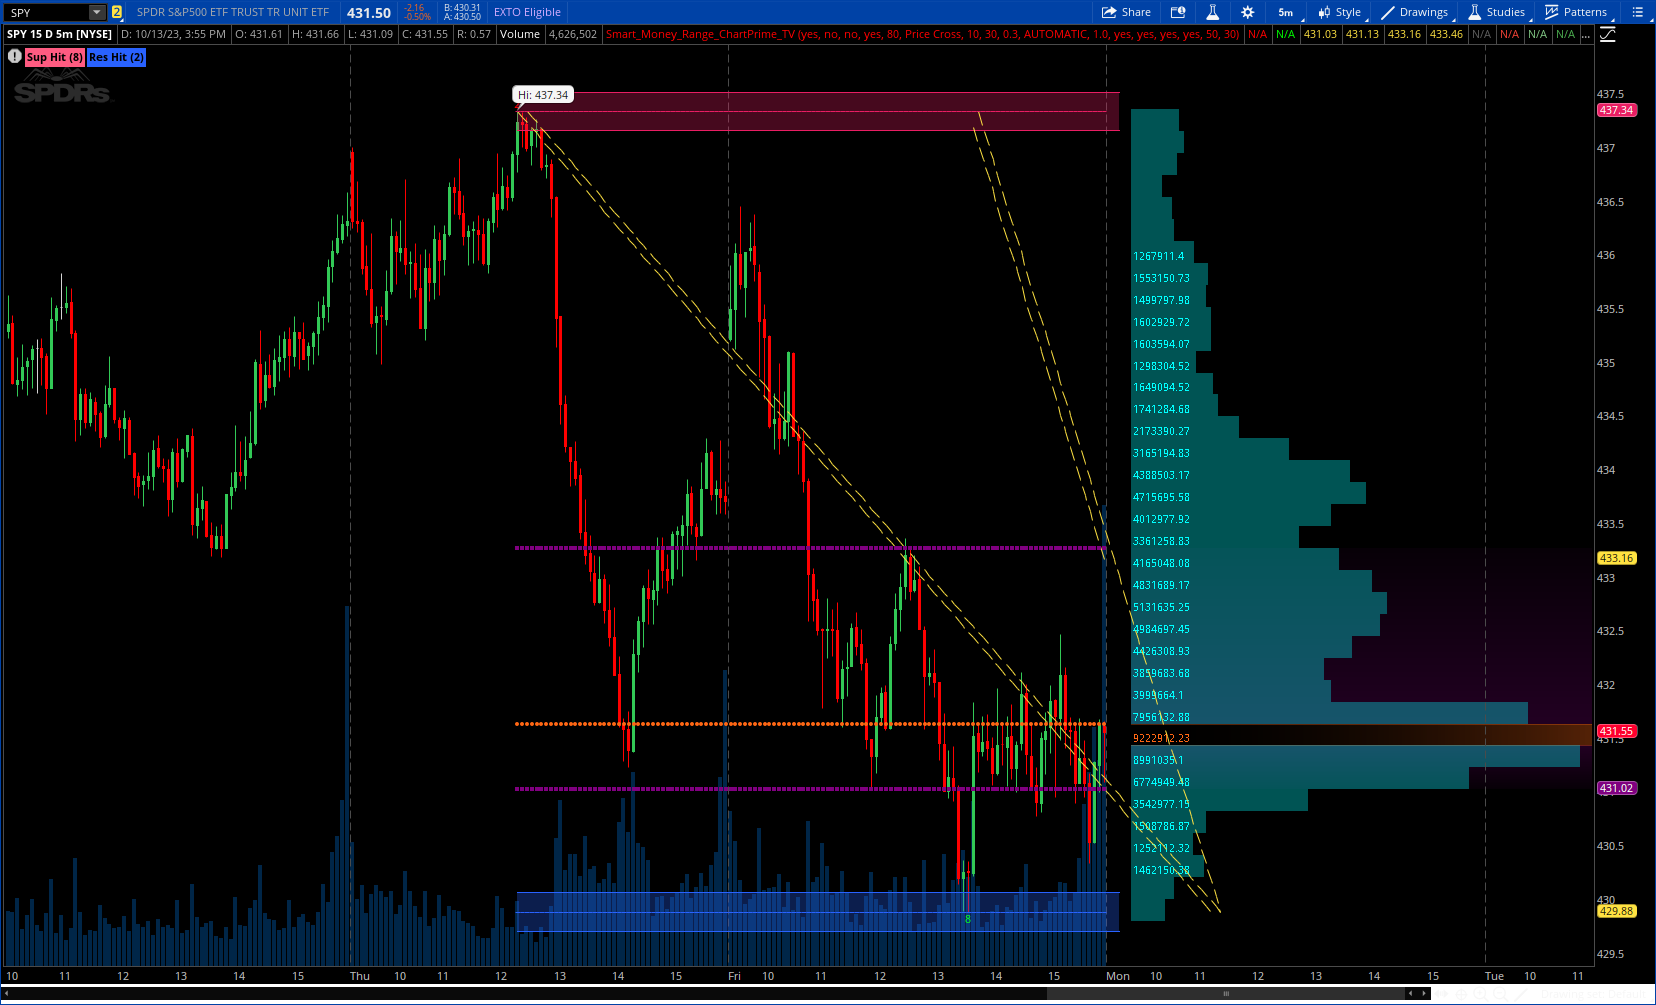
Defined Range: The indicator demarcates a clear range, highlighting support and resistance levels within it. This aids in identifying potential areas of buying and selling pressure. These are derived from highly significant areas that have been touched many times before.
Touches Counter: The numerical values associated with the support and resistance lines show the number of times price has interacted with these levels. This can provide insights into the strength or weakness of a particular level.
Zig-Zag Projections: Within the range, there's a zig-zag pattern indicating possible future touches, helping traders anticipate future price movements.
Double-Sided Profile: To the right of the range, a dual-profile is showcased. One side of the profile displays the volume traded at specific price levels, giving insights into where significant buying or selling has occurred. On the other side, it reflects the number of touches at that given price level, reinforcing the importance of particular price points.
Customizability: Users have the option to adjust the period setting, allowing them to cater the indicator to their specific trading style and configuration. Additionally, with volume levels settings, traders can adjust the number of bins in the profile for a tailored view.
1. Even with zigzag off, the pivots are calculated with future bars. It waits for confirmation on a future bar and then goes back and paints the piviots.mod note: this indicator does not work in real time:
2. The horizontal lines are calculated with the HighestAll function. This function no longer updates in real time. Read more:
https://usethinkscript.com/threads/...e-no-update-in-real-time-in-thinkorswim.8794/
CODE:
shared study link: http://tos.mx/IEXy6Go Click here for --> Easiest way to load shared links
CSS:
# https://www.tradingview.com/v/84zEwHEm/
#// This source code is subject to the terms of the Mozilla Public License 2.0
#// © ChartPrime
#indicator("Smart Money Range [ChartPrime]",shorttitle = "SMR [ChartPrime]"
# Converted by Sam4Cok@Samer800    - 10/2023 - Not typical resutls

input ShowLabel = yes;
input extendLines = no;
input showFiboLevels = no;
input zigzagLine = no;    # "Show Zigzag ?????"
input pivotLength = 60;    # "period"
input countCalculationMethod = {default "Price Cross", "Price Range"};
input thresholdPercentage = 10;
input atrLength = 30;
input atrMulti = 0.3;

def na = Double.NaN;
def last = IsNaN(close);
def hi = high;
def lo = low;
def per = thresholdPercentage / 100;
def perc = close * per;
def srdatr = ATR(Length = atrLength) * atrMulti;
def band_ = Min(srdatr, perc);
def band = band_[20];
def bar = AbsValue(BarNumber());

#-- Color
DefineGlobalColor("up", CreateColor(41, 98, 255));
DefineGlobalColor("Dn", CreateColor(233, 30, 99));
DefineGlobalColor("dup", CreateColor(0, 27, 100));
DefineGlobalColor("dDn", CreateColor(97, 9, 39));
DefineGlobalColor("786", CreateColor(244,67,54));
DefineGlobalColor("618", CreateColor(129,199,132));
DefineGlobalColor("500", CreateColor(76,175,80));
DefineGlobalColor("382", CreateColor(0,150,136));
DefineGlobalColor("236", CreateColor(100,181,246));
DefineGlobalColor("000", CreateColor(95,95,95));
#Counter(lev,sup = true)=>
script Counter {
    input level = close;
    input sup = yes;
    input method = "Price Cross";
    input band = 0;
    def last = isNaN(open);
    def cond = method == "Price Cross";
    def lev = level;
    def bandHi = lev + band;
    def bandLo = lev - band;
    def bar = AbsValue(BarNumber());
    def lastBar = if last then 0 else bar;
    def startBar = bar > HighestAll(lastBar) - 2000;
    def cntDn = if !startBar then 0 else
                if (low[1] < lev) and (close > lev) then cntDn[1] + 1 else cntDn[1];
    def cntUp = if !startBar then 0 else
                if (high[1] > lev) and (close < lev)  then cntUp[1] + 1 else cntUp[1];
    def BandDn = if !startBar then 0 else
                if (low[1] < bandLo) and (close > bandLo) then BandDn[1] + 1 else BandDn[1];
    def BandUp = if !startBar then 0 else
                if (high[1] > bandHi) and (close < bandHi) then BandUp[1] + 1 else BandUp[1];
    def Count = if cond then
                if sup then cntDn else cntUp else
                if sup then BandDn else BandUp;
    def Counter = highestAll(Count);
    plot out = Counter;
}
script FindPivots {
    input dat = close; # default data or study being evaluated
    input HL  = 0;    # default high or low pivot designation, -1 low, +1 high
    input lbL  = 5;    # default Pivot Lookback Left
    input lbR  = 1;    # default Pivot Lookback Right
    ##############
    def _nan;    # used for non-number returns
    def _BN;     # the current barnumber
    def _VStop;  # confirms that the lookforward period continues the pivot trend
    def _V;      # the Value at the actual pivot point
    def _pivotRange;
    ##############
    _BN  = BarNumber();
    _nan = Double.NaN;
    _pivotRange = lbL + lbL;
    _VStop = if !IsNaN(dat[_pivotRange]) and lbR > 0 and lbL > 0 then
                fold a = 1 to lbR + 1 with b=1 while b do
                    if HL > 0 then dat > GetValue(dat, -a) else dat < GetValue(dat, -a) else _nan;
    if (HL > 0) {
        _V = if _BN > lbL and dat == Highest(dat, lbL + 1) and _VStop
            then dat else _nan;
    } else {
        _V = if _BN > lbL and dat == Lowest(dat, lbL + 1) and _VStop
            then dat else _nan;
    }
    plot result = if !IsNaN(_V) and _VStop then _V else _nan;
}
#/ ~~ Pivots {
def startBar = bar > 2000;#bar > HighestAll(bar) - 2100;
def pvtHi_ = findpivots(hi, 1, pivotLength, pivotLength);
def pvtLo_ = findpivots(lo,-1, pivotLength, pivotLength);
def pvtHi = !IsNaN(pvtHi_);
def pvtLo = !IsNaN(pvtLo_);
def ph_   = if pvtHi then hi else ph_[1];
def pl_   = if pvtLo then lo  else pl_[1];
def indH_ = if pvtHi then bar else indH_[1];
def indL_ = if pvtLo then bar else indL_[1];
def phRes  = ph_;
def plSup  = pl_;
def indexH = (indH_);
def indexL = (indL_);
#-- Calc Band
def perPl = plSup * per;
def bandpl_ = Min(srdatr, perPl);
def bandSup = bandpl_[20];
def perPh = phRes * per;
def bandph_ = Min(srdatr, perPh);
def bandRes = bandph_[20];
#-- Cal counter
def SupVal = highestAll(InertiaAll(plSup,2));
def ResVal = highestAll(InertiaAll(phRes,2));
def ValRes = Counter(ResVal,  no, countCalculationMethod, bandRes);
def ValSup = Counter(SupVal, yes, countCalculationMethod, bandSup);
def ResValue = ValRes;
def SupValue = ValSup;
#-- Cal Sup/Res
def barDif = AbsValue(bar - indexH);
def cntRes = min(barDif, 1000);
def cnt = cntRes + 1;
def Sup_Value = fold i = 1 to cnt with p = lo do
                Min(p, GetValue(lo, i));
def Res_Value = fold j = 1 to cnt with q = hi do
                Max(q, GetValue(hi, j));

def SuppValue = Sup_Value;
def RessValue = Res_Value;

def SuppVal = HighestAll(InertiaAll(SuppValue, 2));
def RessVal = HighestAll(InertiaAll(RessValue, 2));

def SupValuePvt  = HighestAll(InertiaAll(SuppValue + band, 2));
def SupValuePvt1 = HighestAll(InertiaAll(SuppValue - band , 2));
def ResValuePVT  = HighestAll(InertiaAll(RessValue - band, 2));
def ResValuePVT1 = HighestAll(InertiaAll(RessValue + band , 2));

def SupportValue = SuppVal;
def ResistValue  = RessVal;

def SupValueLine = (SupValuePvt);
def SupValueLine1 = (SupValuePvt1);

def ResValueLine = (ResValuePVT);
def ResValueLine1 = (ResValuePVT1);

def Sup_Bar = if SuppValue!=SuppValue[1] then bar else Sup_Bar[1];
def Res_Bar = if RessValue!=RessValue[1] then bar else Res_Bar[1];
def SupBar = HighestAll(Sup_Bar);
def ResBar = HighestAll(Res_Bar);
def barLine = Min(ResBar, SupBar);
def startPlot = (barLine);

def startCond = if last[3] then na else
                if extendLines then yes else bar > startPlot-1;

def midUp = if !startCond then na else (ResistValue);
def midLo = if !startCond then na else (SupportValue);
def midVal = (midUp + midLo) / 2;

def upper = if !startCond then na else ResValueLine;
def lower = if !startCond then na else SupValueLine;
def upperATR = if !startCond then na else ResValueLine1;
def lowerATR = if !startCond then na else SupValueLine1;

def SupBarPvt = bar == HighestAll(SupBar);
def ResBarPvt = bar == HighestAll(ResBar);

#-- Plots

plot valueRes = if ResBarPvt then ResValue else na;
valueRes.SetLineWeight(3);
valueRes.SetPaintingStrategy(PaintingStrategy.VALUES_ABOVE);
valueRes.SetDefaultColor(Color.RED);

plot valueSup = if SupBarPvt then SupValue else na;
valueSup.SetLineWeight(3);
valueSup.SetPaintingStrategy(PaintingStrategy.VALUES_BELOW);
valueSup.SetDefaultColor(Color.GREEN);

#-- ZigZag
Script DrawLine {
input fromBar = no;
input toBar = no;
input stVal = close;
input enVal = close;
input fromBarAdd = 0;
input tobarAdd = 0;
    def bar = AbsValue(BarNumber());
    def fromBn = if fromBar then Bar else fromBn[1];
    def toBn = if toBar then Bar else toBn[1];
    def hFromBar = highestAll(fromBn + fromBarAdd);
    def hToBar = highestAll(toBn + tobarAdd);
    def bull = hFromBar > hToBar;
    def fromValH = highestall(stVal);
    def toValH   = highestall(enVal);
    def fromBar1 = hFromBar;#highestAll(ResBar);
    def toBar1   = hToBar;#highestAll(SupBar + 50);
    def slope1  = if bull then (fromValH - enVal) / (fromBar1 - toBar1) else
                               (toValH   - stVal) / (toBar1 - fromBar1);
    def line1 = if bull then enVal + ((bar - toBar1) * slope1) else
                             stVal + ((bar - fromBar1) * slope1);
    plot out = line1;
}

def bull = ResBar > SupBar;
def fromVal = RessVal;
def toVal   = SuppVal + band/2;
def fromValH = highestall(fromVal);
def toValH   = highestall(toVal);

def fromBar1 = highestAll(ResBar);
def toBar1   = highestAll(SupBar + 50);
def fromBar11 = highestAll(ResBar + 2);
def toBar11   = highestAll(SupBar + 52);

def toCond = SuppValue!=SuppValue[1];
def frmCond = RessValue!=RessValue[1];
def line1 = DrawLine(frmCond, toCond, RessVal, SuppVal, 0, 50);
def line11 = DrawLine(frmCond, toCond, RessVal, SuppVal, 2, 52);

def slope1  = if bull then (fromValH - toVal)   / (fromBar1  - toBar1) else
                           (toValH   - fromVal) / (toBar1    - fromBar1);
def slope11 = if bull then (fromValH - toVal)   / (fromBar11 - toBar11) else
                           (toValH   - fromVal) / (toBar11   - fromBar11);

def fromVal2 = SuppVal;
def toVal2   = line1 + band/2;
def fromValH2 = highestall(fromVal2);
def toValH2   = highestall(toVal2 );
def fromBar2  = highestAll(SupBar + 50);
def toBar2    = highestAll(ResBar);

def line2 = DrawLine(toCond, line1==SuppVal, RessValue, SuppVal, 0, 0);
def line22 = DrawLine(toCond, line1==SuppVal, RessVal, SuppVal, 2, 2);

def plotCond = bar > startPlot-1;
def zigPlotCond1  = zigzagLine and line1 >= SupportValue and line1 <= ResistValue and plotCond;
def zigPlotCond11 = zigzagLine and line11 >= SupportValue and line11 <= ResistValue and plotCond;
def zigPlotCond2  = zigzagLine and line2 >= SupportValue and line2 <= ResistValue and plotCond;
def zigPlotCond22  = zigzagLine and line22 >= SupportValue and line22 <= ResistValue and plotCond;

plot ZigZag1  = if zigPlotCond1  then line1 else na;
plot ZigZag11 = if zigPlotCond11 then line11 else na;
plot ZigZag2  = if zigPlotCond2  then line2 else na;
plot ZigZag22 = if zigPlotCond22 then line22 else na;
ZigZag1.SetDefaultColor(GetColor(4));
ZigZag1.SetStyle(Curve.MEDIUM_DASH);
ZigZag11.SetDefaultColor(GetColor(4));
ZigZag11.SetStyle(Curve.MEDIUM_DASH);
ZigZag2.SetDefaultColor(GetColor(4));
ZigZag2.SetStyle(Curve.MEDIUM_DASH);
ZigZag22.SetDefaultColor(GetColor(4));
ZigZag22.SetStyle(Curve.MEDIUM_DASH);


#-- Label

AddLabel(ShowLabel,"Sup Hit ("+ SupValue + ")", GetColor(2));
AddLabel(ShowLabel,"Res Hit ("+ ResValue + ")", GlobalColor("up"));

#-- Cloud
AddCloud(upper, upperATR, GlobalColor("dn"), GlobalColor("dn"), yes);
AddCloud(lowerATR, lower, GlobalColor("up"), GlobalColor("up"), yes);

#-- fibo Calc
#def bull = ResBar > supBar;
def condPlot = showFiboLevels and bar >= startPlot-1 and !last[2];
def SupResDif = (RessVal - SuppVal);
def lvl000 = if bull then SuppVal else RessValue;
def lvl236 = if bull then SuppVal + SupResDif * 0.236 else RessVal - SupResDif * 0.236;
def lvl382 = if bull then SuppVal + SupResDif * 0.382 else RessVal - SupResDif * 0.382;
def lvl500 = if bull then SuppVal + SupResDif * 0.500 else RessVal - SupResDif * 0.500;
def lvl618 = if bull then SuppVal + SupResDif * 0.618 else RessVal - SupResDif * 0.618;
def lvl786 = if bull then SuppVal + SupResDif * 0.786 else RessVal - SupResDif * 0.786;
def lvl100 = if bull then SuppVal + SupResDif * 1.000 else RessVal - SupResDif * 1.000;

plot lvl10 = if condPlot then lvl100 else na;
plot lvl78 = if condPlot then lvl786 else na;
plot lvl61 = if condPlot then lvl618 else na;
plot lvl50 = if condPlot then lvl500 else na;
plot lvl38 = if condPlot then lvl382 else na;
plot lvl23 = if condPlot then lvl236 else na;
plot lvl00 = if condPlot then lvl000 else na;

lvl10.SetPaintingStrategy(PaintingStrategy.DASHES);
lvl78.SetPaintingStrategy(PaintingStrategy.DASHES);
lvl61.SetPaintingStrategy(PaintingStrategy.DASHES);
lvl50.SetPaintingStrategy(PaintingStrategy.DASHES);
lvl38.SetPaintingStrategy(PaintingStrategy.DASHES);
lvl23.SetPaintingStrategy(PaintingStrategy.DASHES);
lvl00.SetPaintingStrategy(PaintingStrategy.DASHES);

lvl10.SetDefaultColor(GlobalColor("000"));
lvl78.SetDefaultColor(GlobalColor("786"));
lvl61.SetDefaultColor(GlobalColor("618"));
lvl50.SetDefaultColor(GlobalColor("500"));
lvl38.SetDefaultColor(GlobalColor("382"));
lvl23.SetDefaultColor(GlobalColor("236"));
lvl00.SetDefaultColor(GlobalColor("000"));

#-- Volume Profile
input pricePerRowHeightMode = {default AUTOMATIC, TICKSIZE, CUSTOM};
input customRowHeight = 1.0;
input onExpansion = yes;
input showVolumeProfile = yes;
input showPointOfControl = yes;
input showValueArea = yes;
input valueAreaPercent = 50;
input opacity = 30;

def cond = !plotCond;
def height;
switch (pricePerRowHeightMode) {
case AUTOMATIC:
    height = PricePerRow.AUTOMATIC;
case TICKSIZE:
    height = PricePerRow.TICKSIZE;
case CUSTOM:
    height = customRowHeight;
}

profile vol = volumeProfile("startNewProfile" = cond, "onExpansion" = onExpansion, "numberOfProfiles" = 1, "pricePerRow" = height, "value area percent" = valueAreaPercent);
def con = compoundValue(1, onExpansion, no);
def pc = if IsNaN(vol.getPointOfControl()) and con then pc[1] else vol.getPointOfControl();
def hVA = if IsNaN(vol.getHighestValueArea()) and con then hVA[1] else vol.getHighestValueArea();
def lVA = if IsNaN(vol.getLowestValueArea()) and con then lVA[1] else vol.getLowestValueArea();

def hProfile = if IsNaN(vol.getHighest()) and con then hProfile[1] else vol.getHighest();
def lProfile = if IsNaN(vol.getLowest()) and con then lProfile[1] else vol.getLowest();
def plotsDomain = !last and plotCond;

plot POC = if plotsDomain and showPointOfControl then pc else Double.NaN;
plot ProfileHigh = if plotsDomain and showVolumeProfile then hProfile else Double.NaN;
plot ProfileLow = if plotsDomain and showVolumeProfile then lProfile else Double.NaN;
plot VAHigh = if plotsDomain and showValueArea then hVA else Double.NaN;
plot VALow = if plotsDomain and showValueArea then lVA else Double.NaN;

DefineGlobalColor("Profile", GetColor(1));
DefineGlobalColor("Point Of Control", GetColor(5));
DefineGlobalColor("Value Area", Color.PLUM);#GetColor(8));

vol.show(if showVolumeProfile then globalColor("Profile") else color.current, if showVolumeProfile then globalColor("Point Of Control") else color.current, if showVolumeProfile then globalColor("Value Area") else color.current, opacity);
POC.SetDefaultColor(globalColor("Point Of Control"));
POC.SetStyle(Curve.POINTS);
VAHigh.SetPaintingStrategy(PaintingStrategy.SQUARES);
VALow.SetPaintingStrategy(PaintingStrategy.SQUARES);
VAHigh.SetDefaultColor(globalColor("Value Area"));
VALow.SetDefaultColor(globalColor("Value Area"));
ProfileHigh.SetPaintingStrategy(PaintingStrategy.DASHES);
ProfileLow.SetPaintingStrategy(PaintingStrategy.DASHES);
ProfileHigh.SetDefaultColor(GlobalColor("dn"));
ProfileLow.SetDefaultColor(GlobalColor("up"));


#-- END of Code
Last edited by a moderator:
