Author Message: - Not typical conversion
Concept Overview
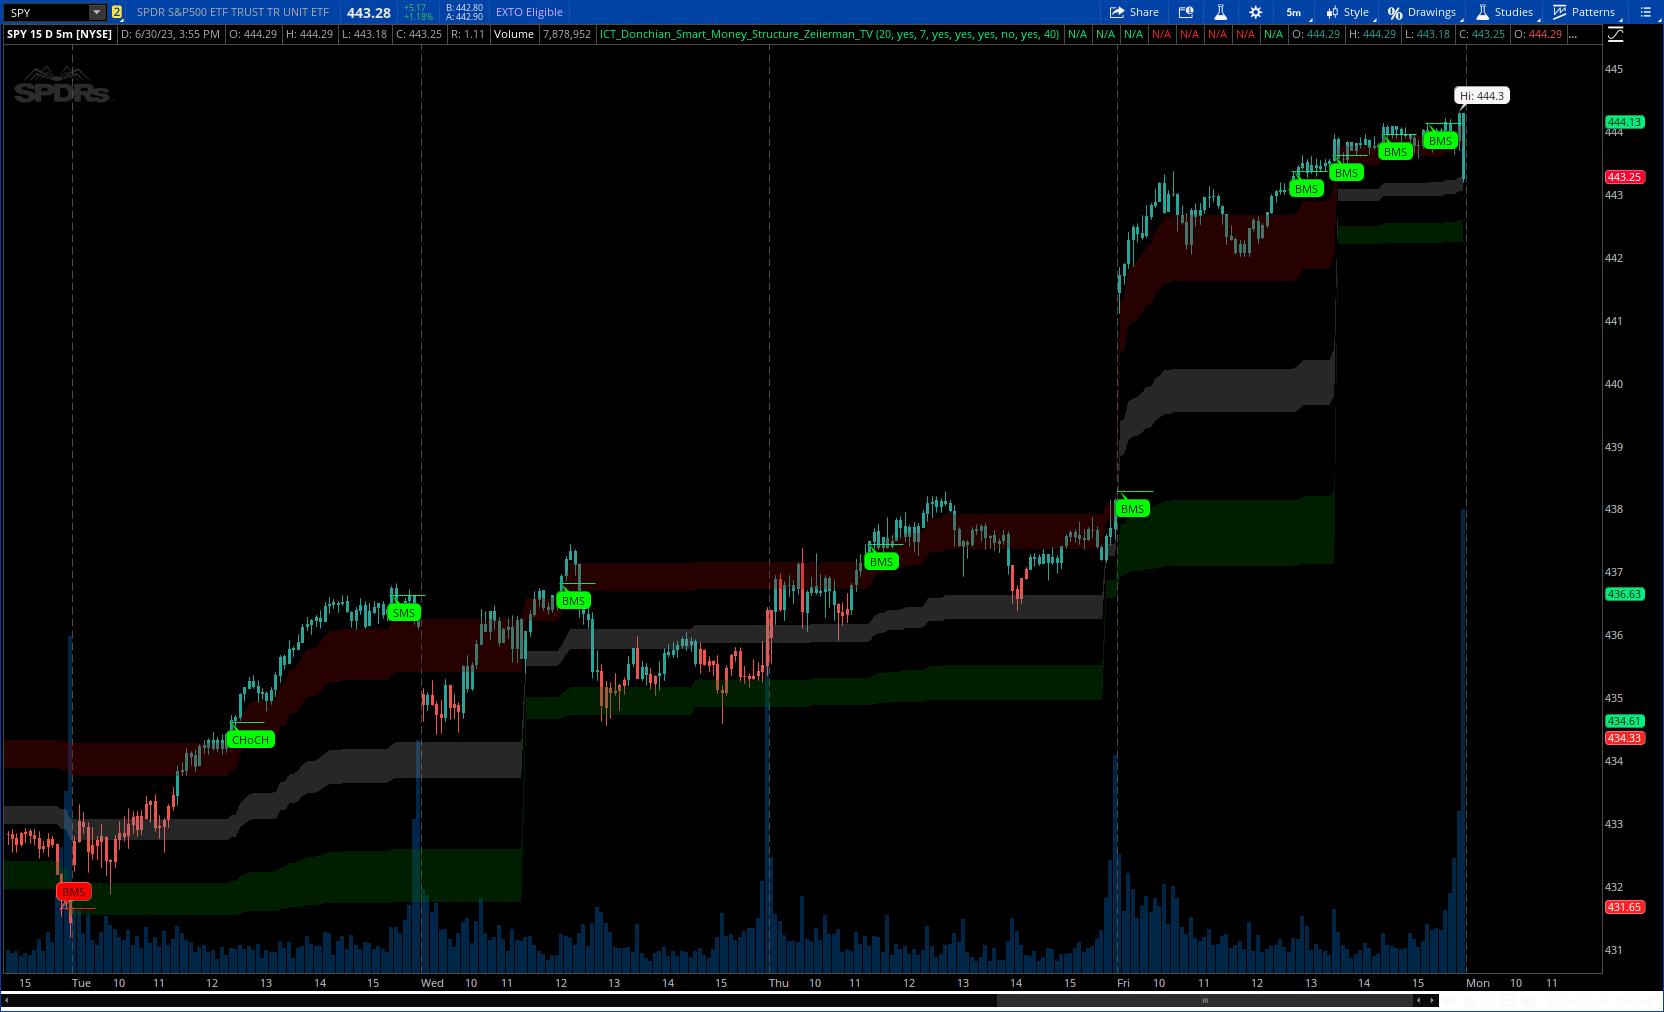
The Inner Circle Trader (ICT) methodology is focused on understanding the actions and implications of the so-called "smart money" - large institutions and professional traders who often influence market movements. Key to this is the concept of market structure and how it can provide insights into potential price moves.
Over time, however, there has been a notable shift in how some traders interpret and apply this methodology. Initially, it was designed with a focus on the fractal nature of markets. Fractals are recurring patterns in price action that are self-similar across different time scales, providing a nuanced and dynamic understanding of market structure.
However, as the ICT methodology has grown in popularity, there has been a drift away from this fractal-based perspective. Instead, many traders have started to focus more on pivot points as their primary tool for understanding market structure.
Pivot points provide static levels of potential support and resistance. While they can be useful in some contexts, relying heavily on them could provide a skewed perspective of market structure. They offer a static, backward-looking view that may not accurately reflect real-time changes in market sentiment or the dynamic nature of markets.
Read more : https://www.tradingview.com/v/rN9I61Q9/
CODE:
CSS:
#// This work is licensed under a Attribution-NonCommercial-ShareAlike 4.0 International (CC BY-NC-SA 4.0)
# https://www.tradingview.com/v/rN9I61Q9/
#// © Zeiierman
#indicator("ICT Donchian Smart Money Structure"
#// ~~ Tooltips {
#string t1 = "Set the pivot period"
#string t2 = "Set the response period. A low value returns a short-term structure and a high value returns a long-term structure. If you disable this option the pivot length above will be used."
#string t3 = "Enable the Donchian Channel."
#string t4 = "A high value returns the long-term structure and a low value returns the short-term structure."
# Converted by Sam4Cok@Samer800 - 07/2023 -
#// ~~ Inputs {
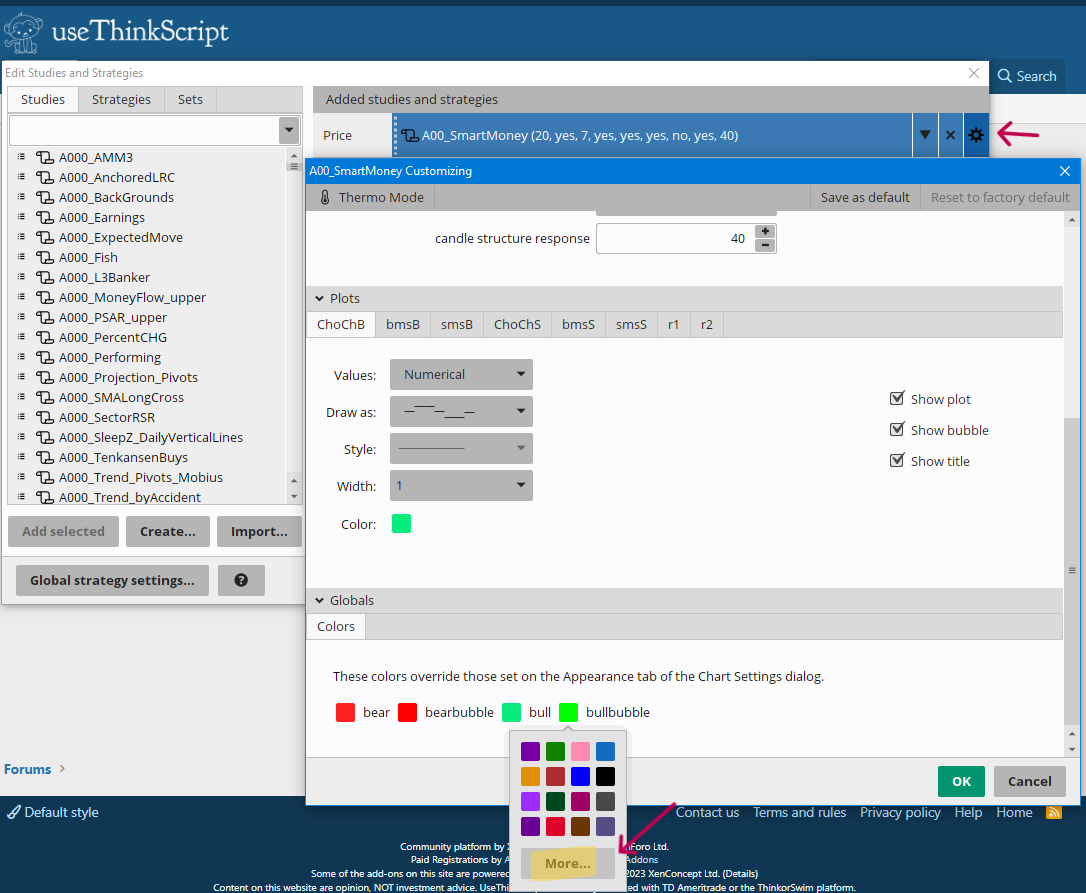
input StructurePeriod = 20; # "Structure Period",tooltip=t1
input StructureResponse = yes; # "Structure Response??"
input StructureResponseLookback = 7; # "resp",tooltip=t2
input BullishStructure = yes; # "Bullish Structure?????"
input BearishStructure = yes; # "Bearish Structure????"
input showPremiumDiscountArea = yes; # "Premium & Discount"
input showDonchianChannel = no; # "Donchian Channel", tooltip=t3
input colorCandles = yes; # "Structure Candles"
input candleStructureResponse = 40; # "Structure Response", inline="", group="Structure Candles" tooltip=t4
#//~~~~~~~~~~~~~~~~~~~~~~~~~~~~~~~~~~~~~~~~~~~~~~~~~~~~~~~~~~~~~~~~~~~~~~~~~~~~~~}
def na = Double.NaN;
def last = isNaN(close[1]);
def prd1 = if StructureResponse then StructureResponseLookback else StructurePeriod;
#-- color
DefineGlobalColor("bull", CreateColor(8, 236, 126));
DefineGlobalColor("bear", CreateColor(255, 34, 34));
DefineGlobalColor("bullbubble", color.green);
DefineGlobalColor("bearbubble", color.red);
script FindPivots {
input dat = close; # default data or study being evaluated
input HL = 0; # default high or low pivot designation, -1 low, +1 high
input lbL = 5; # default Pivot Lookback Left
input lbR = 1; # default Pivot Lookback Right
##############
def _nan; # used for non-number returns
def _BN; # the current barnumber
def _VStop; # confirms that the lookforward period continues the pivot trend
def _V; # the Value at the actual pivot point
##############
_BN = BarNumber();
_nan = Double.NaN;
_VStop = if !IsNaN(dat) and lbR > 0 and lbL > 0 then
fold a = 1 to lbR + 1 with b=1 while b do
if HL > 0 then dat > GetValue(dat, -a) else dat < GetValue(dat, -a) else _nan;
if (HL > 0) {
_V = if _BN > lbL and dat == Highest(dat, lbL + 1) and _VStop
then dat else _nan;
} else {
_V = if _BN > lbL and dat == Lowest(dat, lbL + 1) and _VStop
then dat else _nan;
}
plot result = if !IsNaN(_V) and _VStop then _V else _nan;
}
#// ~~ Pivots {
def up;
def dn;
def Up1 = Max(up[1], high);
def Dn1 = Min(if(dn[1]==0, low, dn[1]), low);
def pvtHi = findpivots(high, 1, StructurePeriod, StructurePeriod);
def pvtLo = findpivots(low, -1, StructurePeriod, StructurePeriod);
if !IsNaN(pvtHi[StructurePeriod]) {
up = pvtHi[StructurePeriod];
dn = Dn1;
} else
if !IsNaN(pvtLo[StructurePeriod]) {
dn = pvtLo[StructurePeriod];
up = Up1;
} else {
up = Up1;
dn = Dn1;
}
#// ~~ Structure {
def pos;def chUp;def smsUp;def bmsUp;def chDn;def smsDn;def bmsDn;
if Up>Up[1] {
if pos[1]<=0 {
chUp = if BullishStructure then Up[1] else chUp[1];
smsUp = smsUp[1];
bmsUp = bmsUp[1];
smsDn = smsDn[1];
bmsDn = bmsDn[1];
chDn = chDn[1];
pos = 1;
} else
if pos[1]==1 and Up>Up[1] and Up[1]==Up[prd1] {
smsUp = if BullishStructure then Up[1] else smsUp[1];
bmsUp = bmsUp[1];
chUp = chUp[1];
smsDn = smsDn[1];
bmsDn = bmsDn[1];
chDn = chDn[1];
pos = 2;
} else
if pos[1] >1 and Up>Up[1] and Up[1]==Up[prd1] {
bmsUp = if BullishStructure then Up[1] else bmsUp[1];
smsUp = smsUp[1];
chUp = chUp[1];
smsDn = smsDn[1];
bmsDn = bmsDn[1];
chDn = chDn[1];
pos = pos[1] + 1;
} else {
smsUp = smsUp[1];
bmsUp = bmsUp[1];
chUp = chUp[1];
smsDn = smsDn[1];
bmsDn = bmsDn[1];
chDn = chDn[1];
pos = pos[1];}
} else
if Dn<Dn[1] {
if pos[1]>=0 {
chDn = if BearishStructure then dn[1] else chDn[1];
smsDn = smsDn[1];
bmsDn = bmsDn[1];
smsUp = smsUp[1];
bmsUp = bmsUp[1];
chUp = chUp[1];
pos = -1;
} else
if pos[1]==-1 and Dn<Dn[1] and Dn[1]==Dn[prd1] {
smsDn = if BearishStructure then dn[1] else smsDn[1];
bmsDn = bmsDn[1];
chDn = chDn[1];
smsUp = smsUp[1];
bmsUp = bmsUp[1];
chUp = chUp[1];
pos = -2;
} else
if pos[1]<-1 and Dn<Dn[1] and Dn[1]==Dn[prd1] {
bmsDn = if BearishStructure then dn[1] else bmsDn[1];
smsDn = smsDn[1];
chDn = chDn[1];
smsUp = smsUp[1];
bmsUp = bmsUp[1];
chUp = chUp[1];
pos = pos[1] - 1;
} else {
smsDn = smsDn[1];
bmsDn = bmsDn[1];
chDn = chDn[1];
smsUp = smsUp[1];
bmsUp = bmsUp[1];
chUp = chUp[1];
pos = pos[1];}
} else {
smsDn = smsDn[1];
bmsDn = bmsDn[1];
chDn = chDn[1];
smsUp = smsUp[1];
bmsUp = bmsUp[1];
chUp = chUp[1];
pos = pos[1];
}
#else if Dn>Dn[1]
# bullish
def chUpCnt = if chUp==chUp[1] then chUpCnt[1] + 1 else 0;
def bmsUpCnt = if bmsUp==bmsUp[1] then bmsUpCnt[1] + 1 else 0;
def smsUpCnt = if smsUp==smsUp[1] then smsUpCnt[1] + 1 else 0;
plot ChoChB = if last or !chUp or chUpCnt > prd1 then na else chUp;
plot bmsB = if last or !bmsUp or bmsUpCnt > prd1 then na else bmsUp;
plot smsB = if last or !smsUp or smsUpCnt > prd1 then na else smsUp;
ChoChB.SetPaintingStrategy(PaintingStrategy.HORIZONTAL);
bmsB.SetPaintingStrategy(PaintingStrategy.HORIZONTAL);
smsB.SetPaintingStrategy(PaintingStrategy.HORIZONTAL);
ChoChB.SetDefaultColor(GlobalColor("bull"));
bmsB.SetDefaultColor(GlobalColor("bull"));
smsB.SetDefaultColor(GlobalColor("bull"));
AddChartBubble(chUp!=chUp[1], chUp, "CHoCH", GlobalColor("bullbubble"), no);
AddChartBubble(bmsUp!=bmsUp[1], bmsUp, "BMS", GlobalColor("bullbubble"), no);
AddChartBubble(smsUp!=smsUp[1], smsUp, "SMS", GlobalColor("bullbubble"), no);
#-- Bearsh
def chDnCnt = if chDn ==chDn[1] then chDnCnt[1] + 1 else 0;
def bmsDnCnt = if bmsDn==bmsDn[1] then bmsDnCnt[1] + 1 else 0;
def smsDnCnt = if smsDn==smsDn[1] then smsDnCnt[1] + 1 else 0;
plot ChoChS = if last or !chDn or chDnCnt > prd1 then na else chDn;
plot bmsS = if last or !bmsDn or bmsDnCnt> prd1 then na else bmsDn;
plot smsS = if last or !smsDn or smsDnCnt> prd1 then na else smsDn;
ChoChS.SetPaintingStrategy(PaintingStrategy.HORIZONTAL);
bmsS.SetPaintingStrategy(PaintingStrategy.HORIZONTAL);
smsS.SetPaintingStrategy(PaintingStrategy.HORIZONTAL);
ChoChS.SetDefaultColor(GlobalColor("bear"));
bmsS.SetDefaultColor(GlobalColor("bear"));
smsS.SetDefaultColor(GlobalColor("bear"));
AddChartBubble(chDn!=chDn[1], chDn, "CHoCH", GlobalColor("bearbubble"), yes);
AddChartBubble(bmsDn!=bmsDn[1], bmsDn, "BMS", GlobalColor("bearbubble"), yes);
AddChartBubble(smsDn!=smsDn[1], smsDn, "SMS", GlobalColor("bearbubble"), yes);
#/ ~~ Premium & Discount {
def PremiumTop = Up - (Up-Dn)*.1;
def PremiumBot = Up - (Up-Dn)*.25;
def DiscountTop = Dn + (Up-Dn)*.25;
def DiscountBot = Dn + (Up-Dn)*.1;
def MidTop = Up - (Up-Dn)*.45;
def MidBot = Dn + (Up-Dn)*.45;
#// ~~ Plots {
plot r1 = if showDonchianChannel then Up else na;#,"Range High",bear2)
plot r2 = if showDonchianChannel then Dn else na;#,"Range Low",bull2)
def p1 = if showPremiumDiscountArea then PremiumTop else na;#,"Premium",na)
def p2 = if showPremiumDiscountArea then PremiumBot else na;#,"Premium",na)
def d1 = if showPremiumDiscountArea then DiscountTop else na;#,"Discount",na)
def d2 = if showPremiumDiscountArea then DiscountBot else na;#,"Discount",na)
def m1 = if showPremiumDiscountArea then MidTop else na;#,"Equilibrium",na)
def m2 = if showPremiumDiscountArea then MidBot else na;#,"Equilibrium",na)
r1.SetDefaultColor(GlobalColor("bear"));
r2.SetDefaultColor(GlobalColor("bull"));
AddCloud(p1,p2,Color.DARK_RED);
AddCloud(d1,d2,Color.DARK_GREEN);
AddCloud(m1,m2, Color.GRAY);#color=color.new(color.gray,75))
#//~~~~~~~~~~~~~~~~~~~~~~~~~~~~~~~~~~~~~~~~~~~~~~~~~~~~~~~~~~~~~~~~~~~~~~~~~~~~~~}
#DonCandles(high_, low_, close_,src_,factor_,candle_,length_)=>
script DonCandles {
input high_ = high;
input low_ = low;
input close_ = close;
input src_ = close;
input factor_ = 1;
input candle_ = 0;
input length_ = 40;
def Don_High = highest(high_,length_);
def Don_Low = lowest(low_,length_);
def Norm = ((close_ - Don_Low) / (Don_High - Don_Low));
def initial = if candle_ then
CompoundValue(1, (Norm * close + ((1 - Norm)) * initial[1]), close) else
CompoundValue(1, (Norm * close + ((1 - Norm*2)) * initial[1]), close);
def Factor = if candle_ then
CompoundValue(1, (1-Norm)* initial[1], src_) else
CompoundValue(1, (if factor_ then (1-Norm*2) else (1-Norm/2)) * initial[1], src_);
def output = (Norm * src_) + Factor;
plot out = output;
}
#// Return Trend Candles
def O = if colorCandles then DonCandles(Up,Dn,close,open,yes,no,candleStructureResponse) else na;
def H = if colorCandles then DonCandles(Up,Dn,close,high,no,no,candleStructureResponse)else na;
def L = if colorCandles then DonCandles(Up,Dn,close,low,no,no,candleStructureResponse)else na;
def C = if colorCandles then DonCandles(Up,Dn,close,close,yes,no,candleStructureResponse)else na;
#// Return Color Sign
script pricewick {
input h_ = high;
input a = low;
def cond = h_>a;
plot out = cond;
}
def cond_open = pricewick(H,open);
def cond_high = pricewick(H,high);
def cond_low = pricewick(H,low);
def cond_close = pricewick(H,close);
def sign = if (cond_open or cond_high or cond_low or cond_close) then 1 else 0;
def dir = colorCandles and open > close;
#// Plot Structure Candles
# Plot the new Chart
AddChart(high = if sign==1 then high else na , low = low , open = if dir then open else close, close = if dir then close else open,
type = ChartType.CANDLE, growcolor = CreateColor(38,166,154));
AddChart(high = if sign==1 then na else high , low = low , open = if dir then open else close, close = if dir then close else open,
type = ChartType.CANDLE, growcolor = CreateColor(239,83,80));
#-- END code
Last edited by a moderator: