* modified for TOS - not exact conversion.
Author Message:
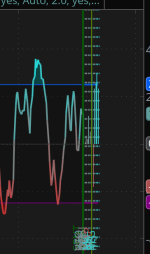
The Market Sentiment Technicals indicator synthesizes insights from diverse technical analysis techniques, including price action market structures, trend indicators, volatility indicators, momentum oscillators, and more.
The indicator consolidates the evaluated outputs from these techniques into a singular value and presents the combined data through an oscillator format, technical rating, and a histogram panel featuring the sentiment of each component alongside the overall sentiment.
Code:
CSS:
#// This is a ToS Indicator
#// © LuxAlgo
#indicator('Market Sentiment Technicals [LuxAlgo]', 'LuxAlgo - Market Sentiment Technicals', true, scale = scale.none)
# Converted and mod by Sam4Cok@Samer800    - 06/2024
declare lower;

input colorBars = yes;
input displayOptions = {default "Oscillator", "Bar Chart","Show Osc & Bar"};
input timeframe  = {default "Chart", "Custom"};
input customTimeframe = AggregationPeriod.FIFTEEN_MIN;
input HorizontalOffset = 3; #, 'Horizontal Offset'
input showMarketSentimentLabel = yes; #, 'Market Sentiment Meter',
input show_Divergence = {"Regular", "Hidden", "All", default "None"}; #  Show Divergence"
input LookBackRight  = 5; # "Pivot Lookback Right"
input LookBackLeft  = 5;  # "Pivot Lookback Left"
input MaxLookback = 60;   # "Max of Lookback Range"
input MinLookback = 5;    # "Min of Lookback Range"
input normalizationLength = 3;    # 'Smoothing'
input useVolumeZoneOscillator = yes;
input vzo_Length = 14;
input useRsi = yes;
input rsiSource = FundamentalType.CLOSE;
input rsi_Length = 14;
input useStochastic = yes;
input stoch_LengthK = 14;      # 'Stochastic %K Length'
input stoch_SmoothK = 3;       # '%K Smoothing'
input useStochasticRsi = yes;
input stochRsiSource = FundamentalType.CLOSE; #, '  RSI Source',
input stochRSI_LengthRSI = 14; # 'RSI Length'
input stochRSI_LengthK   = 14; # 'Stochastic Length'
input stochRSI_SmoothK   = 3;  # '%K Smoothing',
input useCci = yes;
input cciSource = FundamentalType.HLC3; # 'Source'
input cci_Length = 20;
input useBullBearPower = yes;
input bbp_Length = 13;
input useMovingAverage = yes;
input maType    = AverageType.SIMPLE;
input maSource = FundamentalType.CLOSE;
input maLength  = 20;
input useVwap = yes;
input vwapAnchor =  {default "Auto", "DAY", "WEEK", "MONTH", "YEAR"};    # 'Anchor'
input vwapStDev  = 2.0;   # 'StdDev'
input useBollingerBands = yes;
input bb_Type   = AverageType.SIMPLE;
input bbSource = FundamentalType.CLOSE;
input bb_Length = 20;
input bb_Mult   = 2.0;    # 'StdDev'
input useSupertrend = yes;
input SupertrendSource = FundamentalType.HL2;
input st_Period = 10;     # 'ATR Length'
input st_Factor = 3.0;    # 'Factor'
input useLinearRegression = yes;
input LinRegSource = FundamentalType.CLOSE;
input lr_Length = 25;
input useMarketStructure = yes;
input ms_Length = 5;


def na = Double.NaN;
def last = IsNaN(close);
def bar = BarNumber();
def both = displayOptions == displayOptions."Show Osc & Bar";
def candle = displayOptions == displayOptions."Bar Chart" or both;
def osc = displayOptions == displayOptions."Oscillator" or both;

#-- color
DefineGlobalColor("blue", CreateColor(8, 93, 239));
#-- anchor
def agg = GetAggregationPeriod();
def Day = AggregationPeriod.DAY;
def week = AggregationPeriod.WEEK;
def islowDay = AggregationPeriod.FIFTEEN_MIN;
def AnchAuto = if agg <= islowDay then GetDay() else
               if agg < Day then GetWeek() else
               if agg < Week then GetMonth() else GetYear();
def Anchor;
Switch (vwapAnchor) {
Case "DAY" : Anchor = GetDay();
Case "WEEK" : Anchor = GetWeek();
Case "MONTH" : Anchor = GetMonth();
Case "YEAR" : Anchor = GetYear();
Default : Anchor = AnchAuto;
}
def rsi_Source;
def stochRSI_SourceRSI;
def cci_Source;
def ma_source;
def vwap_Source;
def bb_Source;
def st_source;
def lr_Source;
def c;
def c1;
def h;
def l;
def v;
switch (timeframe) {
case "Custom" :
    rsi_Source = Fundamental(FundamentalType = rsiSource, Period = customTimeframe);
    stochRSI_SourceRSI = Fundamental(FundamentalType = stochRsiSource, Period = customTimeframe);
    cci_Source = Fundamental(FundamentalType = cciSource, Period = customTimeframe);
    ma_source = Fundamental(FundamentalType = maSource, Period = customTimeframe);
    vwap_Source = vwap(Period = customTimeframe);
    bb_Source = Fundamental(FundamentalType = bbSource, Period = customTimeframe);
    st_source = Fundamental(FundamentalType = SupertrendSource, Period = customTimeframe);
    lr_Source = Fundamental(FundamentalType = LinRegSource, Period = customTimeframe);
    c = close(Period = customTimeframe);
    c1 = close(Period = customTimeframe)[1];
    h = high(Period = customTimeframe);
    l = low(Period = customTimeframe);
    v = volume(Period = customTimeframe);
default :
    rsi_Source = Fundamental(FundamentalType = rsiSource);
    stochRSI_SourceRSI = Fundamental(FundamentalType = stochRsiSource);
    cci_Source = Fundamental(FundamentalType = cciSource);
    ma_source = Fundamental(FundamentalType = maSource);
    vwap_Source = vwap;
    bb_Source = Fundamental(FundamentalType = bbSource);
    st_source = Fundamental(FundamentalType = SupertrendSource);
    lr_Source = Fundamental(FundamentalType = LinRegSource);
    c = close;
    c1 = close[1];
    h = high;
    l = low;
    v = volume;
}
# stoch(source, high, low, length) =>
script stoch {
    input src = close;
    input h = high;
    input l = low;
    input len = 14;
    def hh = Highest(h, len);
    def ll = Lowest(l, len);
    def c1 = src - ll;
    def c2 = hh - ll;
    def stoch = if c2 != 0 then c1 / c2 * 100 else 0;
    plot return = stoch;
}
script Pivots {
    input series    = close;
    input leftBars  = 10;
    input rightBars = 10;
    input isHigh = yes;
    def na = Double.NaN;
    def HH = series == Highest(series, leftBars + 1);
    def LL = series == Lowest(series, leftBars + 1);
    def pivotRange = (leftBars + rightBars + 1);
    def leftEdgeValue = if series[pivotRange] == 0 then na else series[pivotRange];
    def pvtCond = !IsNaN(series) and leftBars > 0 and rightBars > 0 and !IsNaN(leftEdgeValue);
    def barIndexH = if pvtCond then
                    fold i = 1 to rightBars + 1 with p=1 while p do
                    series > GetValue(series, - i) else na;
    def barIndexL = if pvtCond then
                    fold j = 1 to rightBars + 1 with q=1 while q do
                    series < GetValue(series, - j) else na;
    def PivotPoint;
    if isHigh {
        PivotPoint = if HH and barIndexH then series else na;
    } else {
        PivotPoint = if LL and barIndexL then series else na;
    }
    plot pvt = PivotPoint;
}
Script supertrend {
input factor = 3;
input src = close;
input atr = close;
    def upBand = src + factor * atr;
    def loBand = src - factor * atr;
    def lowerBand; def upperBand;
    def prevLowerBand = if isNaN(lowerBand[1]) then prevLowerBand[1] else lowerBand[1];
    def prevUpperBand = if isNaN(upperBand[1]) then prevUpperBand[1] else upperBand[1];
    lowerBand = if loBand > prevLowerBand or close[1] < prevLowerBand then loBand else prevLowerBand;
    upperBand = if upBand < prevUpperBand or close[1] > prevUpperBand then upBand else prevUpperBand;
    def _direction;
    def superTrend;
    def prevSuperTrend = superTrend[1];
    if isNaN(atr[1]) {
        _direction = 1;
    } else if prevSuperTrend == prevUpperBand {
        _direction = if close > upperBand then -1 else 1;
    } else {
        _direction = if close < lowerBand then 1 else -1;
    }
    superTrend = if _direction == -1 then lowerBand else upperBand;
    plot st = if isNaN(superTrend) then Double.NaN else superTrend;
    plot dir = if isNaN(_direction) then Double.NaN else _direction;
    }
#export f_Vwap(simple string tf, float src, float src_v) =>

script f_Vwap {
    input src = close;
    input tf = close;
    input mult = 2;
    input src_v = volume;
    def isPeriodRolled = compoundValue(1, tf != tf[1], yes);
    def sumSrc0 = src * src_v;
    def sumVol0 = src_v ;
    def sumSrc2 = src_v * Sqr(src);
    def volumeSum;
    def volumeVwapSum;
    def volumeVwap2Sum;
if (isPeriodRolled) {
    volumeSum = src_v;
    volumeVwapSum = src_v * src;
    volumeVwap2Sum = src_v * Sqr(src);
} else {
    volumeSum = compoundValue(1, volumeSum[1] + src_v, src_v);
    volumeVwapSum = compoundValue(1, volumeVwapSum[1] + src_v * src, src_v * src);
    volumeVwap2Sum = compoundValue(1, volumeVwap2Sum[1] + src_v * Sqr(src), src_v * Sqr(src));
}
    def Vwap = volumeVwapSum / volumeSum;
    def deviation = Sqrt(Max(volumeVwap2Sum / volumeSum - Sqr(Vwap), 0));
    def vwapBand = Vwap + deviation * mult;
    plot wap = Vwap;
    plot dev = vwapBand;
}
script interpolate {
    input value = close;
    input valueHigh = high;
    input valueLow = low;
    input rangeHigh = 100;
    input rangeLow = 0;
    def interpolate = rangeLow + (value - valueLow) * (rangeHigh - rangeLow) / (valueHigh - valueLow);
    plot out = if IsNaN(interpolate) then 0 else interpolate;
}
script normalize {
    input src = close;
    input buy = yes;
    input sell = no;
    input smooth = 3;
    def os = if buy then 1 else if sell then -1 else os[1];
    def maxx = if os > os[1] then src else
               if os < os[1] then maxx[1] else Max(src, maxx[1]);
    def minn = if os < os[1] then src else
               if os > os[1] then minn[1] else Min(src, minn[1]);
    def calc = (src - minn) / (maxx - minn);
    def normalize = Average(calc, smooth) * 100;
    def norm = if IsNaN(normalize) then norm[1] else normalize;
    plot out = if IsNaN(norm) then 0 else norm;
}
script getCol {
    input src = close;
    input offset = 6;
    input loc = 1;
    def n = - offset - loc;
    def col = if IsNaN(src[n]) then 0 else
          if src[n] <= 0 then 0 else if src[n] >= 100 then 255 else src[n] * 2.55;
    plot out = col;
}
script getLoc {
    input src = close;
    input offset = 6;
    input loc = 1;
    input cond = no;
    def na = Double.NaN;
    def last = IsNaN(close);
    def n = - offset - loc;
    def n1 = n - 1;
    def result = if !last[n] and last[n1] then src[n] else na;
    plot out = if cond then result else na;
}
# VZO
def cc = hullMovingAvg(c, 9);
def sigV = Sign(cc - cc[1]) * v;
def VP = ExpAverage(sigV, vzo_Length);
def TV = ExpAverage(v, vzo_Length);
def VZO_1 = if TV!=0 then 100 * VP / TV else 0;
def vzo = (VZO_1 + 100) / 2;
def vzo1 = interpolate(vzo, 100, 80, 100, 75);
def vzo2 = interpolate(vzo, 80 , 50, 75 , 50);
def vzo3 = interpolate(vzo, 50 , 20, 50 , 25);
def vzo4 = interpolate(vzo, 20 ,  0, 25 ,  0);
def norVZO = if vzo > 80 then vzo1 else
              if vzo > 50 then vzo2 else
              if vzo > 20 then vzo3 else
              if vzo >= 0 then vzo4 else norVZO[1];
def normVZO = if useVolumeZoneOscillator then norVZO else 0;
# rsi(source, length) =>
def rsi = RSI(Price = rsi_Source, Length = rsi_Length);
def rsi1 = interpolate(rsi, 100, 70, 100, 75);
def rsi2 = interpolate(rsi, 70 , 50, 75 , 50);
def rsi3 = interpolate(rsi, 50 , 30, 50 , 25);
def rsi4 = interpolate(rsi, 30 ,  0, 25 ,  0);
def norRSI = if rsi > 70 then rsi1 else
              if rsi > 50 then rsi2 else
              if rsi > 30 then rsi3 else
              if rsi >= 0 then rsi4 else norRSI[1];
def normRSI = if useRsi then norRSI else 0;
#stochastic(lengthK, smoothK) =>
def stoch = Average(stoch(c, h, l, stoch_LengthK), stoch_SmoothK);
def stoch1 = interpolate(stoch, 100, 80, 100, 75);
def stoch2 = interpolate(stoch, 80 , 50, 75 , 50);
def stoch3 = interpolate(stoch, 50 , 20, 50 , 25);
def stoch4 = interpolate(stoch, 20 ,  0, 25 ,  0);
def norSTO = if stoch > 80 then stoch1 else
              if stoch > 50 then stoch2 else
              if stoch > 20 then stoch3 else
              if stoch >= 0 then stoch4 else norSTO[1];
def normSTO = if useStochastic then norSTO else 0;
#stochastic RSI (rsiSource, rsiLength, stochLengthK, stochSmoothK) =>
def nRsi = RSI(Price = stochRSI_SourceRSI, Length = stochRSI_LengthRSI);
def sRsi = stoch(nRsi, nRsi, nRsi, stochRSI_LengthK);
def stochRSI = Average(sRsi, stochRSI_SmoothK);
def stochR1 = interpolate(stochRSI, 100, 80, 100, 75);
def stochR2 = interpolate(stochRSI, 80 , 50, 75 , 50);
def stochR3 = interpolate(stochRSI, 50 , 20, 50 , 25);
def stochR4 = interpolate(stochRSI, 20 ,  0, 25 ,  0);
def norStoRsi = if stochRSI > 80 then stochR1 else
                 if stochRSI > 50 then stochR2 else
                 if stochRSI > 20 then stochR3 else
                 if stochRSI >= 0 then stochR4 else norStoRsi[1];
def normStoRsi = if useStochasticRsi then norStoRsi else 0;
#cci(source, length) =>
def cciMa = Average(cci_Source, cci_Length);
def linDev = LinDev(cci_Source, cci_Length);
def cci = if linDev == 0 then 0 else (cci_Source - cciMa) / (0.015 * linDev);
def cci1 = interpolate(cci, 300, 100, 100, 75);
def cci2 = interpolate(cci, 100, 0, 75, 50);
def cci3 = interpolate(cci, -100, -300, 25, 0);
def cci4 = interpolate(cci, 0, -100, 50, 25);
def norCCI = if cci > 100  then if cci > 300 then 100 else cci1 else
              if cci >= 0   then cci2 else
              if cci < -100 then if cci < -300 then 0 else cci3 else
              if cci < 0    then cci4 else norCCI[1];
def normCCI = if useCci then norCCI else 0;
# bullBearPower(length) =>
def bbp = h + l - 2 * ExpAverage(c, bbp_Length);
def bPBasis = Average(bbp, 100);
def bPdev = StDev(bbp, 100) * 2;
def bpUp = bPBasis + bPdev;
def bpLo = bPBasis - bPdev;
def bbp1 = interpolate(bbp, 1.5 * bpUp, bpUp, 100, 75);
def bbp2 = interpolate(bbp, bpUp, 0, 75 , 50);
def bbp3 = interpolate(bbp, bpLo, 1.5 * bpLo, 25, 0);
def bbp4 = interpolate(bbp, 0, bpLo, 50 , 25);
def norbP = if bbp > bpUp then if bbp > 1.5 * bpUp then 100 else bbp1 else
             if bbp > 0 then bbp2 else
             if bbp < bpLo then if bbp < 1.5 * bpLo then 0 else bbp3 else
             if bbp < 0 then bbp4 else norbP[1];
def normbP = if useBullBearPower then norbP else 0;
#movingAverage(source, length, maType) =>
def maBasis = MovingAverage(maType, ma_source, maLength);
def norMA =  normalize(c, c > maBasis, c < maBasis, normalizationLength);
def normMA = if useMovingAverage then norMA else 0;
#-- VWAP
#def vwap = f_Vwap(vwap_Source, Anchor, vwapStDev, v).wap;
def vwapUp = f_Vwap(vwap_Source, Anchor, vwapStDev, v).dev;
def vwaoLo = f_Vwap(vwap_Source, Anchor, - vwapStDev, v).dev;
def nomVwap = normalize(c, c > vwapUp, c < vwaoLo, normalizationLength);
def norVwap = if nomVwap[1] then nomVwap[1] else 50;
def normVwap = if useVwap then norVwap else 0;
#bollingerBands(source, length, multiplier, maType) =>
def BBbasis = MovingAverage(bb_Type, bb_Source, bb_Length);
def bbDev = bb_Mult * StDev(bb_Source, bb_Length);
def bbUp = BBbasis + bbDev;
def bbLo = BBbasis - bbDev;
def norBB = normalize(c, c > bbUp, c < bbLo, normalizationLength);
def normBB = if useBollingerBands then norBB else 0;
# Supertrend(factor, period) =>
def tr = if isNaN(h[1]) then h - l else TrueRange(h, c, l);
def nATR = WildersAverage(tr, st_Period);
def supertrend1 = supertrend(st_Factor, st_source, nATR);
def norST = normalize(c, c > supertrend1, c < supertrend1, normalizationLength);
def normST = if useSupertrend then norST else 0;
#linearRegression(source, length) =>
def norLR =  50 * Correlation(lr_Source, bar, lr_Length) + 50;
def normLR = if useLinearRegression then norLR else 0;
#marketStructure(length) =>
def ph_y;
def pl_y;
def ph_cross;
def pl_cross;
def bull;
def bear;
def phMT = pivots(h, ms_Length, ms_Length, yes);
def plMT = pivots(l, ms_Length, ms_Length, no);
if !IsNaN(phMT) {
    ph_y = phMT;
    pl_y = pl_y[1];
    ph_cross = no;
    pl_cross = pl_cross[1];
    bull = no;
    bear = no;
} else if !IsNaN(plMT) {
    ph_y = ph_y[1];
    pl_y = plMT;
    ph_cross = ph_cross[1];
    pl_cross = no;
    bull = no;
    bear = no;
} else if c > ph_y[1] and !ph_cross[1] {
    ph_y = ph_y[1];
    pl_y = pl_y[1];
    ph_cross = yes;
    pl_cross = pl_cross[1];
    bull = yes;
    bear = no;
} else if c < pl_y[1] and !pl_cross[1] {
    ph_y = ph_y[1];
    pl_y = pl_y[1];
    ph_cross = ph_cross[1];
    pl_cross = yes;
    bull = no;
    bear = yes;
} else {
    ph_y = if ph_y[1] then ph_y[1] else h;
    pl_y = if pl_y[1] then pl_y[1] else l;
    ph_cross = ph_cross[1];
    pl_cross = pl_cross[1];
    bull = no;
    bear = no;
}
def norMS = normalize(c, bull, bear, normalizationLength);
def normMS = if useMarketStructure then norMS else 0;

def cnt = (useVolumeZoneOscillator + useRsi + useStochastic + useStochasticRsi + useBullBearPower + useCci +
           useMovingAverage + useVwap + useBollingerBands + useSupertrend + useLinearRegression + useMarketStructure);
def sent = (normVwap + normRSI + normSTO + normStoRsi + normCCI + normbP + normMA + normBB + normST + normLR + normMS + normVZO)/cnt;
def sentiment = Average(sent, 1);

def colSent = if IsNaN(sentiment) then 0 else
          if sentiment <= 0 then 0 else if sentiment >= 100 then 255 else sentiment * 2.55;

#-- plot Osc
plot sentOsc = if !last and osc then if both then sentiment - 50 else sentiment else na;
plot midOsc = if last then na else if osc then (if both then   0 else 50) else na;
plot obOsc = if last  then na else if osc then (if both then  25 else 75) else na;
plot osOsc = if last then na else if osc  then (if both then -25 else 25) else na;
midOsc.SetPaintingStrategy(PaintingStrategy.DASHES);
sentOsc.SetLineWeight(2);
sentOsc.AssignValueColor(CreateColor(255 - colSent, colSent, colSent));
midOsc.SetDefaultColor(Color.DARK_GRAY);
obOsc.SetDefaultColor(GlobalColor("blue"));
osOsc.SetDefaultColor(Color.PLUM);

AssignPriceColor(if !colorBars then Color.CURRENT else CreateColor(255 - colSent, colSent, colSent));
AddCloud(sentOsc, obOsc, Color.CYAN, Color.CURRENT);
AddCloud(osOsc, sentOsc, Color.RED, Color.CURRENT);

def indMs = if useMarketStructure then both + 1 else both;
def indLr = if useLinearRegression then indMs + 1 else indMs;
def indSt = if useSupertrend then indLr + 1 else indLr;
def indBb = if useBollingerBands then indSt + 1 else indSt;
def indVw = if useVwap then indBb + 1 else indBb;
def indMa = if useMovingAverage then indVw + 1 else indVw;
def indBp = if useBullBearPower then indMa + 2 else indMa+1;
def indCc = if useCci then indBp + 1 else indBp;
def indSr = if useStochasticRsi then indCc + 1 else indCc;
def indSo = if useStochastic then indSr + 1 else indSr;
def indRs = if useRsi then indSo + 1 else indSo;
def indVz = if useVolumeZoneOscillator then indRs + 1 else indRs;
def hOffset = if both then -cnt - 4 else HorizontalOffset;
def indSe = if both then indVz + 1 else indVz + 3;

def snCol = getCol(sentiment, hOffset, indMa); #both + 6);
def msCol = getCol(normMS, hOffset, indMs);
def lrCol = getCol(normLR, hOffset, indLr);
def stCol = getCol(normST, hOffset, indSt);
def bbCol = getCol(normBB, hOffset, indBb);
def vwCol = getCol(normVwap, hOffset, indVw);
def maCol = getCol(normMA, hOffset, indMa);
def bpCol = getCol(normbP, hOffset, indBp);
def ccCol = getCol(normCCI, hOffset, indCc);
def srCol = getCol(normStoRsi, hOffset, indSr);
def soCol = getCol(normSTO, hOffset, indSo);
def rsCol = getCol(normRSI, hOffset, indRs);
def vzCol = getCol(normVZO, hOffset, indVz);
#----
def senBar = getLoc(sentiment, hOffset, indSe, candle);
def msBar = if useMarketStructure  then getLoc(normMS, hOffset, indMs, candle) else na;
def lrBar = if useLinearRegression then getLoc(normLR, hOffset, indLr, candle) else na;
def stBar = if useSupertrend       then getLoc(normST, hOffset, indSt, candle) else na;
def bbBar = if useBollingerBands   then getLoc(normBB, hOffset, indBb, candle) else na;
def vwBar = if useVwap           then getLoc(normVwap, hOffset, indVw, candle) else na;
def maBar = if useMovingAverage    then getLoc(normMA, hOffset, indMa, candle) else na;
def bpBar = if useBullBearPower    then getLoc(normbP, hOffset, indBp, candle) else na;
def ccBar = if useCci             then getLoc(normCCI, hOffset, indCc, candle) else na;
def srBar = if useStochasticRsi then getLoc(normStoRsi, hOffset, indSr, candle) else na;
def soBar = if useStochastic       then getLoc(normSTO, hOffset, indSo, candle) else na;
def rsBar = if useRsi              then getLoc(normRSI, hOffset, indRs, candle) else na;
def vzBar = if useVolumeZoneOscillator then getLoc(normVZO, hOffset, indVz, candle) else na;

def lvl1 = sentiment <= 20;
def lvl2 = sentiment < 40 and !lvl1;
def lvl3 = sentiment < 60 and !lvl2;
def lvl4 = sentiment < 80 and !lvl3;
def lvl5 = sentiment >= 80;
def lv1 = senBar <= 20;
def lv2 = senBar < 40 and !lv1;
def lv3 = senBar < 60 and !lv2;
def lv4 = senBar < 80 and !lv3;
def lv5 = senBar >= 80;

#-- Bar Chart

plot msBarPlot = msBar - 50;
plot lrBarPlot = lrBar - 50;
plot stBarPlot = stBar - 50;
plot bbBarPlot = bbBar - 50;
plot vwBarPlot = vwBar - 50;
plot maBarPlot = maBar - 50;
plot bpBarPlot = bpBar - 50;
plot ccBarPlot = ccBar - 50;
plot srBarPlot = srBar - 50;
plot soBarPlot = soBar - 50;
plot rsBarPlot = rsBar - 50;
plot vzBarPlot = vzBar - 50;
msBarPlot.SetPaintingStrategy(PaintingStrategy.HISTOGRAM);
lrBarPlot.SetPaintingStrategy(PaintingStrategy.HISTOGRAM);
stBarPlot.SetPaintingStrategy(PaintingStrategy.HISTOGRAM);
bbBarPlot.SetPaintingStrategy(PaintingStrategy.HISTOGRAM);
vwBarPlot.SetPaintingStrategy(PaintingStrategy.HISTOGRAM);
maBarPlot.SetPaintingStrategy(PaintingStrategy.HISTOGRAM);
bpBarPlot.SetPaintingStrategy(PaintingStrategy.HISTOGRAM);
ccBarPlot.SetPaintingStrategy(PaintingStrategy.HISTOGRAM);
srBarPlot.SetPaintingStrategy(PaintingStrategy.HISTOGRAM);
soBarPlot.SetPaintingStrategy(PaintingStrategy.HISTOGRAM);
rsBarPlot.SetPaintingStrategy(PaintingStrategy.HISTOGRAM);
vzBarPlot.SetPaintingStrategy(PaintingStrategy.HISTOGRAM);

msBarPlot.AssignValueColor(CreateColor(255 - msCol, msCol, msCol));
lrBarPlot.AssignValueColor(CreateColor(255 - lrCol, lrCol, lrCol));
stBarPlot.AssignValueColor(CreateColor(255 - stCol, stCol, stCol));
bbBarPlot.AssignValueColor(CreateColor(255 - bbCol, bbCol, bbCol));
vwBarPlot.AssignValueColor(CreateColor(255 - vwCol, vwCol, vwCol));
maBarPlot.AssignValueColor(CreateColor(255 - maCol, maCol, maCol));
bpBarPlot.AssignValueColor(CreateColor(255 - bpCol, bpCol, bpCol));
ccBarPlot.AssignValueColor(CreateColor(255 - ccCol, ccCol, ccCol));
srBarPlot.AssignValueColor(CreateColor(255 - srCol, srCol, srCol));
soBarPlot.AssignValueColor(CreateColor(255 - soCol, soCol, soCol));
rsBarPlot.AssignValueColor(CreateColor(255 - rsCol, rsCol, rsCol));
vzBarPlot.AssignValueColor(CreateColor(255 - vzCol, vzCol, vzCol));
msBarPlot.SetLineWeight(3);
lrBarPlot.SetLineWeight(3);
stBarPlot.SetLineWeight(3);
bbBarPlot.SetLineWeight(3);
vwBarPlot.SetLineWeight(3);
maBarPlot.SetLineWeight(3);
bpBarPlot.SetLineWeight(3);
ccBarPlot.SetLineWeight(3);
srBarPlot.SetLineWeight(3);
soBarPlot.SetLineWeight(3);
rsBarPlot.SetLineWeight(3);
vzBarPlot.SetLineWeight(3);
#-- sentBar

plot sentBar = senBar - 50; #if osc then na else if !last and last[-1] then sentiment - 50 else na;
sentBar.SetLineWeight(5);
sentBar.SetPaintingStrategy(PaintingStrategy.HISTOGRAM);
sentBar.AssignValueColor(if lv1 then Color.RED else
                         if lv2 then Color.DARK_RED else
                         if lv3 then Color.GRAY else
                         if lv4 then Color.DARK_GREEN else
                         if lv5 then Color.GREEN else Color.GRAY);

#-- lines
#indSe
def lineCond = last[-hOffset- cnt - 3] and !last[-hOffset - (both + both)] and candle;
plot ob2  = if lineCond then 25 else na;
plot os2  = if lineCond then -25 else na;
plot zero = if lineCond then 0 else na;

ob2.SetLineWeight(2);
os2.SetLineWeight(2);
ob2.SetDefaultColor(GlobalColor("blue"));
os2.SetDefaultColor(Color.PLUM);
zero.SetDefaultColor(Color.DARK_GRAY);

AddVerticalLine(sentBar[1], "SENT", if lv1[1] then Color.RED else
                         if lv2[1] then Color.DARK_RED else
                         if lv3[1] then Color.GRAY else
                         if lv4[1] then Color.DARK_GREEN else
                         if lv5[1] then Color.GREEN else Color.GRAY, Curve.FIRM);
AddVerticalLine(sentBar, "",  if lv1 then Color.RED else
                         if lv2 then Color.DARK_RED else
                         if lv3 then Color.GRAY else
                         if lv4 then Color.DARK_GREEN else
                         if lv5 then Color.GREEN else Color.GRAY, Curve.FIRM);

def cntBar = getLoc(yes, hOffset,indMa, candle);

AddVerticalLine(candle and cntBar, "",  CreateColor(255-snCol, snCol, 0), Curve.FIRM); #, Curve.FIRM);
AddVerticalLine(msBar[1], "MS",  CreateColor(255 - msCol[1], msCol[1], msCol[1]), Curve.POINTS);
AddVerticalLine(lrBar[1], "REG", CreateColor(255 - lrCol[1], lrCol[1], lrCol[1]), Curve.POINTS);
AddVerticalLine(stBar[1], "ST",  CreateColor(255 - stCol[1], stCol[1], stCol[1]), Curve.POINTS);
AddVerticalLine(bbBar[1], "BB",  CreateColor(255 - bbCol[1], bbCol[1], bbCol[1]), Curve.POINTS);
AddVerticalLine(vwBar[1], "WAP", CreateColor(255 - vwCol[1], vwCol[1], vwCol[1]), Curve.POINTS);
AddVerticalLine(maBar[1], "MA",  CreateColor(255 - maCol[1], maCol[1], maCol[1]), Curve.POINTS);
AddVerticalLine(bpBar[1], "BBP", CreateColor(255 - bpCol[1], bpCol[1], bpCol[1]), Curve.POINTS);
AddVerticalLine(ccBar[1], "CCI", CreateColor(255 - ccCol[1], ccCol[1], ccCol[1]), Curve.POINTS);
AddVerticalLine(srBar[1], "stRSI", CreateColor(255 - srCol[1], srCol[1], srCol[1]), Curve.POINTS);
AddVerticalLine(soBar[1], "% K",  CreateColor(255 - soCol[1], soCol[1], soCol[1]), Curve.POINTS);
AddVerticalLine(rsBar[1], "RSI", CreateColor(255 - rsCol[1], rsCol[1], rsCol[1]), Curve.POINTS);
AddVerticalLine(vzBar[1], "VZO", CreateColor(255 - vzCol[1], vzCol[1], vzCol[1]), Curve.POINTS);

#-- label
def rndSnt = Round(sentiment, 2);

script score {
    input src = close;
    def score = if src < 20 then 1 else
                if src < 40 then 2 else
                if src < 60 then 3 else
                if src < 80 then 4 else
                if src >= 80 then 5 else score[1];
    plot out = if IsNaN(score) then 0 else score;
}

AddLabel(showMarketSentimentLabel, (if lvl1 then "Strong Bearish(" else
                                    if lvl2 then "Bearish(" else
                                    if lvl3 then "Neutral(" else
                                    if lvl4 then "Bullish(" else
        if lvl5 then "Strong Bullish (" else "No Data(") + rndSnt + "%)",
                         if lvl1 then Color.RED else
                         if lvl2 then Color.DARK_RED else
                         if lvl3 then Color.GRAY else
                         if lvl4 then Color.DARK_GREEN else
                         if lvl5 then Color.GREEN else Color.GRAY);
#CreateColor(255 - colSent, colSent, 0));

def pos = Double.POSITIVE_INFINITY;
def neg = Double.NEGATIVE_INFINITY;
def n = -hOffset - cnt - 5;
def cond = !last[n] and !osc;
def SentScore = score(sentiment);
#sentiment
def inlvl1 = HighestAll(InertiaAll(SentScore, 2)) == 1;
def inlvl2 = HighestAll(InertiaAll(SentScore, 2)) == 2;
def inlvl3 = HighestAll(InertiaAll(SentScore, 2)) == 3;
def inlvl4 = HighestAll(InertiaAll(SentScore, 2)) == 4;
def inlvl5 = HighestAll(InertiaAll(SentScore, 2)) == 5;
AddCloud(if cond and inlvl1 then pos else na, neg, Color.RED);
AddCloud(if cond and inlvl2 then pos else na, neg, Color.DARK_RED);
AddCloud(if cond and inlvl3 then pos else na, neg, Color.GRAY);
AddCloud(if cond and inlvl4 then pos else na, neg, Color.DARK_GREEN);
AddCloud(if cond and inlvl5 then pos else na, neg, Color.GREEN);

#----Div-----------

def divSrc = sentOsc;
def RegDiv; def HidDiv;
Switch (show_Divergence) {
Case "Regular" :
    RegDiv = yes;
    HidDiv = no;
Case "Hidden" :
    RegDiv = no;
    HidDiv = yes;
Case "All" :
    RegDiv = yes;
    HidDiv = yes;
Default :
    RegDiv = no;
    HidDiv = no;
}
def ShowLastDivLines = RegDiv;
def ShowLastHiddenDivLines = HidDiv;
def DivBull = RegDiv;
def DivBear = RegDiv;
def DivHiddenBull = HidDiv;
def DivHiddenBear = HidDiv;
#_inRange(cond) =>
script _inRange {
    input cond = yes;
    input rangeUpper = 60;
    input rangeLower = 5;
        def bars = if cond then 0 else bars[1] + 1;
        def inrange =  (rangeLower <= bars) and (bars <= rangeUpper);
plot retrun = inRange;
}
def ph_ = pivots(divSrc, LookBackLeft, LookBackRight, yes);
def pl_ = pivots(divSrc, LookBackLeft, LookBackRight, no);
def pl = !isNaN(pl_);
def ph = !isNaN(ph_);
def pll = lowest(divSrc,LookBackLeft +1);
def phh = highest(divSrc,LookBackLeft+1);
def sll = lowest(l, LookBackLeft +1);
def shh = highest(h, LookBackLeft+1);
#-- Pvt Low
def plStart  = if pl then yes else plStart[1];
def plFound  = if (plStart and pl) then 1 else 0;
def vlFound1 = if plFound then divSrc else vlFound1[1];
def vlFound_ = if vlFound1!=vlFound1[1] then vlFound1[1] else vlFound_[1];
def vlFound  = if !vlFound_ then pll else vlFound_;
def plPrice1 = if plFound then l else plPrice1[1];
def plPrice_ = if plPrice1!=plPrice1[1] then plPrice1[1] else plPrice_[1];
def plPrice  = if !plPrice_ then sll else plPrice_;
#-- Pvt High
def phStart = if ph then yes else phStart[1];
def phFound = if (phStart and ph) then 1 else 0;
def vhFound1 = if phFound then divSrc else vhFound1[1];
def vhFound_ = if vhFound1!=vhFound1[1] then vhFound1[1] else vhFound_[1];
def vhFound = if !vhFound_ then phh else vhFound_;
def phPrice1 = if phFound then h else phPrice1[1];
def phPrice_ = if phPrice1!=phPrice1[1] then phPrice1[1] else phPrice_[1];
def phPrice = if !phPrice_ then shh else phPrice_;
#// Regular Bullish
def inRangePl = _inRange(plFound[1],MaxLookback,MinLookback);
def oscHL = divSrc > vlFound and inRangePl;
def priceLL = l < plPrice and divSrc <= (if both then -10 else 40);
def bullCond = plFound and oscHL and priceLL;
#// Hidden Bullish
def oscLL = divSrc < vlFound and inRangePl;
def priceHL = l > plPrice and divSrc <= (if both then 0 else 50);
def hiddenBullCond = plFound and oscLL and priceHL;
#// Regular Bearish
def inRangePh = _inRange(phFound[1],MaxLookback,MinLookback);
def oscLH   = divSrc < vhFound and inRangePh;
def priceHH = h > phPrice and divSrc >= (if both then 10 else 60);
def bearCond = phFound and oscLH and priceHH;
#// Hidden Bearish
def oscHH = divSrc > vhFound and inRangePh;
def priceLH = h < phPrice and divSrc >= (if both then 0 else 50);
def hiddenBearCond = phFound and oscHH and priceLH;

#------ Bubbles
def bullBub  = DivBull and bullCond;
def HbullBub = DivHiddenBull and hiddenBullCond;
def bearBub  = DivBear and bearCond;
def HbearBub = DivHiddenBear and hiddenBearCond;

addchartbubble(bullBub, divSrc, "R", color.GREEN, no);
addchartbubble(bearBub, divSrc, "R", CreateColor(156,39,176), yes);
addchartbubble(HbullBub, divSrc, "H", color.DARK_green, no);
addchartbubble(HbearBub, divSrc, "H", color.DARK_red, yes);

##### Lines
#-- Bear Line
def lastPhBar = if ph then bar else lastPhBar[1];
def prePhBar = if lastPhBar!=lastPhBar[1] then lastPhBar[1] else prePhBar[1];
def priorPHBar = if bearCond then prePhBar else priorPHBar[1];
#-- Bull Line
def lastPlBar = if pl then bar else lastPlBar[1];
def prePlBar = if lastPlBar!=lastPlBar[1] then lastPlBar[1] else prePlBar[1];
def priorPLBar = if bullCond then prePlBar else priorPLBar[1];

def lastBullBar = if bullCond then bar else lastBullBar[1];
def lastBearBar = if bearCond then bar else lastBearBar[1];

def HighPivots = ph and bar >= HighestAll(priorPHBar) and bar <= HighestAll(lastBearBar);
def LowPivots  = pl and bar >= HighestAll(priorPLBar) and bar <= HighestAll(lastBullBar);

def pivotHigh = if HighPivots then divSrc else na;
def pivotLow  = if LowPivots  then divSrc else na;

plot PlotHline = if ShowLastDivLines then pivotHigh else na;
PlotHline.EnableApproximation();
PlotHline.SetDefaultColor(Color.MAGENTA);

plot PlotLline = if ShowLastDivLines then pivotLow else na;
PlotLline.EnableApproximation();
PlotLline.SetDefaultColor(Color.GREEN);

#--- Hidden Lines
#-- Bear Line
def priorHPHBar = if hiddenBearCond then prePhBar else priorHPHBar[1];
#-- Bull Line
def priorHPLBar = if hiddenBullCond then prePlBar else priorHPLBar[1];

def lastHBullBar = if hiddenBullCond then bar else lastHBullBar[1];
def lastHBearBar = if hiddenBearCond then bar else lastHBearBar[1];

def HighHPivots = ph and bar >= HighestAll(priorHPHBar) and bar <= HighestAll(lastHBearBar);
def LowHPivots  = pl and bar >= HighestAll(priorHPLBar) and bar <= HighestAll(lastHBullBar);

def pivotHidHigh = if HighHPivots then divSrc else na;
def pivotHidLow  = if LowHPivots  then divSrc else na;

plot PlotHBearline = if ShowLastHiddenDivLines then pivotHidHigh else na;
PlotHBearline.EnableApproximation();
PlotHBearline.SetDefaultColor(Color.DARK_RED);

plot PlotHBullline = if ShowLastHiddenDivLines then pivotHidLow else na;
PlotHBullline.EnableApproximation();
PlotHBullline.SetDefaultColor(Color.DARK_GREEN);


#-- END of CODE
Last edited by a moderator:
")