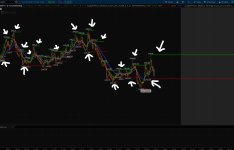
Below is the Study I wish to alert. I am trying to get it to Alert when a new Pivot (Support/Resistance) Line appears on the chart. Right now, the study alerts when the price is greater than a previously plotted Support/Resistance Line. In the image below, I have drawn white arrows pointing to where and when I would like the study to give a new alert signal.
I would like one new alert each time a new line is plotted on the chart. That's all. I do not wish for an alert for each new bar or tick.
Thank you for any and all thoughts.
# Mobius_Scalper_Pivots
# V01.2011
input n = 4;
input ShowLines = yes;
input SoundAlerts = yes;
input price = close;
input magnitude = 5;
def h = high;
def l = low;
def Firstbar = BarNumber();
def Highest = fold i = 1 to n + 1
with p = 1
while p
do h > GetValue(h, -i);
def A = if (Firstbar > n and
h == Highest(h, n) and
Highest)
then h
else Double.NaN;
def Lowest = fold j = 1 to n + 1
with q = 1
while q
do l < GetValue(l, -j);
def B = if (Firstbar > n and
l == Lowest(l, n) and Lowest)
then l
else Double.NaN;
def Al = if !IsNaN(A)
then A
else Al[1];
def Bl = if !IsNaN(B)
then B
else Bl[1];
plot PriceHigh = Round(A, 2);
PriceHigh.SetPaintingStrategy(PaintingStrategy.VALUES_ABOVE);
PriceHigh.SetDefaultColor(Color.WHITE);
plot HighLine = if Al > 0
then Al
else Double.NaN;
HighLine.SetHiding(!ShowLines);
HighLine.SetPaintingStrategy(PaintingStrategy.HORIZONTAL);
HighLine.SetDefaultColor(Color.GREEN);
plot PriceLow = Round(B, 2);
PriceLow.SetPaintingStrategy(PaintingStrategy.VALUES_BELOW);
PriceLow.SetDefaultColor(Color.WHITE);
plot LowLine = if Bl > 0
then Bl
else Double.NaN;
LowLine.SetHiding(!ShowLines);
LowLine.SetPaintingStrategy(PaintingStrategy.HORIZONTAL);
LowLine.SetDefaultColor(Color.RED);
#Alerts
Alert(SoundAlerts and h > Al , "Up", Alert.BAR, Sound.Bell);
Alert(SoundAlerts and l < Bl, "Down", Alert.BAR, Sound.Ding);
14910[/ATTACH]']
Here is list of what I have tried, and what has failed.
# Alerts
Alert(SoundAlerts and h > Al , "Up", Alert.BAR, Sound.Bell);
Alert(SoundAlerts and l < Bl, "Down", Alert.BAR, Sound.Ding);
Alert(SoundAlerts and PriceHigh, "Up", Alert.BAR, Sound.Bell);
Alert(SoundAlerts and PriceLow, "Down", Alert.BAR, Sound.Ding);
Alert(SoundAlerts and HighLine , "Up", Alert.BAR, Sound.Bell);
Alert(SoundAlerts and LowLine, "Down", Alert.BAR, Sound.Ding);
Alert(SoundAlerts and Al , "Up", Alert.BAR, Sound.Bell);
Alert(SoundAlerts and Bl, "Down", Alert.BAR, Sound.Ding);
Alert(SoundAlerts and A, "Up", Alert.BAR, Sound.Bell);
Alert(SoundAlerts and B, "Down", Alert.BAR, Sound.Ding);
Alert(SoundAlerts and Highest , "Up", Alert.BAR, Sound.Bell);
Alert(SoundAlerts and Lowest, "Down", Alert.BAR, Sound.Ding);
Alert(SoundAlerts and h > Al , "Up", Alert.BAR, Sound.Bell);
Alert(SoundAlerts and l < Bl, "Down", Alert.BAR, Sound.Ding);