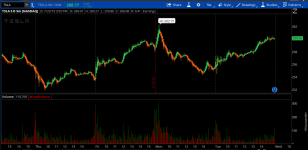
Here is mixed volume that shows the buying/selling in each individual volume bar. Be careful adding any more volume indicators on top of this one, like VolumeAvg. Everything else tends to cancel it out. Best used alone in the "volume" section of the studies.
I typically use this to refine my decisions whether to go long or short. It also helps to determine whether to stay in a trade or get out if you see red volume increasing in a long position or green volume while holding a short position. Please note: a candlestick can be green but the bar can be mostly red, and vice versa. It's a true, leading indicator of which side is taking control.

https://tos.mx/H582pK
I typically use this to refine my decisions whether to go long or short. It also helps to determine whether to stay in a trade or get out if you see red volume increasing in a long position or green volume while holding a short position. Please note: a candlestick can be green but the bar can be mostly red, and vice versa. It's a true, leading indicator of which side is taking control.
https://tos.mx/H582pK