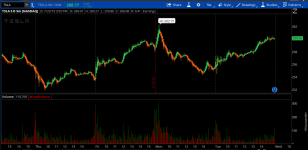
Mixed Volume Indicator for ThinkorSwim

Shinthus

Active member
2019 Donor
Here is mixed volume that shows the buying/selling in each individual volume bar. Be careful adding any more volume indicators on top of this one, like VolumeAvg. Everything else tends to cancel it out. Best used alone in the "volume" section of the studies.

I typically use this to refine my decisions whether to go long or short. It also helps to determine whether to stay in a trade or get out if you see red volume increasing in a long position or green volume while holding a short position. Please note: a candlestick can be green but the bar can be mostly red, and vice versa. It's a true, leading indicator of which side is taking control.

QBSuS7e.png


https://tos.mx/H582pK
 

Attachments

  • QBSuS7e.png
    QBSuS7e.png
    194.7 KB · Views: 434
I was thinking maybe if the indicator could possibly plot the volume average as a line across the indicator, that would be great!
 
I was thinking maybe if the indicator could possibly plot the volume average as a line across the indicator, that would be great!
that is a built in indicator. get acquainted with the manual, there are over 400 baked in indicators.
Code:
#
# TD Ameritrade IP Company, Inc. (c) 2007-2019
#

declare lower;
declare zerobase;

input length = 50;

plot Vol = volume;
plot VolAvg = Average(volume, length);

Vol.SetPaintingStrategy(PaintingStrategy.HISTOGRAM);
Vol.SetLineWeight(3);
Vol.DefineColor("Up", Color.UPTICK);
Vol.DefineColor("Down", Color.DOWNTICK);
Vol.AssignValueColor(if close > close[1] then Vol.color("Up") else if close < close[1] then Vol.color("Down") else GetColor(1));
VolAvg.SetDefaultColor(GetColor(8));
#end
 
Hello Everyone,

I have the colored volume bars (green & red) in the upper area from the study/script (in place of the "built-in" blue bars) with my price candles, is there any way to move them "behind" the price candles?

When I have volume spikes for a particular candle, the green/red volume bars will cover the price candle.... 🤔

If I was in PowerPoint, I would use the "Send to back" function... 😁
 
Agreed. I can't code, though. Someone would have to do that for us.
I cant code yet either but I added the Average line to the Mixed Volume from the Code markos posted. I think it plots correctly.

Code:
declare on_volume;

def O = open;
def H = high;
def C = close;
def L = low;
def V = volume;
def Buying = V*(C-L)/(H-L);
def Selling = V*(H-C)/(H-L);

# Selling Volume
Plot SV = selling;
SV.setPaintingStrategy(PaintingStrategy.Histogram);
SV.SetDefaultColor(Color.Red);
SV.HideTitle();
SV.HideBubble();
SV.SetLineWeight(5);

# Buying Volume
# Plot BV = Buying;
# Note that Selling + Buying Volume = Volume.
input length = 50;
Plot BV = volume;
plot VolAvg = Average(volume, length);
BV.setPaintingStrategy(PaintingStrategy.Histogram);
BV.SetDefaultColor(Color.Dark_Green);
BV.HideTitle();
BV.HideBubble();
BV.SetLineWeight(5);
VolAvg.SetDefaultColor(GetColor(8));
 
Thank you for posting this... 👍

Unfortunately, in this particular case, I can't get the colored volume bars behind the price candles... and I've moved the study to every position in the "Price" and "Volume" sections... when I "Edit" the studies.... 🤔

No, I don't think that is possible on a chart... You can change Study layer priority but the Candles are layer zero with all other layers on top...
 
Here is mixed volume that shows the buying/selling in each individual volume bar. Be careful adding any more volume indicators on top of this one, like VolumeAvg. Everything else tends to cancel it out. Best used alone in the "volume" section of the studies.

I typically use this to refine my decisions whether to go long or short. It also helps to determine whether to stay in a trade or get out if you see red volume increasing in a long position or green volume while holding a short position. Please note: a candlestick can be green but the bar can be mostly red, and vice versa. It's a true, leading indicator of which side is taking control.

QBSuS7e.png


https://tos.mx/H582pK
Hi - I placed this 'alone' in the volume section per your instruction above - and the indicator did not appear on the chart - Please see screenshot -

xeEwFRE.png


So I then moved it into 'Lower' section and then the indicator appeared - Please see screenshot

b7Y5yd7.png


eoPUJdx.png


Looks to be very useful indicator - thank you!
 
Is there a way to show (display) the actual percentage of buying and selling pressure for each bar? Also is it possible to add an alert if the volume crosses the Average Line?
 
Last edited:
Anyone seem to be having trouble with the volume bars updating properly? I've been using it for a couple weeks now and I'll notice sometimes entire bars will be red or green and it wouldn't really make sense for the chart, and when I reload the chart the proper bars appear.

For example:
Fk5L3ih.png
 
Last edited:
Anyone seem to be having trouble with the volume bars updating properly? I've been using it for a couple weeks now and I'll notice sometimes entire bars will be red or green and it wouldn't really make sense for the chart, and when I reload the chart the proper bars appear.
This happened to me once a few weeks ago but it has not happened since.
 

Join useThinkScript to post your question to a community of 21,000+ developers and traders.

Not the exact question you're looking for?

Start a new thread and receive assistance from our community.

87k+ Posts
348 Online
Create Post

The Market Trading Game Changer

Join 2,500+ subscribers inside the useThinkScript VIP Membership Club
  • Exclusive indicators
  • Proven strategies & setups
  • Private Discord community
  • ‘Buy The Dip’ signal alerts
  • Exclusive members-only content
  • Add-ons and resources
  • 1 full year of unlimited support

Frequently Asked Questions

What is useThinkScript?

useThinkScript is the #1 community of stock market investors using indicators and other tools to power their trading strategies. Traders of all skill levels use our forums to learn about scripting and indicators, help each other, and discover new ways to gain an edge in the markets.

How do I get started?

We get it. Our forum can be intimidating, if not overwhelming. With thousands of topics, tens of thousands of posts, our community has created an incredibly deep knowledge base for stock traders. No one can ever exhaust every resource provided on our site.

If you are new, or just looking for guidance, here are some helpful links to get you started.

What are the benefits of VIP Membership?
VIP members get exclusive access to these proven and tested premium indicators: Buy the Dip, Advanced Market Moves 2.0, Take Profit, and Volatility Trading Range. In addition, VIP members get access to over 50 VIP-only custom indicators, add-ons, and strategies, private VIP-only forums, private Discord channel to discuss trades and strategies in real-time, customer support, trade alerts, and much more. Learn all about VIP membership here.
How can I access the premium indicators?
To access the premium indicators, which are plug and play ready, sign up for VIP membership here.
Back
Top