
No, do not know coding.I like this indicator. Do you still find it useful? Is there a name to it? if you can explain how this is made, it would be very helpful.
You are using an out of date browser. It may not display this or other websites correctly.
You should upgrade or use an alternative browser.
You should upgrade or use an alternative browser.
John Carter's Squeeze Pro Indicator for ThinkorSwim (FREE)

BenTen's Watchlist + Setup + Trade Recaps
Get access to Ben's watchlist, swing trading strategy, ThinkorSwim setup, and trade examples.
https://usethinkscript.com/threads/z-score-indicator-for-thinkorswim.16970/I like this indicator. Do you still find it useful? Is there a name to it? if you can explain how this is made, it would be very helpful.
Last edited:
JP782
Active member
If you wanted to know when the histo went from GREEN to DARK ORANGE, skipping the DARK GREEN, how would you do that?John Carter's Squeeze Pro Indicator for ThinkorSwim (FREE)
I derived John Carter's Pro Squeeze indicator. All it looks like he does is add in more conditional rules on whether BBs are inside a larger and smaller range. The code is actually pretty simple just added a few Keltner ranges and added in Mobius's derivation of the original TTM Squeeze's momentum function.
Dark_orange is the pre-squeeze, yellow signals the original, and red is one step above actual i.e., extreme compression.

Thanks,
TheBewb
Code:declare lower; ##Assembled by TheBewb using existing Mobius Squeeze Momentum coding and "squeeze" concept made popular by John Carter. input price = close; input length = 20; input Num_Dev_Dn = -2.0; input Num_Dev_up = 2.0; input averageType = AverageType.SIMPLE; input displace = 0; def sDev = StDev(data = price[-displace], length = length); def MidLineBB = MovingAverage(averageType, data = price[-displace], length = length); def LowerBandBB = MidLineBB + Num_Dev_Dn * sDev; def UpperBandBB = MidLineBB + Num_Dev_up * sDev; input factorhigh = 1.0; input factormid = 1.5; input factorlow = 2.0; input trueRangeAverageType = AverageType.SIMPLE; def shifthigh = factorhigh * MovingAverage(trueRangeAverageType, TrueRange(high, close, low), length); def shiftMid = factormid * MovingAverage(trueRangeAverageType, TrueRange(high, close, low), length); def shiftlow = factorlow * MovingAverage(trueRangeAverageType, TrueRange(high, close, low), length); def average = MovingAverage(averageType, price, length); def Avg = average[-displace]; def UpperBandKCLow = average[-displace] + shiftlow[-displace]; def LowerBandKCLow = average[-displace] - shiftlow[-displace]; def UpperBandKCMid = average[-displace] + shiftMid[-displace]; def LowerBandKCMid = average[-displace] - shiftMid[-displace]; def UpperBandKCHigh = average[-displace] + shifthigh[-displace]; def LowerBandKCHigh = average[-displace] - shifthigh[-displace]; def K = (Highest(high, length) + Lowest(low, length)) / 2 + ExpAverage(close, length); def momo = Inertia(price - K / 2, length); def pos = momo>= 0; def neg = momo< 0; def up = momo >= momo[1]; def dn = momo < momo[1]; def presqueeze = LowerBandBB > LowerBandKCLow and UpperBandBB < UpperBandKCLow; def originalSqueeze = LowerBandBB > LowerBandKCMid and UpperBandBB < UpperBandKCMid; def ExtrSqueeze = LowerBandBB > LowerBandKCHigh and UpperBandBB < UpperBandKCHigh; def PosUp = pos and up; def PosDn = pos and dn; def NegDn = neg and dn; def NegUp = neg and up; plot squeezeline = 0; squeezeline.SetPaintingStrategy(PaintingStrategy.POINTS); squeezeline.AssignValueColor(if ExtrSqueeze then Color.RED else if originalSqueeze then Color.YELLOW else if presqueeze then Color.DARK_ORANGE else Color.GRAY); plot momentum = momo; momentum.SetPaintingStrategy(PaintingStrategy.HISTOGRAM); momentum.AssignValueColor( if PosUp then Color.green else if PosDn then Color.dark_green else if NegDn then Color.dark_orange else if NegUp then Color.yellow else Color.YELLOW);
Last edited by a moderator:
If you wanted to know when the histo went from GREEN to DARK ORANGE, skipping the DARK GREEN, how would you do that?
look for a minimal quantity of dark green bars.
this has an input to enter how many.
default is 1, between green and orange.
it draws a light blue vertical line when the condition is true
the added code is near the end, between rows of dashes
Code:
# SqueezePro_carter_mod_skipcolor_0

# If you wanted to know when the histo went from GREEN to DARK ORANGE, skipping the DARK GREEN, how would you do that?

#https://usethinkscript.com/threads/squeeze-pro-question.13039/

declare lower;

##Assembled by TheBewb using existing Mobius Squeeze Momentum coding and "squeeze" concept made popular by John Carter.
input price = close;
input length = 20;
input Num_Dev_Dn = -2.0;
input Num_Dev_up = 2.0;
input averageType = AverageType.SIMPLE;
input displace = 0;
def sDev = StDev(data = price[-displace], length = length);
def MidLineBB = MovingAverage(averageType, data = price[-displace], length = length);
def LowerBandBB = MidLineBB + Num_Dev_Dn * sDev;
def UpperBandBB = MidLineBB + Num_Dev_up * sDev;
input factorhigh = 1.0;
input factormid = 1.5;
input factorlow = 2.0;
input trueRangeAverageType = AverageType.SIMPLE;
def shifthigh = factorhigh * MovingAverage(trueRangeAverageType, TrueRange(high, close, low), length);
def shiftMid = factormid * MovingAverage(trueRangeAverageType, TrueRange(high, close, low), length);
def shiftlow = factorlow * MovingAverage(trueRangeAverageType, TrueRange(high, close, low), length);
def average = MovingAverage(averageType, price, length);

def Avg = average[-displace];

def UpperBandKCLow = average[-displace] + shiftlow[-displace];
def LowerBandKCLow = average[-displace] - shiftlow[-displace];

def UpperBandKCMid = average[-displace] + shiftMid[-displace];
def LowerBandKCMid = average[-displace] - shiftMid[-displace];

def UpperBandKCHigh = average[-displace] + shifthigh[-displace];
def LowerBandKCHigh = average[-displace] - shifthigh[-displace];

def K = (Highest(high, length) + Lowest(low, length)) /
2 + ExpAverage(close, length);
def momo = Inertia(price - K / 2, length);

def pos         = momo>= 0;
def neg         = momo< 0;
def up         = momo >= momo[1];
def dn         = momo < momo[1];

def presqueeze      = LowerBandBB > LowerBandKCLow and UpperBandBB < UpperBandKCLow;
def originalSqueeze     = LowerBandBB > LowerBandKCMid and UpperBandBB < UpperBandKCMid;
def ExtrSqueeze     = LowerBandBB > LowerBandKCHigh and UpperBandBB < UpperBandKCHigh;

def PosUp = pos and up;
def PosDn = pos and dn;
def NegDn = neg and dn;
def NegUp = neg and up;

#---------------------------------

# look for minimal dark green bars , PosDn
# look for first orange, NegDn,  then look back to check if green, posup,  was within x bars
input max_dark_green_bars = 1;
def ismin_darkgreen = if (negdn and sum(posup, max_dark_green_bars+1) > 0 ) then 1 else 0;

addverticalline( ismin_darkgreen, "-", color.cyan);

#--------------------------------


plot squeezeline = 0;
squeezeline.SetPaintingStrategy(PaintingStrategy.POINTS);
squeezeline.AssignValueColor(if ExtrSqueeze then Color.RED else if originalSqueeze  then Color.YELLOW else if presqueeze then Color.DARK_ORANGE else Color.GRAY);

plot momentum = momo;
momentum.SetPaintingStrategy(PaintingStrategy.HISTOGRAM);
momentum.AssignValueColor( if PosUp then Color.green else if PosDn then Color.dark_green else if NegDn then Color.dark_orange else if NegUp then Color.yellow else Color.YELLOW);
#rufflechip
New member
Hi:
Thanks for the great indicator TheBewb!
I went to Carter's website & watched his video on the Pro Squeeze, & I only see 3 colors for the Squeeze Line Points
Please explain how the 4 Squeeze points in your study work. Would appreciate if you could explain how to set it up for the 3 color coding as shown in the below link.
https://www.simplertrading.com/squeeze-pro-indicator
Thanks again
Thanks for the great indicator TheBewb!
I went to Carter's website & watched his video on the Pro Squeeze, & I only see 3 colors for the Squeeze Line Points
- Green = no squeeze
- Red = original squeeze
- Black = improved squeeze
Please explain how the 4 Squeeze points in your study work. Would appreciate if you could explain how to set it up for the 3 color coding as shown in the below link.
https://www.simplertrading.com/squeeze-pro-indicator
Thanks again
Hi:
Thanks for the great indicator TheBewb!
I went to Carter's website & watched his video on the Pro Squeeze, & I only see 3 colors for the Squeeze Line Points
- Green = no squeeze
- Red = original squeeze
- Black = improved squeeze
Please explain how the 4 Squeeze points in your study work. Would appreciate if you could explain how to set it up for the 3 color coding as shown in the below link.
https://www.simplertrading.com/squeeze-pro-indicator
Thanks again
- The OP of this thread is no longer a member and cannot answer your questions.
- The simpler trading indicator is proprietary so it isn't possible to say exactly how it is calculated.
- There are many many flavors of squeeze indicators in this thread. Read through and see if one of the other variations suits your needs.
- There are over 50 other squeeze studies on this forum. Here they are sorted by popularity: https://usethinkscript.com/search/9...3&c[nodes][1]=5&c[title_only]=1&o=replies&g=1
The best way to learn to read charts and indicators is to apply them. Recommend you put it on your chart. Nothing beats personal experience
") The only way you will know what the plots are doing, is to observe them on your charts and how they inter-relate with your other indicators.
The only way you will know what the plots are doing, is to observe them on your charts and how they inter-relate with your other indicators.Most indicators need tweaking depending on the timeframe, the market, the ticker.
No one can possibly know what tweaks will work best for you. It is up to you to play with the settings and see how the indicator line up w/ your strategy and with your other indicators.
To determine if an indicator brings value, analyze it over different timeframes, across history and with multiple instruments.
# # # # #
Hi, all,
I use the code in thread "John Carter's Squeeze Pro Indicator for ThinkorSwim (FREE)" posted by Thebewb. Because I only show the "squeezeline" , I am trying to combine and locate this squeeze line indicator at the bottom of the chart area and get rid of the sub-charts to save space for the main chart.
Is it possible to do this?
Thanks,
qxie
Hi, all,
I use the code in thread "John Carter's Squeeze Pro Indicator for ThinkorSwim (FREE)" posted by Thebewb. Because I only show the "squeezeline" , I am trying to combine and locate this squeeze line indicator at the bottom of the chart area and get rid of the sub-charts to save space for the main chart.
Is it possible to do this?
Thanks,
qxie
John Carter's Squeeze Pro Indicator for ThinkorSwim (FREE)" posted by Thebewb.
https://usethinkscript.com/threads/john-carters-squeeze-pro-indicator-for-thinkorswim-free.4021/
the original plots the line ( the points ), at 0.
so you have to come up with a different price level to plot them.
Code:
# start with the original study

#assuming you want the squeeze line just below the main chart,

#find the lowest price on main chart,
#assign that value to every bar of a variable, as a reference point.
def lolo = lowestall(low);

# calc a lower price for the line, maybe 99% of that reference value?
input per = 99.5;
def sqzline = lolo * (per /100);

#change this from 0
#plot squeezeline = 0;

#to be
plot squeezeline = sqzline;

# then use the original points codes
 squeezeline.SetPaintingStrategy(PaintingStrategy.POINTS); squeezeline.AssignValueColor(if ExtrSqueeze then Color.RED else if originalSqueeze then Color.YELLOW else if presqueeze then Color.DARK_ORANGE else Color.GRAY);

# and disable the histogram
#Hi, @halcyonguy,
Thank you very much for your reply. I tried using "lowestall(low)" function to get the lowest price of the chart. The problem is that I use Manual and Custom Interval to scale the price axis, sometimes the lowest all of the price is below and out of the chart. In this case the squeezeline will be below and out of the chart area too, and can't be showed up:

I want to the squeezeline always sit at the bottom line of the chart, as following two pictures:


NOTE: For the above two pictures, I manually change the thinkscript code to make the squeezeline sit at the price $81.5 and $94.1. It is not automatically at the bottom.
Thanks,
qxie
Thank you very much for your reply. I tried using "lowestall(low)" function to get the lowest price of the chart. The problem is that I use Manual and Custom Interval to scale the price axis, sometimes the lowest all of the price is below and out of the chart. In this case the squeezeline will be below and out of the chart area too, and can't be showed up:
I want to the squeezeline always sit at the bottom line of the chart, as following two pictures:
NOTE: For the above two pictures, I manually change the thinkscript code to make the squeezeline sit at the price $81.5 and $94.1. It is not automatically at the bottom.
Thanks,
qxie
Last edited by a moderator:
JP782
Active member
Of the many diff charts I run I made this avg of squeeze momentum using 6 timeframes (why? I got the idea from a study that uses 6) Im having problem with when the arrow paints the color changes for the momentum,it will paint 2 arrows (red and yellow) at once, and sometimes it does it for blue and cyan? Suggestions?
[ Yes, multiple counter signals go off close to ea other. This is stripped down from additional script it’s not final product, just trying to figure this first problem out ]
#based off of code via TheBewb using existing Mobius Squeeze Momentum
input Xmomentum = yes;
input XavgSignals = no;
input length = 20;
input agg = AggregationPeriod.MIN;
input agg2 = AggregationPeriod.TWO_MIN;
input agg3 = AggregationPeriod.THREE_MIN;
input agg4 = AggregationPeriod.FOUR_MIN;
input agg5 = AggregationPeriod.FIVE_MIN;
input agg6 = AggregationPeriod.TEN_MIN;
def price = close(period = agg);
plot Zero_Line = 0;
Zero_Line.HIDE();
def K = (Highest(high, length) + Lowest(low, length)) / 2 + ExpAverage(close, length);
def momo1 = Inertia(price - K / 2, length);
#################################################################################
def price2 = close(period = agg2);
def K2 = (Highest(high, length) + Lowest(low, length)) / 2 + ExpAverage(close, length);
def momo2 = Inertia(price2 - K2 / 2, length);
#################################################################################
def price3 = close(period = agg3);
def K3 = (Highest(high, length) + Lowest(low, length)) / 2 + ExpAverage(close, length);
def momo3 = Inertia(price3 - K3 / 2, length);
#################################################################################
def price4 = close(period = agg4);
def K4 = (Highest(high, length) + Lowest(low, length)) / 2 + ExpAverage(close, length);
def momo4 = Inertia(price4 - K4 / 2, length);
#################################################################################
def price5 = close(period = agg5);
def K5 = (Highest(high, length) + Lowest(low, length)) / 2 + ExpAverage(close, length);
def momo5 = Inertia(price5 - K5 / 2, length);
#################################################################################
def price6 = close(period = agg6);
def K6 = (Highest(high, length) + Lowest(low, length)) / 2 + ExpAverage(close, length);
def momo6 = Inertia(price6 - K6 / 2, length);
def momo = (momo1 + momo2 + momo3 + momo4 + momo5 + momo6) /6;
def pos = momo >= 0;
def neg = momo < 0;
def up = momo >= momo[1];
def dn = momo < momo[1];
def PosUp = pos and up;
def PosDn = pos and dn;
def NegDn = neg and dn;
def NegUp = neg and up;
plot momentum = momo;
momentum.DefineColor("PosUp", Color.CYAN);
momentum.DefineColor("PosDn", Color.BLUE);
momentum.DefineColor("NegDn", Color.RED);
momentum.DefineColor("NegUp", Color.YELLOW);
#momentum.SetPaintingStrategy(PaintingStrategy.HISTOGRAM);
momentum.SETStyle(CURVE.FIRM);
momentum.SetLineWeight(1);
momentum.AssignValueColor(if PosUp then momentum.Color("PosUp") else if PosDn then momentum.Color("PosDn") else if NegDn then momentum.Color("NegDn") else if NegUp then momentum.Color("NegUp") else momentum.Color("NegUp"));
momentum.hide();
def XPosUp = pos and up;#cyan
plot PosUpX = if XPosUp and !XPosUp[1] THEN (low - 5 * tickSize()) else double.NaN;
PosupX.SetPaintingStrategy(PaintingStrategy.ARROW_UP);
PosupX.setdefaultColor(COLOR.CYAN);
PosupX.setlineWeight(5);
PosUpX.sethiding(XavgSignals);
def XPosDn = pos and dn;#blue
plot PosDnX = if XPosDn and ! XPosDn[1] THEN (high + 5 * tickSize()) else double.NaN;
PosDnX.SetPaintingStrategy(PaintingStrategy.ARROW_DOWN);
PosDnX.setdefaultColor(COLOR.BLUE);
PosDnX.setlineWeight(5);
PosDnX.sethiding(XavgSignals);
def XNegDn = neg and dn;#red
plot NegDnX = if XNegDn and ! XNegDn[1] THEN (high + 5 * tickSize()) else double.NaN;
NegDnX.SetPaintingStrategy(PaintingStrategy.ARROW_DOWN);
NegDnX.setdefaultColor(COLOR.RED);
NegDnX.setlineWeight(5);
NegDnX.sethiding(XavgSignals);
def XNegUp = neg and up;#yellow
plot NegUpX = if XNegDn and ! XNegDn[1] THEN (low - 5 * tickSize()) else double.NaN;
NegUpX.SetPaintingStrategy(PaintingStrategy.ARROW_UP);
NegUpX.setdefaultColor(COLOR.YELLOW);
NegUpX.setlineWeight(5);
NegUpX.sethiding(XavgSignals);
any chance you can share your Label code for the count?My question pertains to the script above for the watchlist by Sneaky_Swings, is there a way to include a count number for how many bars a stock has been in a pre-, orig- or extra squeeze?
I already have one that has a count, I believe I got from Hahn-tech... am looking for something that does the same but for the Pro
I looked on Hahn-tech site but could not find it, hence why I asked here
Last edited by a moderator:
Here is the direct link:any chance you can share your Label code for the count?
I looked on Hahn-tech site but could not find it, hence why I asked here
https://www.hahn-tech.com/thinkorswim-watchlist-ttm-squeeze/
Absolutely fantastic !! Cheers !!@Sneaky_Swings I re-coded the pre-squeeze to tell me if it is squeezing in or out. Made it a little easier to see if we are about to get a breakout or not. I made it more like a red, yellow, green light situation. Then you know if you have the green light to trade, red light not to trade at all, and yellow you might want to add extra criteria for your buying criteria to be met before pulling the trigger.
Zeroline Color Definitions:
Dark Red = Extra Squeeze (In & Out)
Red = Original Squeeze (In & Out)
Pink = Pre-Squeeze (In)
Yellow = Pre-Squeeze (Out)
Green = BB's are officially outside of Keltner Channels
Code:##Assembled by TheBewb using existing Mobius Squeeze Momentum coding and "squeeze" concept made popular by John Carter. declare lower; input price = close; input length = 20; input Num_Dev_Dn = -2.0; input Num_Dev_up = 2.0; input averageType = AverageType.SIMPLE; input displace = 0; def sDev = StDev(data = price[-displace], length = length); def MidLineBB = MovingAverage(averageType, data = price[-displace], length = length); def LowerBandBB = MidLineBB + Num_Dev_Dn * sDev; def UpperBandBB = MidLineBB + Num_Dev_up * sDev; input factorhigh = 1.0; input factormid = 1.5; input factorlow = 2.0; input trueRangeAverageType = AverageType.SIMPLE; def shifthigh = factorhigh * MovingAverage(trueRangeAverageType, TrueRange(high, close, low), length); def shiftMid = factormid * MovingAverage(trueRangeAverageType, TrueRange(high, close, low), length); def shiftlow = factorlow * MovingAverage(trueRangeAverageType, TrueRange(high, close, low), length); def average = MovingAverage(averageType, price, length); def Avg = average[-displace]; def UpperBandKCLow = average[-displace] + shiftlow[-displace]; def LowerBandKCLow = average[-displace] - shiftlow[-displace]; def UpperBandKCMid = average[-displace] + shiftMid[-displace]; def LowerBandKCMid = average[-displace] - shiftMid[-displace]; def UpperBandKCHigh = average[-displace] + shifthigh[-displace]; def LowerBandKCHigh = average[-displace] - shifthigh[-displace]; def K = (Highest(high, length) + Lowest(low, length)) / 2 + ExpAverage(close, length); def momo = Inertia(price - K / 2, length); def pos = momo >= 0; def neg = momo < 0; def up = momo >= momo[1]; def dn = momo < momo[1]; def presqueeze = LowerBandBB > LowerBandKCLow and UpperBandBB < UpperBandKCLow; def presqueezein = LowerBandBB > LowerBandKCLow and UpperBandBB < UpperBandKCLow and lowerBandBB > lowerBandBB[1]; def presqueezeout = LowerBandBB > LowerBandKCLow and UpperBandBB < UpperBandKCLow and lowerbandbb < lowerbandbb[1]; def originalSqueeze = LowerBandBB > LowerBandKCMid and UpperBandBB < UpperBandKCMid; def originalSqueezein = LowerBandBB > LowerBandKCMid and UpperBandBB < UpperBandKCMid and lowerbandBB > lowerbandbb[1]; def originalSqueezeout = LowerBandBB > LowerBandKCMid and UpperBandBB < UpperBandKCMid and lowerbandbb < lowerbandbb[1]; def ExtrSqueeze = LowerBandBB > LowerBandKCHigh and UpperBandBB < UpperBandKCHigh; def ExtrSqueezein = LowerBandBB > LowerBandKCHigh and UpperBandBB < UpperBandKCHigh and lowerbandbb > lowerbandbb[1]; def ExtrSqueezeout = LowerBandBB > LowerBandKCHigh and UpperBandBB < UpperBandKCHigh and lowerbandbb < lowerbandbb[1]; def PosUp = pos and up; def PosDn = pos and dn; def NegDn = neg and dn; def NegUp = neg and up; plot squeezeline = 0; squeezeline.SetPaintingStrategy(PaintingStrategy.LINE_VS_SQUARES); squeezeline.setLineWeight(5); squeezeline.AssignValueColor(if ExtrSqueezein then Color.dark_red else if extrsqueezeout then color.dark_red else if originalSqueezein then Color.red else if originalSqueezeout then color.red else if presqueezein then Color.pink else if presqueezeout then color.yellow else Color.green); plot momentum = momo; momentum.SetPaintingStrategy(PaintingStrategy.HISTOGRAM); momentum.AssignValueColor( if PosUp then Color.cyan else if PosDn then Color.blue else if NegDn then Color.red else if NegUp then Color.yellow else Color.gray);
MrsPleasant
New member
Sorry to take so long to reply, but apparently (according toCode:def presqueeze = LowerBandBB > LowerBandKCLow and UpperBandBB < UpperBandKCLow; def originalSqueeze = LowerBandBB > LowerBandKCMid and UpperBandBB < UpperBandKCMid; def ExtrSqueeze = LowerBandBB > LowerBandKCHigh and UpperBandBB < UpperBandKCHigh;
def presqueeze = AbsValue( UpperBandBB - LowerBandBB ) <= AbsValue( UpperBandKCLow - LowerBandKCLow );
def originalSqueeze = AbsValue( UpperBandBB - LowerBandBB ) <= AbsValue( UpperBandKCMid - LowerBandKCMid );
def ExtrSqueeze = AbsValue( UpperBandBB - LowerBandBB ) <= AbsValue( UpperBandKCHigh - LowerBandKCHigh );
Thoughts? This video claims that's how the TTM squeeze is written. But that code must be proprietary.
givemefood
New member
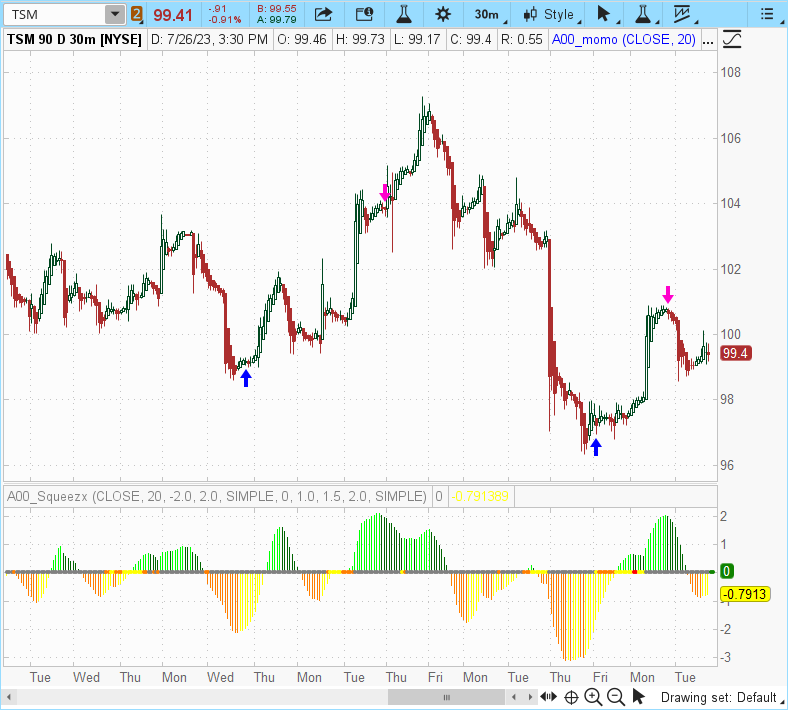
How can I get this indicator to add BUY and SELL arrows over or under the candles when the histogram or momentum exceeds a certain number, say +2.5 or -2.5?
How can I get this indicator to add BUY and SELL arrows over or under the candles when the histogram or momentum exceeds a certain number, say +2.5 or -2.5?
Ruby:
# Momo arrows
input price = close;
input length = 20;
def K = (Highest(high, length) + Lowest(low, length)) / 2 + ExpAverage(close, length);
def momo = Inertia(price - K / 2, length);

plot BuyArrow = momo crosses above -2.5 ;
BuyArrow.SetPaintingStrategy(PaintingStrategy.BOOLEAN_ARROW_UP);

plot SellArrow = momo crosses below 2.5 ;
SellArrow.SetPaintingStrategy(PaintingStrategy.BOOLEAN_ARROW_DOWN);Zain
New member
would it be possible to get an in-depth explanation of ways to use it? much appreciatedTTM waves using a 2 pole butterworth Filter Lines 1 thru 7 , line 9 is the squeeze, Line 10 is the oscillator wave colors
Code:Declare Lower; input period1 = 8; Input period2 = 21; input period3 = 34; input period4 = 55; input period5 = 89; input period6 = 144; input period7 = 233; input period8 = 377; Input Dotsize = 3; input APC = 0; Def price = (Open + Close)/2; def a1A = exp(-1.414 * 3.14159 / Period1); def b1A = 2 * a1A * Cos(1.414 * 3.14159 / Period1); def coef2A = b1A; def coef3A = -a1A * a1A; def coef1A = (1 – b1A + a1A * a1A) / 4; rec ButterA = if barNumber() < 3 then Price else coef1A * (Price + 2 * Price[1] + Price[2]) + coef2A * ButterA[1] + coef3A * ButterA[2]; def a1B = exp(-1.414 * 3.14159 / Period2); def b1B = 2 * a1B * Cos(1.414 * 3.14159 / Period2); def coef2B = b1B; def coef3B = -a1B * a1B; def coef1B = (1 – b1B + a1B * a1B) / 4; rec ButterB = if barNumber() < 3 then Price else coef1B * (Price + 2 * Price[1] + Price[2]) + coef2B * ButterB[1] + coef3B * ButterB[2]; def a1C = exp(-1.414 * 3.14159 / Period3); def b1C = 2 * a1C * Cos(1.414 * 3.14159 / Period3); def coef2C = b1C; def coef3C = -a1C * a1C; def coef1C = (1 – b1C + a1C * a1C) / 4; rec ButterC = if barNumber() < 3 then Price else coef1C * (Price + 2 * Price[1] + Price[2]) + coef2C * ButterC[1] + coef3C * ButterC[2]; def a1D = exp(-1.414 * 3.14159 / Period4); def b1D = 2 * a1D * Cos(1.414 * 3.14159 / Period4); def coef2D = b1D; def coef3D = -a1D * a1D; def coef1D = (1 – b1D + a1D * a1D) / 4; rec ButterD= if barNumber() < 3 then Price else coef1D * (Price + 2 * Price[1] + Price[2]) + coef2D * ButterD[1] + coef3D * ButterD[2]; def a1E = exp(-1.414 * 3.14159 / Period5); def b1E = 2 * a1E * Cos(1.414 * 3.14159 / Period5); def coef2E =b1E; def coef3E = -a1E * a1E; def coef1E = (1 – b1E + a1E * a1E) / 4; rec ButterE = if barNumber() < 3 then Price else coef1E * (Price + 2 * Price[1] + Price[2]) + coef2E * ButterE[1] + coef3E * ButterE[2]; def a1F = exp(-1.414 * 3.14159 / Period6); def b1F = 2 * a1F * Cos(1.414 * 3.14159 / Period6); def coef2F = b1F; def coef3F = -a1F * a1F; def coef1F = (1 – b1F + a1F * a1F) / 4; rec ButterF = if barNumber() < 3 then Price else coef1F * (Price + 2 * Price[1] + Price[2]) + coef2F * ButterF[1] + coef3F * ButterF[2]; def a1G = exp(-1.414 * 3.14159 / Period7); def b1G = 2 * a1G * Cos(1.414 * 3.14159 / Period7); def coef2G = b1G; def coef3G = -a1G * a1G; def coef1G = (1 – b1G + a1G * a1G) / 4; rec ButterG = if barNumber() < 3 then Price else coef1G * (Price + 2 * Price[1] + Price[2]) + coef2G * ButterG[1] + coef3G * ButterG[2]; def a1H = exp(-1.414 * 3.14159 / Period8); def b1H = 2 * a1H * Cos(1.414 * 3.14159 / Period8); def coef2H = b1H; def coef3H = -a1H * a1H; def coef1H = (1 – b1H + a1H * a1H) / 4; rec ButterH = if barNumber() < 3 then Price else coef1H * (Price + 2 * Price[1] + Price[2]) + coef2H * ButterH[1] + coef3H * ButterH[2]; def Os1 = ButterA – ButterB; def Os2 = ButterA – ButterC; def Os3 = ButterA – ButterD; def Os4 = ButterA – ButterE; def Os5 = ButterA – ButterF; def Os6 = ButterA – ButterG; def Os7 = ButterA – ButterH; def a1I = exp(-1.414 * 3.14159 / Period2); def b1I = 2 * a1I * Cos(1.414 * 3.14159 / Period2); def coef2I = b1I; def coef3I = -a1I * a1I; def coef1I = (1 – b1I + a1I * a1I) / 4; rec ButterI = if barNumber() < 3 then Os1 else coef1I * (Os1 + 2 * Os1[1] + Os1[2]) + coef2I * ButterI[1] + coef3I * ButterI[2]; def a1J = exp(-1.414 * 3.14159 / Period3); def b1J = 2 * a1J * Cos(1.414 * 3.14159 / Period3); def coef2J = b1J; def coef3J = -a1J * a1J; def coef1J = (1 – b1J + a1J * a1J) / 4; rec ButterJ = if barNumber() < 3 then Os2 else coef1J * (Os2 + 2 * Os2[1] + Os2[2]) + coef2J * ButterJ[1] + coef3J * ButterJ[2]; def a1K = exp(-1.414 * 3.14159 / Period4); def b1K = 2 * a1K * Cos(1.414 * 3.14159 / Period4); def coef2K = b1K; def coef3K = -a1K * a1K; def coef1K = (1 – b1K + a1K * a1K) / 4; rec ButterK = if barNumber() < 3 then Os3 else coef1K * (Os3 + 2 * Os3[1] + Os3[2]) + coef2K * ButterK[1] + coef3K * ButterK[2]; def a1L = exp(-1.414 * 3.14159 / Period5); def b1L = 2 * a1L * Cos(1.414 * 3.14159 / Period5); def coef2L = b1L; def coef3L = -a1L * a1L; def coef1L = (1 – b1L + a1L * a1L) / 4; rec ButterL = if barNumber() < 3 then Os4 else coef1L * (Os4 + 2 * Os4[1] + Os4[2]) + coef2L * ButterL[1] + coef3L * ButterL[2]; def a1M = exp(-1.414 * 3.14159 / Period6); def b1M = 2 * a1M * Cos(1.414 * 3.14159 / Period6); def coef2M = b1M; def coef3M = -a1M * a1M; def coef1M = (1 – b1M + a1M * a1M) / 4; rec ButterM = if barNumber() < 3 then Os5 else coef1M * (Os5 + 2 * Os5[1] + Os5[2]) + coef2M * ButterM[1] + coef3M * ButterM[2]; def a1N = exp(-1.414 * 3.14159 / Period7); def b1N = 2 * a1N * Cos(1.414 * 3.14159 / Period7); def coef2N = b1N; def coef3N = -a1N * a1N; def coef1N = (1 – b1N + a1N * a1N) / 4; rec ButterN = if barNumber() < 3 then Os6 else coef1N * (Os6 + 2 * Os6[1] + Os6[2]) + coef2N * ButterN[1] + coef3N * ButterN[2]; def a1O = exp(-1.414 * 3.14159 / Period8); def b1O = 2 * a1O * Cos(1.414 * 3.14159 / Period8); def coef2O = b1O; def coef3O = -a1O * a1O; def coef1O = (1 – b1O + a1O * a1O) / 4; rec ButterO = if barNumber() < 3 then Os7 else coef1O * (Os7 + 2 * Os7[1] + Os7[2]) + coef2O * ButterO[1] + coef3O * ButterO[2]; Def Hist1 = OS1 – ButterI; Def Hist2 = OS2 – ButterJ; Def Hist3 = OS3 – ButterK; Def Hist4 = OS4 – ButterL; Def Hist5 = OS5 – ButterM; Def Hist6 = OS6 – ButterN; Def Hist7 = OS7 – ButterO; Def H1BullRise = Hist1 >= 0 and Hist1 >= Hist1[1] ; Def H2BullRise = Hist2 >= 0 and Hist2 >= Hist2[1] ; Def H3BullRise = Hist3 >= 0 and Hist3 >= Hist3[1] ; Def H4BullRise = Hist4 >= 0 and Hist4 >= Hist4[1] ; Def H5BullRise = Hist5 >= 0 and Hist5 >= Hist5[1] ; Def H6BullRise = Hist6 >= 0 and Hist6 >= Hist6[1] ; Def H7BullRise = Hist7 >= 0 and Hist7 >= Hist7[1] ; Def H1BullFall = Hist1 >= 0 and Hist1 < Hist1[1] ; Def H2BullFall = Hist2 >= 0 and Hist2 < Hist2[1] ; Def H3BullFall = Hist3 >= 0 and Hist3 < Hist3[1] ; Def H4BullFall = Hist4 >= 0 and Hist4 < Hist4[1] ; Def H5BullFall = Hist5 >= 0 and Hist5 < Hist5[1] ; Def H6BullFall = Hist6 >= 0 and Hist6 < Hist6[1] ; Def H7BullFall = Hist7 >= 0 and Hist7 < Hist7[1] ; Def H1BearRise = Hist1 < 0 and Hist1 >= Hist1[1] ; Def H2BearRise = Hist2 < 0 and Hist2 >= Hist2[1] ; Def H3BearRise = Hist3 < 0 and Hist3 >= Hist3[1] ; Def H4BearRise = Hist4 < 0 and Hist4 >= Hist4[1] ; Def H5BearRise = Hist5 < 0 and Hist5 >= Hist5[1] ; Def H6BearRise = Hist6 < 0 and Hist6 >= Hist6[1] ; Def H7BearRise = Hist7 < 0 and Hist7 >= Hist7[1] ; Def H1BearFall = Hist1 < 0 and Hist1 < Hist1[1] ; Def H2BearFall = Hist2 < 0 and Hist2 < Hist2[1] ; Def H3BearFall = Hist3 < 0 and Hist3 < Hist3[1] ; Def H4BearFall = Hist4 < 0 and Hist4 < Hist4[1] ; Def H5BearFall = Hist5 < 0 and Hist5 < Hist5[1] ; Def H6BearFall = Hist6 < 0 and Hist6 < Hist6[1] ; Def H7BearFall = Hist7 < 0 and Hist7 < Hist7[1] ; Plot Dot1 = if IsNaN(close) then Double.NaN else 1; Dot1.SetPaintingStrategy(PaintingStrategy.Squares); Dot1.SetLineWeight(DotSize); Dot1.DefineColor("Up", Color.Green); Dot1.DefineColor("UpDecreasing", Color.Dark_Green); Dot1.DefineColor("Down", Color.Dark_Red); Dot1.DefineColor("DownDecreasing", Color.Red); Dot1.AssignValueColor( if H1BullRise == 1 then Dot1.Color("Up") else if H1BullFall == 1 then Dot1.Color("UpDecreasing") else if H1BearRise == 1 then Dot1.Color(“DownDecreasing”) else Dot1.Color("Down") ); Plot Dot2 = if IsNaN(close) then Double.NaN else 2; Dot2.SetPaintingStrategy(PaintingStrategy.Points); Dot2.SetLineWeight(DotSize); Dot2.DefineColor("Up", Color.Green); Dot2.DefineColor("UpDecreasing", Color.Dark_Green); Dot2.DefineColor("Down", Color.Dark_Red); Dot2.DefineColor("DownDecreasing", Color.Red); Dot2.AssignValueColor( if H2BullRise == 1 then Dot2.Color("Up") else if H2BullFall == 1 then Dot2.Color("UpDecreasing") else if H2BearRise == 1 then Dot2.Color(“DownDecreasing”) else Dot2.Color("Down")); Plot Dot3 = if IsNaN(close) then Double.NaN else 3; Dot3.SetPaintingStrategy(PaintingStrategy.Squares); Dot3.SetLineWeight(DotSize); Dot3.DefineColor("Up", Color.Green); Dot3.DefineColor("UpDecreasing", Color.Dark_Green); Dot3.DefineColor("Down", Color.Dark_Red); Dot3.DefineColor("DownDecreasing", Color.Red); Dot3.AssignValueColor( if H3BullRise == 1 then Dot3.Color("Up") else if H3BullFall == 1 then Dot3.Color("UpDecreasing") else if H3BearRise == 1 then Dot3.Color(“DownDecreasing”) else Dot3.Color("Down")); Plot Dot4 = if IsNaN(close) then Double.NaN else 4; Dot4.SetPaintingStrategy(PaintingStrategy.Points); Dot4.SetLineWeight(DotSize); Dot4.DefineColor("Up", Color.Green); Dot4.DefineColor("UpDecreasing", Color.Dark_Green); Dot4.DefineColor("Down", Color.Dark_Red); Dot4.DefineColor("DownDecreasing", Color.Red); Dot4.AssignValueColor( if H4BullRise == 1 then Dot4.Color("Up") else if H4BullFall == 1 then Dot4.Color("UpDecreasing") else if H4BearRise == 1 then Dot4.Color(“DownDecreasing”) else Dot4.Color("Down")); Plot Dot5 = if IsNaN(close) then Double.NaN else 5; Dot5.SetPaintingStrategy(PaintingStrategy.Squares); Dot5.SetLineWeight(DotSize); Dot5.DefineColor("Up", Color.Green); Dot5.DefineColor("UpDecreasing", Color.Dark_Green); Dot5.DefineColor("Down", Color.Dark_Red); Dot5.DefineColor("DownDecreasing", Color.Red); Dot5.AssignValueColor( if H5BullRise == 1 then Dot5.Color("Up") else if H5BullFall == 1 then Dot5.Color("UpDecreasing") else if H5BearRise == 1 then Dot5.Color(“DownDecreasing”) else Dot5.Color("Down")); Plot Dot6 = if IsNaN(close) then Double.NaN else 6; Dot6.SetPaintingStrategy(PaintingStrategy.Points); Dot6.SetLineWeight(DotSize); Dot6.DefineColor("Up", Color.Green); Dot6.DefineColor("UpDecreasing", Color.Dark_Green); Dot6.DefineColor("Down", Color.Dark_Red); Dot6.DefineColor("DownDecreasing", Color.Red); Dot6.AssignValueColor( if H6BullRise == 1 then Dot6.Color("Up") else if H6BullFall == 1 then Dot6.Color("UpDecreasing") else if H6BearRise == 1 then Dot6.Color(“DownDecreasing”) else Dot6.Color("Down")); Plot Dot7 = if IsNaN(close) then Double.NaN else 7; Dot7.SetPaintingStrategy(PaintingStrategy.Squares); Dot7.SetLineWeight(DotSize); Dot7.DefineColor("Up", Color.Green); Dot7.DefineColor("UpDecreasing", Color.Dark_Green); Dot7.DefineColor("Down", Color.Dark_Red); Dot7.DefineColor("DownDecreasing", Color.Red); Dot7.AssignValueColor( if H7BullRise == 1 then Dot7.Color("Up") else if H7BullFall == 1 then Dot7.Color("UpDecreasing") else if H7BearRise == 1 then Dot7.Color(“DownDecreasing”) else Dot7.Color("Down")); input Aprice = close; input length = 20; input Num_Dev_Dn = -2.0; input Num_Dev_up = 2.0; input averageType = AverageType.SIMPLE; input displace = 0; def sDev = StDev(data = Aprice[-displace], length = length); def MidLineBB = MovingAverage(averageType, data = Aprice[-displace], length = length); def LowerBandBB = MidLineBB + Num_Dev_Dn * sDev; def UpperBandBB = MidLineBB + Num_Dev_up * sDev; input factorhigh = 1.0; input factormid = 1.5; input factorlow = 2.0; input trueRangeAverageType = AverageType.SIMPLE; def shifthigh = factorhigh * MovingAverage(trueRangeAverageType, TrueRange(high, close, low), length); def shiftMid = factormid * MovingAverage(trueRangeAverageType, TrueRange(high, close, low), length); def shiftlow = factorlow * MovingAverage(trueRangeAverageType, TrueRange(high, close, low), length); def average = MovingAverage(averageType, Aprice, length); def Avg = average[-displace]; def UpperBandKCLow = average[-displace] + shiftlow[-displace]; def LowerBandKCLow = average[-displace] - shiftlow[-displace]; def UpperBandKCMid = average[-displace] + shiftMid[-displace]; def LowerBandKCMid = average[-displace] - shiftMid[-displace]; def UpperBandKCHigh = average[-displace] + shifthigh[-displace]; def LowerBandKCHigh = average[-displace] - shifthigh[-displace]; def K = (Highest(high, length) + Lowest(low, length)) / 2 + ExpAverage(close, length); def momo = Inertia(Aprice - K / 2, length); def pos = momo>= 0; def neg = momo< 0; def up = momo >= momo[1]; def dn = momo < momo[1]; def presqueeze = LowerBandBB > LowerBandKCLow and UpperBandBB < UpperBandKCLow; def originalSqueeze = LowerBandBB > LowerBandKCMid and UpperBandBB < UpperBandKCMid; def ExtrSqueeze = LowerBandBB > LowerBandKCHigh and UpperBandBB < UpperBandKCHigh; def PosUp = pos and up; def PosDn = pos and dn; def NegDn = neg and dn; def NegUp = neg and up; plot squeezeline = if IsNaN(close) then Double.NaN else 9; squeezeline.SetPaintingStrategy(PaintingStrategy.POINTS); squeezeline.AssignValueColor(if ExtrSqueeze then Color.RED else if originalSqueeze then Color.YELLOW else if presqueeze then Color.DARK_ORANGE else Color.GRAY); squeezeline.SetLineWeight(Dotsize+1); plot momentum = if IsNaN(close) then Double.NaN else 10; momentum.SetPaintingStrategy(PaintingStrategy.Squares); momentum.AssignValueColor( if PosUp then Color.green else if PosDn then Color.dark_green else if NegDn then Color.dark_orange else if NegUp then Color.yellow else Color.YELLOW); Momentum.SetLineWeight(Dotsize); AssignPriceColor( if APC == 1 and H1BullRise == 1 then Dot1.Color("Up") else if APC == 1 and H1BullFall == 1 then Dot1.Color("UpDecreasing") else if APC == 1 and H1BearFall == 1 then Dot1.Color(“DownDecreasing”) else if APC == 1 and H1BearRise == 1 then Dot1.Color("Down") else if APC == 2 and H2BullRise == 1 then Dot2.Color("Up") else if APC == 2 and H2BullFall == 1 then Dot2.Color("UpDecreasing") else if APC == 2 and H2BearFall == 1 then Dot2.Color(“DownDecreasing”) else if APC == 2 and H2BearRise == 1 then Dot2.Color("Down") else if APC == 3 and H3BullRise == 1 then Dot3.Color("Up") else if APC == 3 and H3BullFall == 1 then Dot3.Color("UpDecreasing") else if APC == 3 and H3BearFall == 1 then Dot3.Color(“DownDecreasing”) else if APC == 3 and H3BearRise == 1 then Dot3.Color("Down") else if APC == 4 and H4BullRise == 1 then Dot4.Color("Up") else if APC == 4 and H4BullFall == 1 then Dot4.Color("UpDecreasing") else if APC == 4 and H4BearFall == 1 then Dot4.Color(“DownDecreasing”) else if APC == 4 and H4BearRise == 1 then Dot4.Color("Down") else if APC == 5 and H5BullRise == 1 then Dot5.Color("Up") else if APC == 5 and H5BullFall == 1 then Dot5.Color("UpDecreasing") else if APC == 5 and H5BearFall == 1 then Dot5.Color(“DownDecreasing”) else if APC == 5 and H5BearRise == 1 then Dot5.Color("Down") else if APC == 6 and H6BullRise == 1 then Dot6.Color("Up") else if APC == 6 and H6BullFall == 1 then Dot6.Color("UpDecreasing") else if APC == 6 and H6BearFall == 1 then Dot6.Color(“DownDecreasing”) else if APC == 6 and H6BearRise == 1 then Dot6.Color("Down") else if APC == 7 and H7BullRise == 1 then Dot7.Color("Up") else if APC == 7 and H7BullFall == 1 then Dot7.Color("UpDecreasing") else if APC == 7 and H7BearFall == 1 then Dot7.Color(“DownDecreasing”) else if APC == 7 and H7BearRise == 1 then Dot7.Color("Down") else if APC == 9 and ExtrSqueeze then Color.RED else if APC == 9 and originalSqueeze then Color.YELLOW else if APC == 9 and presqueeze then Color.DARK_ORANGE else If APC == 9 then Color.GRAY Else if APC == 10 and PosUp then Color.green else if APC == 10 and PosDn then Color.dark_green else if APC == 10 and NegDn then Color.dark_orange else if APC == 10 and NegUp then Color.yellow else Color.Current);
You can paint the bars by changing the APC input value to whichever line in the indicator
View attachment 13657
Last edited by a moderator:
would it be possible to get an in-depth explanation of ways to use it? much appreciated
The image in this post:
https://usethinkscript.com/threads/...r-for-thinkorswim-free.4021/page-3#post-91733
is called a trending dashboard.
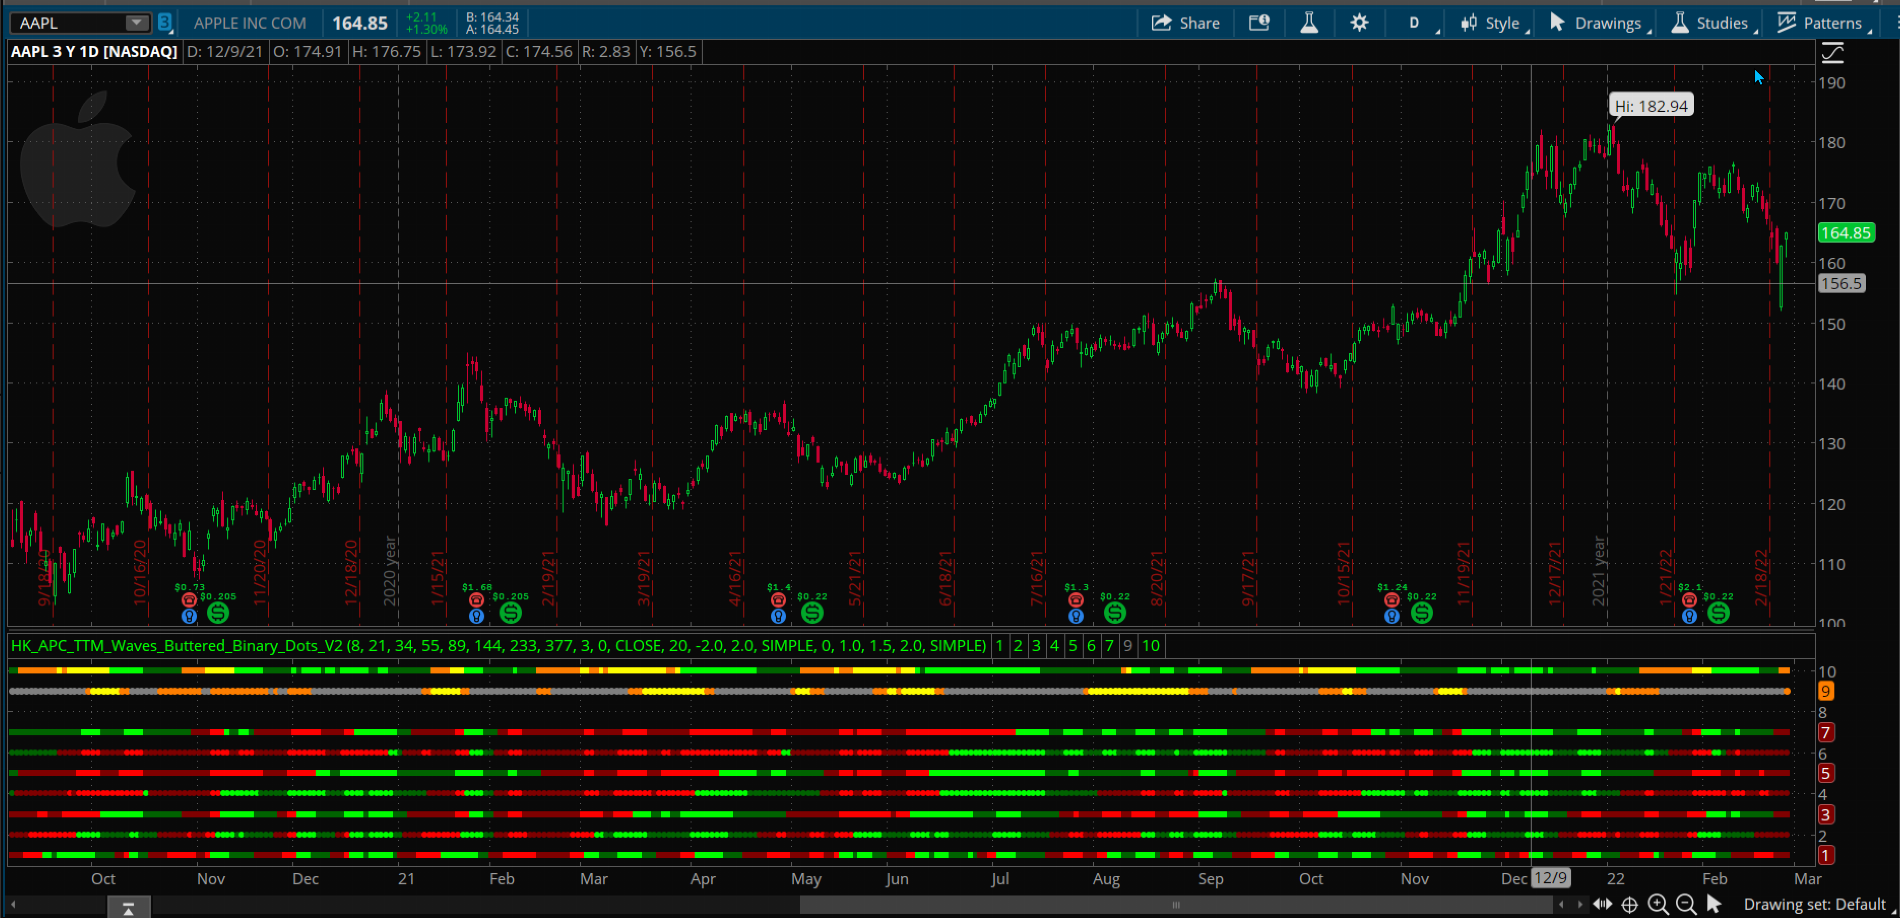
It uses different lengths to confirm the trend.
The shorter lengths are displayed first. Alerting you to the reversal.
As you worked down through the plotted lines; the display uses longer lengths.
As they turn green the trend is confirmed.
Where and when you decide to enter, is based on your level of RiskReward
Last edited:
givemefood
New member
I added the following at the end of the code but the arrows do not show. What am I doing wrong? Please advise. Thanks.Ruby:# Momo arrows input price = close; input length = 20; def K = (Highest(high, length) + Lowest(low, length)) / 2 + ExpAverage(close, length); def momo = Inertia(price - K / 2, length); plot BuyArrow = momo crosses above -2.5 ; BuyArrow.SetPaintingStrategy(PaintingStrategy.BOOLEAN_ARROW_UP); plot SellArrow = momo crosses below 2.5 ; SellArrow.SetPaintingStrategy(PaintingStrategy.BOOLEAN_ARROW_DOWN);
plot BuyArrow = momo crosses above -2.5 ;
BuyArrow.SetPaintingStrategy(PaintingStrategy.BOOLEAN_ARROW_UP);
plot SellArrow = momo crosses below 2.5 ;
SellArrow.SetPaintingStrategy(PaintingStrategy.BOOLEAN_ARROW_DOWN);
You can add this study to chart in the following two ways:I added the following at the end of the code but the arrows do not show. What am I doing wrong? Please advise. Thanks.
plot BuyArrow = momo crosses above -2.5 ;
BuyArrow.SetPaintingStrategy(PaintingStrategy.BOOLEAN_ARROW_UP);
plot SellArrow = momo crosses below 2.5 ;
SellArrow.SetPaintingStrategy(PaintingStrategy.BOOLEAN_ARROW_DOWN);
Ruby:
# Momo arrows
input price = close;
input length = 20;
def K = (Highest(high, length) + Lowest(low, length)) / 2 + ExpAverage(close, length);
def momo = Inertia(price - K / 2, length);

plot BuyArrow = momo crosses above -2.5 ;
BuyArrow.SetPaintingStrategy(PaintingStrategy.BOOLEAN_ARROW_UP);

plot SellArrow = momo crosses below 2.5 ;
SellArrow.SetPaintingStrategy(PaintingStrategy.BOOLEAN_ARROW_DOWN);1. Here is a tutorial for cutting and pasting a study into your chart:
https://usethinkscript.com/threads/how-to-import-existing-thinkscript-code-on-thinkorswim.10/
or
2. you can import the chart below using
this shared chart link: http://tos.mx/aIzlPi5 Click here for --> Easiest way to load shared links
It should be noted that I couldn't find a stock with a histogram that went down to -2.5 or up to 2.5.
In the below example, the numbers were changed to -2.0 and 2.0
Feel free to change the parameters to fit your needs.

New Indicator: Buy the Dip
Check out our Buy the Dip indicator and see how it can help you find profitable swing trading ideas. Scanner, watchlist columns, and add-ons are included.
Similar threads
-
-
-
 Repaints Multi Time Frame MTF Squeeze PRO Labels for ThinkOrSwim
- Started by caseyjbrett
- Replies: 46
-
Repaints Multi Time Frame MTF Squeeze HISTOGRAM Colored Labels for ThinkOrSwim
- Started by caseyjbrett
- Replies: 25
-
Not the exact question you're looking for?
Start a new thread and receive assistance from our community.
87k+
Posts
1836
Online
Similar threads
-
-
-
Repaints Multi Time Frame MTF Squeeze PRO Labels for ThinkOrSwim
- Started by caseyjbrett
- Replies: 46
-
Repaints Multi Time Frame MTF Squeeze HISTOGRAM Colored Labels for ThinkOrSwim
- Started by caseyjbrett
- Replies: 25
-
Similar threads
-
-
-
Repaints Multi Time Frame MTF Squeeze PRO Labels for ThinkOrSwim
- Started by caseyjbrett
- Replies: 46
-
Repaints Multi Time Frame MTF Squeeze HISTOGRAM Colored Labels for ThinkOrSwim
- Started by caseyjbrett
- Replies: 25
-
The Market Trading Game Changer
Join 2,500+ subscribers inside the useThinkScript VIP Membership Club
- Exclusive indicators
- Proven strategies & setups
- Private Discord community
- ‘Buy The Dip’ signal alerts
- Exclusive members-only content
- Add-ons and resources
- 1 full year of unlimited support
Frequently Asked Questions
What is useThinkScript?
useThinkScript is the #1 community of stock market investors using indicators and other tools to power their trading strategies. Traders of all skill levels use our forums to learn about scripting and indicators, help each other, and discover new ways to gain an edge in the markets.
How do I get started?
We get it. Our forum can be intimidating, if not overwhelming. With thousands of topics, tens of thousands of posts, our community has created an incredibly deep knowledge base for stock traders. No one can ever exhaust every resource provided on our site.
If you are new, or just looking for guidance, here are some helpful links to get you started.
- The most viewed thread:
https://usethinkscript.com/threads/repainting-trend-reversal-for-thinkorswim.183/ - Our most popular indicator:
https://usethinkscript.com/threads/buy-the-dip-indicator-for-thinkorswim.3553/ - Answers to frequently asked questions:
https://usethinkscript.com/threads/answers-to-commonly-asked-questions.6006/
What are the benefits of VIP Membership?
VIP members get exclusive access to these proven and tested premium indicators: Buy the Dip, Advanced Market Moves 2.0, Take Profit, and Volatility Trading Range. In addition, VIP members get access to over 50 VIP-only custom indicators, add-ons, and strategies, private VIP-only forums, private Discord channel to discuss trades and strategies in real-time, customer support, trade alerts, and much more. Learn all about VIP membership here.
How can I access the premium indicators?
To access the premium indicators, which are plug and play ready, sign up for VIP membership here.