How to Use the Trade Tab in ThinkOrSwim

theelderwand

Active member
2019 Donor
VIP
Today, I want to spend time covering the Trade tab in ThinkorSwim. Perhaps the most important and the most confusing tab in the TOS platform. The idea is to take the most visited sub tab (i.e) the “All Products” tab.

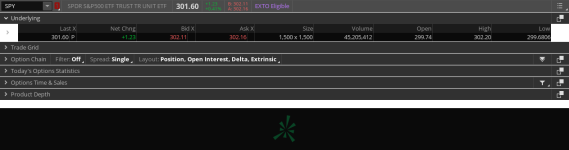
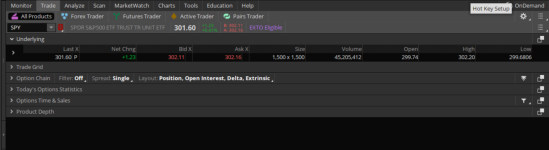
Once you fold all the sub sections inside this tab, you should see the following structure in this tab.

MMiYVob.png


I have chosen SPY as a sample symbol for exploring this tab. Let’s look at the various sections we have in this tab.

Underlying

This section contains the key information about the chosen symbol itself, it could be a stock, ETF, index, Future, Currency etc.

This is also the section where we can buy or sell the underlying directly. As always, we sell at the Bid price and buy at the Ask price. Let’s click on the Ask for SPY to get to the following screen.

gNbmepX.png


Click on Confirm and Send would let us buy the SPY ETF. You can also adjust quantity as needed here.

Trade Grid

This section is similar to the Underlying tab where you can buy and sell but also contains additional data around Level II information. These are advanced lessons and we won’t be covering this in this tutorial.

Option Chain

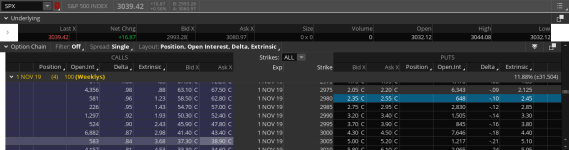
The Option Chain section allows us to buy and sell options, place spreads, iron condors and strangles and so on. On expanding this section, the screen should look like the following.

ZYHgz8K.png


Adjust the following settings for a better trading experience:
  • Filter to Off
This allows us to view at several expiration types, filter by days to expiry and other variety of parameters. It’s best to see all the expiration option chains for an informed trading decision
  • Spread to Single
The spread filter allows the ability to choose predefined spreads, iron condors and other option strategies in a single click. I prefer to keep the spread as single as it offers the best flexibility to choose the trades and adjust them into a strategy as I see fit.
  • Layout to Position, Delta
  • Strikes: ALL
Adjust this depending on how many strikes of options you want to see in the option chain. I set it to All.

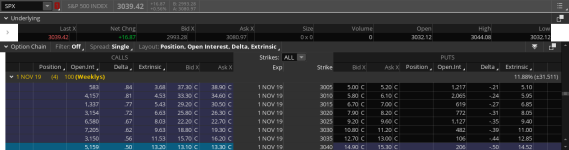
This subsection is arranged into smaller pivots by the expiration period. Expanding open an expiration, shows us two panes split in the middle by the strike price. The options on the left are the calls and on the right are the puts.

As we discussed in the previous tutorials, we know how to place orders from here on.

Buying Single Options

We always sell at the Bid and buy at the Ask. Now go ahead and open any of the expirations for SPX and click on the Ask on the left hand column for a strike, let’s say 3040. You should see the following:

TeyiFz2.png


Click on “Confirm and Send”, you should see a confirmation screen, click on “Send” to execute your order. You have successfully purchased a single call option on SPX.

For puts the idea is pretty similar, on the right hand side columns click on the Ask for your desired strike price, let’s say 2980. The following is how your screen would look like:

sQO8qVv.png


Click on “Confirm and Send”, you should see a confirmation screen, click on “Send” to execute your order. You have successfully purchased a single put option on SPX.

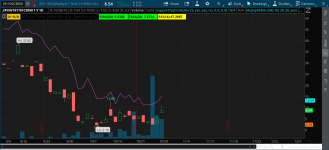
Charting Single Options

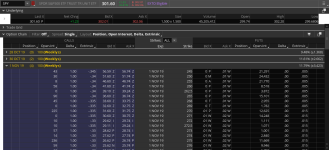
TOS platform also allows you to chart individual options symbols just like any other stock, index or ETF and visualize them. To get to a sample go to the Charts -> Chart and type in the following in the symbol bar “.SPY191101C305” and click on enter, you should see something like this.

o6Ov5d1.png


This is the chart for a single option. Let’s look at what this option is by breaking down the name,
  • . : The dot indicates that this is an option
  • SPY : The next few letter indicate the underlying, in this case SPY ETF
  • 191101 : This is the expiry period on yymmdd format. This is the November 1st 2019
  • C : This represents C(all). It will P for P(ut)
  • 305 : Finally the strike price of the option.

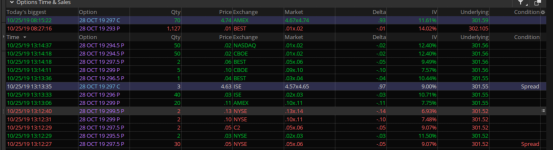
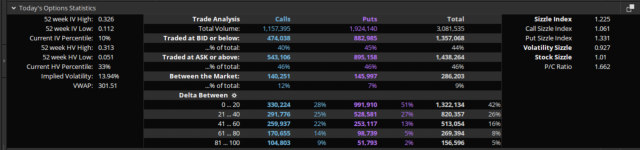
Today’s Option Statistics & Options Time and Sales

These two sections are advanced sections in the TOS platform. They typically look like the following when expanded

2LnUNPU.png


And the following:

wKjylIk.png


The following are the information that we can obtain from these two tabs,
  • Unusually large blocks of trade
  • Last minute options trade which are quite insightful during earnings calls
  • Options that are being traded at Ask or Bid letting us know if the bet is bearish or bullish.
There are other sections in the screen which we won’t be covering in this tutorial and save it for future articles.

That brings us to the end of the first section in the Trade tab. There are a lot of other advanced trading sections in the Trade tab which are saved for future articles.

Happy Trading!!!
 

Attachments

  • wKjylIk.png
    wKjylIk.png
    329.6 KB · Views: 164
  • 2LnUNPU.png
    2LnUNPU.png
    264 KB · Views: 143
  • o6Ov5d1.png
    o6Ov5d1.png
    61.6 KB · Views: 148
  • sQO8qVv.png
    sQO8qVv.png
    56.5 KB · Views: 151
  • TeyiFz2.png
    TeyiFz2.png
    56.5 KB · Views: 155
  • ZYHgz8K.png
    ZYHgz8K.png
    92.5 KB · Views: 149
  • gNbmepX.png
    gNbmepX.png
    26.7 KB · Views: 155
  • MMiYVob.png
    MMiYVob.png
    179.1 KB · Views: 159

Join useThinkScript to post your question to a community of 21,000+ developers and traders.

Very interesting, thank you. I tried to recreate this with a future date, and entered .SPY200901C305. It didn't work.
How can I create an entry like the ".SPY191101C305" above?
 
@pranaman
There is no .SPY200901C305 option in the SPY option chain which is why you aren't finding one... Try .SPY200902C305 or .SPY200904C305 or .SPY200908C305 or .SPY200909C305, etc... SPY options expire on Tuesdays, Wednesdays, and Fridays... Other securities options only expire once or twice a week... And some options don't have expirations every month... They can take some getting used to...
 
Hello,

I am trying to find a way to filter out large block trades. Is there a way to identify options trades with large individual orders? i.e >500 Qty within the time and sales. Similar to how paid services like FlowAlgo do but for ToS.

thanks in advance!
 
@SoopaHot We don't have access to Time & Sales data other than what is available at the bottom of the Trade tab under Options Time & Sales... That panel has limited filtering capabilities but may be what you're looking for...
 
@SoopaHot We don't have access to Time & Sales data other than what is available at the bottom of the Trade tab under Options Time & Sales... That panel has limited filtering capabilities but may be what you're looking for...
yea ive been looking at the time and sales portion to find large block trades, just wanted to see if anyone had found a way to alert when those came accross the tape, thanks!
 
Say i have a list of options in my option scanner for example ABC - $20 Calls - May 21, 2021. Is there a quicker way to check out the chart of ABC - $25 Calls - May 21, 2021 without having to go to the trade tab -> type in the ticker -> scroll through the options chain -> then pull up the chart?

** I think i just solved this myself but if someone has a better solution feel free to share! Basically you right click and copy the option (Ex: ABC210416C17.5 and then change it to ABC210416C20

I was just thinking but is there a possibility to create something where when you Send ABC210416C17.5 to Yellow (2) chart, then Blue (3) chart automatically changes ABC210416C17.5 to ABC210416P20?
 
Last edited:
@wildeye No, we can't send data to a Chart via link using Thinkscript... That feature is only available from within the Thinkorswim platform itself... I use the Copy & Paste method, by Right-Clicking on the Option Chain entry, and also use the bottom Send <OptionCode>To feature to send the option to the appropriately color-linked Chart and Active Trader panels... Due to the number of trading windows I keep open I lean more towards Copy & Paste, however, aside from my primary trading window...

I should also note that you can select an option from within the symbol input on your charts... Click on the drop-down, Select the Options tab, Enter the underlying symbol in the input box, and select the desired option symbol from the Option Chain... The downside of this method is that we cannot customize the columns displayed in this condensed Option Chain...

5iANEZA.png


Which then results in something similar to the following on my system...

AK5scBv.png
Thanks! i agree the send to chart works really well. I have two grids of charts so i've typed in other option codes manually sometimes too
 

Similar threads

Not the exact question you're looking for?

Start a new thread and receive assistance from our community.

87k+ Posts
483 Online
Create Post

Similar threads

Similar threads

The Market Trading Game Changer

Join 2,500+ subscribers inside the useThinkScript VIP Membership Club
  • Exclusive indicators
  • Proven strategies & setups
  • Private Discord community
  • ‘Buy The Dip’ signal alerts
  • Exclusive members-only content
  • Add-ons and resources
  • 1 full year of unlimited support

Frequently Asked Questions

What is useThinkScript?

useThinkScript is the #1 community of stock market investors using indicators and other tools to power their trading strategies. Traders of all skill levels use our forums to learn about scripting and indicators, help each other, and discover new ways to gain an edge in the markets.

How do I get started?

We get it. Our forum can be intimidating, if not overwhelming. With thousands of topics, tens of thousands of posts, our community has created an incredibly deep knowledge base for stock traders. No one can ever exhaust every resource provided on our site.

If you are new, or just looking for guidance, here are some helpful links to get you started.

What are the benefits of VIP Membership?
VIP members get exclusive access to these proven and tested premium indicators: Buy the Dip, Advanced Market Moves 2.0, Take Profit, and Volatility Trading Range. In addition, VIP members get access to over 50 VIP-only custom indicators, add-ons, and strategies, private VIP-only forums, private Discord channel to discuss trades and strategies in real-time, customer support, trade alerts, and much more. Learn all about VIP membership here.
How can I access the premium indicators?
To access the premium indicators, which are plug and play ready, sign up for VIP membership here.
Back
Top