
Please allow me to clarify. I realize the chart I posted looks just like the screen shot that accompanied the script in #1. My confusion is that the patterns are all connected. I'll have to wait until Monday to see how this maps out in real time. I am used to seeing the individual harmonic patterns individually. Perhaps S. Carney's software that runs on Trading View does not calculate all 12 patterns ???
You are using an out of date browser. It may not display this or other websites correctly.
You should upgrade or use an alternative browser.
You should upgrade or use an alternative browser.
Repaints Harmonic Patterns Indicator for ThinkorSwim (ZigZag, Bat, Butterfly, ABCD)
Repaints

New Indicator: Buy the Dip
Check out our Buy the Dip indicator and see how it can help you find profitable swing trading ideas. Scanner, watchlist columns, and add-ons are included.
Please allow me to clarify. I realize the chart I posted looks just like the screen shot that accompanied the script in #1. My confusion is that the patterns are all connected. I'll have to wait until Monday to see how this maps out in real time. I am used to seeing the individual harmonic patterns individually. Perhaps S. Carney's software that runs on Trading View does not calculate all 12 patterns ???
Possibly. Plus, those are the white ZigZag lines.
Mcdon, I downloaded your script back in Dec 2019 and have been using it since as an additional indicator. This morning, I went back to the script to see what was in it to get a better understanding of the signals. Is there an updated script to the one from Dec 2019? It is hard to tell recent updates when I went back over historical Harmonic Patterns. Are these signals "repainted" ? Many thanks.not that I am an Elliot expert, but according to most stuff I read your waiting until the 4th and 5th wave. so called smart traders wait until the 5th. without all the cycles built in, the concept of trading Elliott waves is extremely difficult. Even the TOS scripts which promote themselves as "Elliott" only have one cycle. Seems counter productive not to include mono cycles. I've added a few more "Elliott" type stuff and other patterns I mess with as I wanted to share with all the scripters which helped me, but I would have a health skepticism with it as it requires a better script.
not that I am an Elliot expert, but according to most stuff I read your waiting until the 4th and 5th wave. so called smart traders wait until the 5th. without all the cycles built in, the concept of trading Elliott waves is extremely difficult. Even the TOS scripts which promote themselves as "Elliott" only have one cycle. Seems counter productive not to include mono cycles. I've added a few more "Elliott" type stuff and other patterns I mess with as I wanted to share with all the scripters which helped me, but I would have a health skepticism with it as it requires a better script. https://tos.mx/056xjyp
side note: if you really want wave 3, ill add it.
side note: if you really want wave 3, ill add it.
Last edited by a moderator:
Mcdon, I downloaded your script back in Dec 2019 and have been using it since as an additional indicator. This morning, I went back to the script to see what was in it to get a better understanding of the signals. Is there an updated script to the one from Dec 2019? It is hard to tell recent updates when I went back over historical Harmonic Patterns.
No, there are no updates to @mcdon030's Elliot Wave as the Elliot Wave definition has not changed.
Are these signals "repainted" ? Many thanks.
Yes, all waves, zig-zags, reversals repaint
read more:
https://usethinkscript.com/threads/answers-to-commonly-asked-questions.6006/#post-57833
It repaints.Mcdon, I downloaded your script back in Dec 2019 and have been using it since as an additional indicator. This morning, I went back to the script to see what was in it to get a better understanding of the signals. Is there an updated script to the one from Dec 2019? It is hard to tell recent updates when I went back over historical Harmonic Patterns. Are these signals "repainted" ? Many thanks.
I read your comment yesterday and thought about it overnight. Typically, I don't write too much in my replies, but I thought I would offer free advice to save you time as I was deep in this rabbit whole a few years ago with harmonic patterns. I recreated this script with Peak and Trough Analysis, which is somewhere in the platform, to back test harmonics. I ended up scraping that with a custom set of pivots they are profitable alone – meaning, many, many interactions for pivots. It took a year and half to make a harmonic trade strategy profitable, but harmonic trade management has too many variables. Here are the facts that I currently believe:
- Scott Carney stole his harmonic ideas from Bryce Gilmore. This can easily be verified by reading his material. If you are dead set on trading harmonics, read Bryce Gilmore. His 90% reversal rule is legitimate and most of his books are thorough and free. I keep an algo running to recognize his 90% reversal rule, and don’t trust my initial code if you find it. It is faulty.
- Don’t trade the big-name patterns such as Gartley. There are too many smart money computers identifying it so they reverse it all the time against dum money. A bat pattern doesn’t need ingenious trade mechanics as it is a very reliable pattern. My second is cypher. I know this as I back tested every time across the DOW.
- DOW symbols respond better to harmonic patterns for some reason. Research has been done to verify this.
- Most harmonics are like a double bottom/top pattern. Instead of coding or buying a harmonic pattern script, find a decent pivot code and draw lines from the high and low. Trade when price touches of those lines instead.
Cheers, mcdon
perseverance_trading1
New member
It repaints.
I read your comment yesterday and thought about it overnight. Typically, I don't write too much in my replies, but I thought I would offer free advice to save you time as I was deep in this rabbit whole a few years ago with harmonic patterns. I recreated this script with Peak and Trough Analysis, which is somewhere in the platform, to back test harmonics. I ended up scraping that with a custom set of pivots they are profitable alone – meaning, many, many interactions for pivots. It took a year and half to make a harmonic trade strategy profitable, but harmonic trade management has too many variables. Here are the facts that I currently believe:
- Scott Carney stole his harmonic ideas from Bryce Gilmore. This can easily be verified by reading his material. If you are dead set on trading harmonics, read Bryce Gilmore. His 90% reversal rule is legitimate and most of his books are thorough and free. I keep an algo running to recognize his 90% reversal rule, and don’t trust my initial code if you find it. It is faulty.
- Don’t trade the big-name patterns such as Gartley. There are too many smart money computers identifying it so they reverse it all the time against dum money. A bat pattern doesn’t need ingenious trade mechanics as it is a very reliable pattern. My second is cypher. I know this as I back tested every time across the DOW.
- DOW symbols respond better to harmonic patterns for some reason. Research has been done to verify this.
- Most harmonics are like a double bottom/top pattern. Instead of coding or buying a harmonic pattern script, find a decent pivot code and draw lines from the high and low. Trade when price touches of those lines instead.
Cheers, mcdon
I was looking to read up on Bryce Gilmore and his publications as Larry Pesavento credit's him as the founder of the Butterfly Pattern and Level 10, a concept where his software would highlight places in price where ten instances of price was hitting the same price and time at a single point.
Have you read his (Bryce's) materials? What would recommend someone read of his materials and what could they get out of it?
I did a search on Amazon and didn't really find any of Bryce's work.
What should someone try to read and where should they go to buy the materials?
It's very difficult to strip away all of the noise to be able to focus on the core information.
I have read all his work and would recommend reading everything he has. He shared so much before he sold his software. You’re right that Larry Pesavento and Robert Minor credit him a lot. There is only one book that I couldn’t download for free, but I don’t recall which one. One of his book shows in detail how he implements this in real time.I was looking to read up on Bryce Gilmore and his publications as Larry Pesavento credit's him as the founder of the Butterfly Pattern and Level 10, a concept where his software would highlight places in price where ten instances of price was hitting the same price and time at a single point.
Have you read his (Bryce's) materials? What would recommend someone read of his materials and what could they get out of it?
I did a search on Amazon and didn't really find any of Bryce's work.
What should someone try to read and where should they go to buy the materials?
It's very difficult to strip away all of the noise to be able to focus on the core information.
I would focus on his 90% reversal pattern, false break pattern, and volume placement in the last 5 pivots. I did quite a lot of historical backtest to see if these work and they do. Specifically, read Price Action Manual [c] 2007, Chapter 19. I specifically took that out of the PDF. I’m not sure that I could share that publicly as I can’t remember if I bought that book or not. If you search GitHub, I did code all his fib levels. It was when I first started so there is some redundant coding, but they are still in line with the section I just noted.
yellowredmg
New member
your code has error . it wouldn't loan in TOS .
your code has error . it wouldn't loan in TOS .
Both the code and the shared link load fine.
You didn't provide enough information to say where you went astray.
For future reference, here is a tutorial on how to cut & paste a study into the ToS app:
https://usethinkscript.com/threads/how-to-import-existing-thinkscript-code-on-thinkorswim.10/
And here is a tutorial on how to import a shared link:
https://usethinkscript.com/threads/...ed-item-error-in-thinkorswim.5098/#post-57930
Perhaps this will help. Here is a chart with the indicator already loaded on it.
When you import, the following link. It will open a chart with the indicator, and it will put the study into your custom study tab for your future use.
Shared Chart Link: http://tos.mx/0MAHhpU Click here for --> Easiest way to load shared links
SwingIsKing
New member
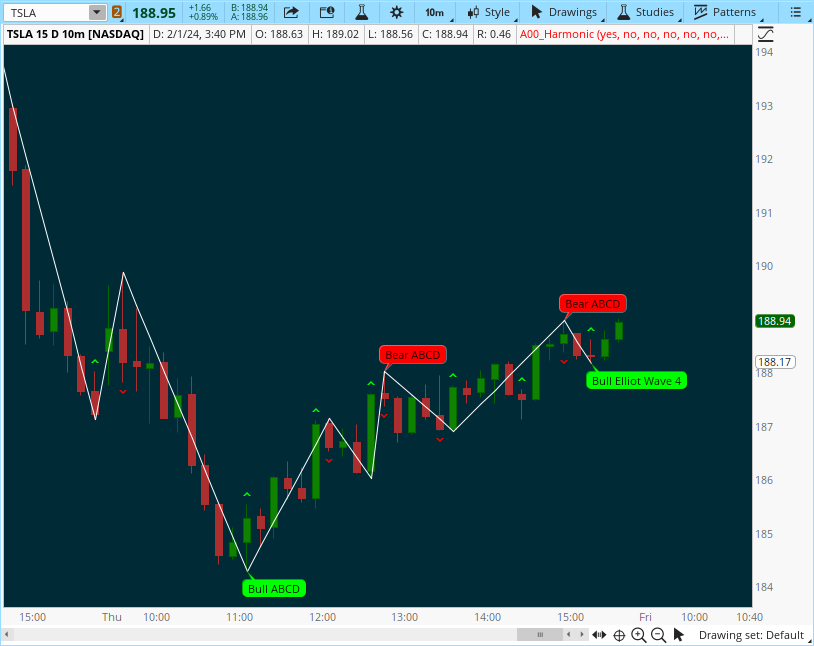
This is really excellent. Thank you for sharing with the community. Is there a way to scan for the Bull ABCD?This is a multi-harmonic patterns indicator for ThinkorSwim that is consists of 12 different type of patterns including Wolf Wave, Zig Zag, Butterfly, Crab, Elliot Wave, Gartley, and many more.
All of these harmonic and fractals patterns are identified automatically for you. Once the pattern is detected, it will be drawn and labeled right on your chart.
These bearish and bullish patterns can be used to find potential long or short reversal trade ideas.
View attachment 4332
thinkScript Code
Code:# HarmonicsAndFractals_v03_Mcdon # name by JQ #hint select either showpatterns or gilmores to declutter. #----------------------------------------------------------------# #============== Syracusepro Harmonics and Fractals ==============# #----------------------------------------------------------------# #===== This program was made with the intention of educational # #===== purposes. It contains fractal and harmonic patterns. # #===== On the zigzags, the Fibonacci sequence numbers are also # #===== included, and shows what makes each patterns valid with # #===== their correct names. # #=========== I hope people interested can make a great program # #=========== out of this material. Thanks. ======================# #----------------------------------------------------------------# #---------------- Total of 12 Harmonic Patterns -----------------# #================= Http://www.thinkscriptcode.com ===============# #---------------------------------------# #===== Irregular fractals function =====# #---------------------------------------# ###### ###### mcdon030 addded tolerance per Larry Pesavento and 19 more patterns ###### mcdon030 7 more patterns, elliot waves, head and shoulders and bg 90% reversal ###### notes: DUST ETF daily confluence wave4 and hns script isRegularFractal { input mode = 0; plot ret = if mode == 1 then high[4] < high[3] and high[3] < high[2] and high[2] > high[1] and high[1] > high[0] else if mode == -1 then low[4] > low[3] and low[3] > low[2] and low[2] < low[1] and low[1] < low[0] else 0; } #---------------------------------------# #===== BWilliams fractals function =====# #---------------------------------------# script isBWFractal { input mode = 0; plot ret = if mode == 1 then high[4] < high[2] and high[3] <= high[2] and high[2] >= high[1] and high[2] > high[0] else if mode == -1 then low[4] > low[2] and low[3] >= low[2] and low[2] <= low[1] and low[2] < low[0] else 0; } input showgilmore = Yes; input showPatterns = Yes; input showBarColors = No; input filterBW = No; input ShowHHLL = No; input ShowTimeFractals1 = No; input showArrows = No; input tolerance = .06; input timeframe1 = {MIN, TWO_MIN, THREE_MIN, FOUR_MIN, FIVE_MIN, TEN_MIN, FIFTEEN_MIN, TWENTY_MIN, THIRTY_MIN, HOUR, TWO_HOURS, FOUR_HOURS, default DAY, TWO_DAYS, THREE_DAYS, FOUR_DAYS, WEEK, MONTH, OPT_EXP}; input showchannel1 = No; input showchannel2 = No; input showchannel3 = No; input showZigZag = Yes; def bn = BarNumber(); def h2 = high[2]; def l2 = low[2]; def filteredtopf = if filterBW then isRegularFractal(1) else isBWFractal(1); def filteredbotf = if filterBW then isRegularFractal(-1) else isBWFractal(-1); plot TopFractals = filteredtopf[-2]; plot BottomFractals = filteredbotf[-2]; TopFractals.SetPaintingStrategy(PaintingStrategy.BOOLEAN_WEDGE_DOWN); TopFractals.SetDefaultColor(Color.RED); BottomFractals.SetPaintingStrategy(PaintingStrategy.BOOLEAN_WEDGE_UP); BottomFractals.SetDefaultColor(Color.GREEN ); def b1_0 = if bn == 0 then -1 else if filteredtopf == 0 then 0 else if b1_0[1] > -1 then b1_0[1] + 1 else -1; def b1_1 = b1_0 + GetValue(b1_0, b1_0 + 1, 0) + 1; def b1_2 = b1_1 + GetValue(b1_0, b1_1 + 1, 0) + 1; def b2_0 = if bn == 0 then -1 else if filteredbotf == 0 then 0 else if b2_0[1] > -1 then b2_0[1] + 1 else -1; def b2_1 = b2_0 + GetValue(b2_0, b2_0 + 1, 0) + 1; def b2_2 = b2_1 + GetValue(b2_0, b1_1 + 1, 0) + 1; def higherhigh = if filteredtopf == 0 or b1_2 == b1_1 then 0 else GetValue(high[2], b1_1, 0) < GetValue(high[2], b1_0, 0) and GetValue(high[2], b1_2, 0) < GetValue(high[2], b1_0, 0); def lowerhigh = if filteredtopf == 0 or b1_2 == b1_1 then 0 else GetValue(high[2], b1_1, 0) > GetValue(high[2], b1_0, 0) and GetValue(high[2], b1_2, 0) > GetValue(high[2], b1_0, 0); def higherlow = if filteredbotf == 0 or b2_2 == b2_1 then 0 else GetValue(low[2], b2_1, 0) < GetValue(low[2], b2_0, 0) and GetValue(low[2], b2_2, 0) < GetValue(low[2], b2_0, 0); def lowerlow = if filteredbotf == 0 or b2_2 == b2_1 then 0 else GetValue(low[2], b2_1, 0) > GetValue(low[2], b2_0, 0) and GetValue(low[2], b2_2, 0) > GetValue(low[2], b2_0, 0); AddChartBubble(ShowHHLL and higherhigh, high[-2], "[HH]", Color.CYAN, yes); AddChartBubble(ShowHHLL and lowerhigh, high[-2], "[LH]", Color.CYAN, yes); AddChartBubble(ShowHHLL and higherlow, low[-2], "[HL]", Color.GREEN); AddChartBubble(ShowHHLL and lowerlow, low[-2], "[LL]", Color.GREEN); def hh = if bn == 0 then -1 else if higherhigh == 1 then 0 else if hh[1] > -1 then hh[1] + 1 else -1; def ll = if bn == 0 then -1 else if lowerlow == 1 then 0 else if ll[1] > -1 then ll[1] + 1 else -1; def higherhhigh = if higherhigh == 0 or hh == -1 then 0 else GetValue(high[2], hh, 0) >= high(period = timeframe1) ; def lowerllow = if lowerlow == 0 or ll == -1 then 0 else GetValue(low[2], ll, 0) <= low(period = timeframe1); AddChartBubble(ShowTimeFractals1 and higherhhigh , high[-2], "[TL]", Color.GREEN, yes); AddChartBubble(ShowTimeFractals1 and lowerllow, low[-2], "[TL]", Color.GREEN); plot TopChannel1 = if showchannel1 and filteredtopf then h2[-2] else Double.NaN; plot BottomChannel1 = if showchannel1 and filteredbotf then l2[-2] else Double.NaN; TopChannel1.SetDefaultColor(Color.GREEN); BottomChannel1.SetDefaultColor(Color.RED); TopChannel1.EnableApproximation(); BottomChannel1.EnableApproximation(); plot TopChannel2 = if showchannel2 and higherhigh then h2[-2] else Double.NaN; plot BottomChannel2 = if showchannel2 and lowerlow then l2[-2] else Double.NaN; TopChannel2.SetDefaultColor(Color.BLUE); BottomChannel2.SetDefaultColor(Color.BLUE); TopChannel2.EnableApproximation(); BottomChannel2.EnableApproximation(); plot TopChannel3 = if showchannel3 and higherhhigh then h2[-2] else Double.NaN; plot BottomChannel3 = if showchannel3 and lowerllow then l2[-2] else Double.NaN; TopChannel3.SetDefaultColor(Color.VIOLET); BottomChannel3.SetDefaultColor(Color.VIOLET); TopChannel3.EnableApproximation(); BottomChannel3.EnableApproximation(); AddCloud(TopChannel3, BottomChannel3, Color.GREEN, Color.RED); def istop = if ShowTimeFractals1 then (if higherhhigh then 1 else 0) else (if filteredtopf then 1 else 0); def isbot = if ShowTimeFractals1 then (if lowerllow then 1 else 0) else (if filteredbotf then 1 else 0); def topcount0 = if istop then bn else topcount0[1]; def botcount0 = if isbot then bn else botcount0[1]; def topcount = bn - topcount0; def botcount = bn - botcount0; def zigzag = if istop and topcount[1] > botcount[1] then h2 else if isbot and topcount[1] < botcount[1] then l2 else Double.NaN; ##def zigzag = if istop and topcount[1] > botcount[1] && istop>isbot[1] then h2 else if isbot and topcount[1] < botcount[1] && isbot<istop[1] then l2 else Double.NaN; plot zz = if showZigZag then zigzag[-2] else Double.NaN; zz.SetDefaultColor(Color.WHITE); zz.EnableApproximation(); AssignPriceColor(if showBarColors and IsNaN(zigzag) == 0 then (if h2 == zigzag then Color.BLUE else if l2 == zigzag then Color.CYAN else Color.CURRENT) else Color.CURRENT); def z_0 = if bn == 0 then -1 else if IsNaN(zigzag) == 0 then 0 else if z_0[1] > -1 then z_0[1] + 1 else -1; def z_1 = z_0 + GetValue(z_0, z_0 + 1, 0) + 1; def z_2 = z_1 + GetValue(z_0, z_1 + 1, 0) + 1; def z_3 = z_2 + GetValue(z_0, z_2 + 1, 0) + 1; def z_4 = z_3 + GetValue(z_0, z_3 + 1, 0) + 1; def z_5 = z_4 + GetValue(z_0, z_4 + 1, 0) + 1; def z_6= z_5 + GetValue(z_0, z_5+ 1, 0) + 1; def z_7 = z_6 + GetValue(z_0, z_6 + 1, 0) + 1; def z_8 = z_7+ GetValue(z_0, z_7 + 1, 0) + 1; def z_9 = z_8+ GetValue(z_0, z_8 + 1, 0) + 1; #======= Preparing the XABCD Patterns =======# def x1_ = GetValue(zigzag, z_5, 0); #mcdon def x = GetValue(zigzag, z_4, 0); def a = GetValue(zigzag, z_3, 0); def b = GetValue(zigzag, z_2, 0); def c = GetValue(zigzag, z_1, 0); def d = GetValue(zigzag, z_0, 0); #====== Combination to create the patterns ======# def xab = (AbsValue(b - a) / AbsValue(x - a)); def xad = (AbsValue(a - d) / AbsValue(x - a)); def abc = (AbsValue(b - c) / AbsValue(a - b)); def bcd = (AbsValue(c - d) / AbsValue(b - c)); def xabc = (AbsValue(b - c) / AbsValue(x - a)); ################ mcdons additions def x1xcd = (AbsValue(d - c) / AbsValue(x1_ - x));## wave5 def x1xab = (AbsValue(b - a) / AbsValue(x1_ - x));## wave3 def x1xxa = (AbsValue(x - a) / AbsValue(x1_ - x));## wave2 def xabbxd = (AbsValue(bcd ) / AbsValue(xab)); def dcxab = (AbsValue(xab) / AbsValue(bcd )); def xababc = (AbsValue(xab) / AbsValue(abc)); ### time measures def currentBar = HighestAll(if !IsNaN(c) then bn else double.nan); def cp2 = if a then currentBar-bn else cp2[1]; def cp3 = if b then currentBar-bn else cp3[1]; def cp4 = if c then currentBar-bn else cp4[1]; def cp5 = if d then currentBar-bn else cp5[1]; def tp3u =if b then currentBar-cp2 else tp3u[1]; def tp4u = if c then currentBar-cp3 else tp4u[1] ; def tp5u = if d then currentBar-cp4 else tp5u[1] ; def tp25u = if d then currentBar-cp2 else tp25u [1] ; #===== Checking to see if there is a pattern functions =====# #---------------------------------------# #======== Bat Pattern Function =========# #---------------------------------------# script isBat { input _mode = 0; input xab = 0; input xad = 0; input abc = 0; input bcd = 0; input d = 0; input c = 0; def _xab = xab >= 0.382 and xab <= 0.5; def _abc = abc >= 0.382 and abc <= 0.886; def _bcd = bcd >= 1.618 and bcd <= 2.618; def _xad = xad <= 0.886; plot ret = _xab and _abc and _bcd and _xad and (if _mode == 1 then d < c else d > c); } #---------------------------------------# #==== Alternate Bat Pattern Function ===# #---------------------------------------# script isAltBat { input _mode = 0; input xab = 0; input xad = 0; input abc = 0; input bcd = 0; input d = 0; input c = 0; def _xab = xab <= 0.382; def _abc = abc >= 0.382 and abc <= 0.886; def _bcd = bcd >= 2.0 and bcd <= 3.618; def _xad = xad <= 1.13; plot ret = _xab and _abc and _bcd and _xad and (if _mode == 1 then d < c else d > c); } #---------------------------------------# #= ==== Butterfly Pattern Function =====# #---------------------------------------# script isButterfly { input _mode = 0; input xab = 0; input xad = 0; input abc = 0; input bcd = 0; input d = 0; input c = 0; def _xab = xab <= 0.786; def _abc = abc >= 0.382 and abc <= 0.886; def _bcd = bcd >= 1.618 and bcd <= 2.618; def _xad = xad >= 1.27 and xad <= 1.618; plot ret = _xab and _abc and _bcd and _xad and (if _mode == 1 then d < c else d > c); } #---------------------------------------# #======== ABCD Pattern Function ========# #---------------------------------------# script isABCD { input _mode = 0; input abc = 0; input bcd = 0; input d = 0; input c = 0; def _abc = abc >= 0.382 and abc <= 0.886; def _bcd = bcd >= 1.13 and bcd <= 2.618; plot ret = _abc and _bcd and (if _mode == 1 then d < c else d > c); } #---------------------------------------# #====== Gartley Pattern Function =======# #---------------------------------------# script isGartley { input _mode = 0; input xab = 0; input xad = 0; input abc = 0; input bcd = 0; input d = 0; input c = 0; def _xab = xab >= 0.5 and xab <= 0.618; def _abc = abc >= 0.382 and abc <= 0.886; def _bcd = bcd >= 1.13 and bcd <= 2.618; def _xad = xad >= 0.75 and xad <= 0.875; plot ret = _xab and _abc and _bcd and _xad and (if _mode == 1 then d < c else d > c); } #---------------------------------------# #======== Crab Pattern Function ========# #---------------------------------------# script isCrab { input _mode = 0; input xab = 0; input xad = 0; input abc = 0; input bcd = 0; input d = 0; input c = 0; def _xab = xab >= 0.75 and xab <= 0.875; def _abc = abc >= 0.382 and abc <= 0.886; def _bcd = bcd >= 2.0 and bcd <= 3.618; def _xad = xad >= 1.5 and xad <= 1.625; plot ret = _xab and _abc and _bcd and _xad and (if _mode == 1 then d < c else d > c); } #---------------------------------------# #======== Shark Pattern Function =======# #---------------------------------------# script isShark { input _mode = 0; input xab = 0; input xad = 0; input abc = 0; input bcd = 0; input d = 0; input c = 0; def _xab = xab >= 0.5 and xab <= 0.875; def _abc = abc >= 1.13 and abc <= 1.618; def _bcd = bcd >= 1.27 and bcd <= 2.24; def _xad = xad >= 0.88 and xad <= 1.13; plot ret = _xab and _abc and _bcd and _xad and (if _mode == 1 then d < c else d > c); } #---------------------------------------# #========= 5-0 Pattern Function ========# #---------------------------------------# script is5o { input _mode = 0; input xab = 0; input xad = 0; input abc = 0; input bcd = 0; input d = 0; input c = 0; def _xab = xab >= 1.13 and xab <= 1.618; def _abc = abc >= 1.618 and abc <= 2.24; def _bcd = bcd >= 0.5 and bcd <= 0.625; def _xad = xad >= 0.0 and xad <= 0.236; plot ret = _xab and _abc and _bcd and _xad and (if _mode == 1 then d < c else d > c); } #---------------------------------------# #======= Wolfe Pattern Function ========# #---------------------------------------# script isWolf { input _mode = 0; input xab = 0; input xad = 0; input abc = 0; input bcd = 0; input d = 0; input c = 0; def _xab = xab >= 1.27 and xab <= 1.618; def _abc = abc >= 0 and abc <= 5; def _bcd = bcd >= 1.27 and bcd <= 1.618; def _xad = xad >= 0.0 and xad <= 5; plot ret = _xab and _abc and _bcd and _xad and (if _mode == 1 then d < c else d > c); } #-----------------------------------------------# #===== Head And Shoulders Pattern Function =====# #-----------------------------------------------# script isHnS { input _mode = 0; input xab = 0; input xad = 0; input abc = 0; input bcd = 0; input d = 0; input c = 0; def _xab = xab >= 2.0 and xab <= 10; def _abc = abc >= 0.90 and abc <= 1.1; def _bcd = bcd >= 0.236 and bcd <= 0.88; def _xad = xad >= 0.90 and xad <= 1.1; plot ret = _xab and _abc and _bcd and _xad and (if _mode == 1 then d < c else d > c); } #--------------------------------------------------# #===== Con Triangle Harmonic Pattern Function =====# #--------------------------------------------------# script isConTria { input _mode = 0; input xab = 0; input xad = 0; input abc = 0; input bcd = 0; input d = 0; input c = 0; def _xab = xab >= 0.382 and xab <= 0.618; def _abc = abc >= 0.382 and abc <= 0.618; def _bcd = bcd >= 0.382 and bcd <= 0.618; def _xad = xad >= 0.236 and xad <= 0.764; plot ret = _xab and _abc and _bcd and _xad and (if _mode == 1 then d < c else d > c); } #-----------------------------------------# #===== Exp Triangle Pattern Function =====# #-----------------------------------------# script isExpTria { input _mode = 0; input xab = 0; input xad = 0; input abc = 0; input bcd = 0; input d = 0; input c = 0; def _xab = xab >= 1.236 and xab <= 1.618; def _abc = abc >= 1.000 and abc <= 1.618; def _bcd = bcd >= 1.236 and bcd <= 2.000; def _xad = xad >= 2.000 and xad <= 2.236; plot ret = _xab and _abc and _bcd and _xad and (if _mode == 1 then d < c else d > c); } #############################33333333333333 MCDON's Additions ########################## #--------------------------------------------------# #===== Symmetry Harmonic Pattern Function =====# #--------------------------------------------------# script isSymm { input _mode = 0; input xab = 0; input xad = 0; input abc = 0; input bcd = 0; input xabbxd = 0; input dcxab = 0; input xababc = 0; input d = 0; input c = 0; def _xab = xab >= .382 and xab <= 4.236; def _abc = abc >= .1 and abc <= 1000; def _bcd = bcd >= .1 and bcd <= 1000; def _xad = xad >= .1 and xad <= 1000; def _xabbxd = xabbxd >= .50 and xabbxd <= 1.272; def _dcxab = dcxab >= .50 and dcxab <= 1.272; def _xababc = xababc >= .50 and xababc <= 1.272; plot ret = _xab and _abc and _bcd and _xad and _xabbxd and _dcxab and _xababc and (if _mode == 1 then d < c else d > c); } #------------------------------------ -----# #===== Cypher Pattern Function =====# #-----------------------------------------# script isCyph { input _mode = 0; input xab = 0; input xad = 0; input abc = 0; input bcd = 0; input d = 0; input c = 0; def _xab = xab >= .382 and xab <= 0.618; def _abc = abc >= 1.13 and abc <= 1.414; def _bcd = bcd >= 1.272 and bcd <= 2.000; def _xad = xad >= .786 and xad <= .786; plot ret = _xab and _abc and _bcd and _xad and (if _mode == 1 then d < c else d > c); } #--------------------------------------------------# #===== ABCD Reciprocal Harmonic Pattern Function =====# #--------------------------------------------------# script isABCDR { input _mode = 0; input abc = 0; input bcd = 0; input d = 0; input c = 0; def _abc = abc >= 1.13 and abc <= 0.786; def _bcd = bcd >= .382 and bcd <= .886; plot ret = _abc and _bcd and (if _mode == 1 then d < c else d > c); } #--------------------------------------------------# #=====GarFly Harmonic Pattern Function =====# #--------------------------------------------------# script isGfly { input _mode = 0; input xab = 0; input xad = 0; input abc = 0; input bcd = 0; input d = 0; input c = 0; def _xab = xab >= .618 and xab <= 0.618 ; def _abc = abc >= 0.318 and abc <= .886; def _bcd = bcd >= 1.618 and bcd <= 2.24; def _xad = xad >= 1.272 and xad <= 1.272; plot ret = _xab and _abc and _bcd and _xad and (if _mode == 1 then d < c else d > c); } #--------------------------------------------------# #=====One Two One Harmonic Pattern Function =====# #--------------------------------------------------# script isOTO { input _mode = 0; input xab = 0; input xad = 0; input abc = 0; input bcd = 0; input d = 0; input c = 0; def _xab = xab >= .50 and xab <= .786 ; def _abc = abc >= 1.128 and abc <= 3.618; def _bcd = bcd >= .382 and bcd <= .786; def _xad = xad >= .382 and xad <= .786 ; plot ret = _xab and _abc and _bcd and _xad and (if _mode == 1 then d < c else d > c); } #--------------------------------------------------# #=====Black Swan Harmonic Pattern Function =====# #--------------------------------------------------# script isBS { input _mode = 0; input xab = 0; input xad = 0; input abc = 0; input bcd = 0; input d = 0; input c = 0; def _xab = xab >= 1.382 and xab <= 2.618 ; def _abc = abc >= 0.236 and abc <= .50; def _bcd = bcd >= 1.128 and bcd <= 2.00; def _xad = xad >= 1.128 and xad <= 2.618 ; plot ret = _xab and _abc and _bcd and _xad and (if _mode == 1 then d < c else d > c); } #--------------------------------------------------# #=====Rectangle Harmonic Pattern Function =====##### check ratios #--------------------------------------------------# script isRect { input _mode = 0; input xab = 0; input xad = 0; input abc = 0; input bcd = 0; input d = 0; input c = 0; def _xab = xab >= .318 and xab <= .618 ; def _abc = abc >= 0.88 and abc <= 1.12; def _bcd = bcd >= 0.88 and bcd <= 1.12; def _xad = xad >= 0.318 and xad <= 0.618 ; plot ret = _xab and _abc and _bcd and _xad and (if _mode == 1 then d < c else d > c); } #--------------------------------------------------# #===== Ascending and Descending or "wedge" Harmonic Pattern Function =====# #--------------------------------------------------# script isADsc { input _mode = 0; input xab = 0; input xad = 0; input abc = 0; input bcd = 0; input d = 0; input c = 0; def _xab = xab >= .50 and xab <= .786; def _abc = abc >= 0.90 and abc <= 1.1; def _bcd = bcd >= 0.50 and bcd <= .786; def _xad = xad >= .50 and xad <= 100; plot ret = _xab and _abc and _bcd and _xad and (if _mode == 1 then d < c else d > c); } #--------------------------------------------------# #===== ThreeDrives Harmonic Pattern Function =====# #--------------------------------------------------# script is3d { input _mode = 0; input xab = 0; input xad = 0; input abc = 0; input bcd = 0; input d = 0; input c = 0; def _xab = xab >= 1.13 and xab <= 1.618 ; def _abc = abc >= 0.382 and abc <= 0.886; def _bcd = bcd >= 1.13 and bcd <= 1.618; def _xad = xad >= 1.27 and xad <= 1.618 ; plot ret = _xab and _abc and _bcd and _xad and (if _mode == 1 then d < c else d > c); } #--------------------------------------------------# #===== Strong Henry Harmonic Pattern Function =====# #--------------------------------------------------# script isSHen { input _mode = 0; input xab = 0; input xad = 0; input abc = 0; input bcd = 0; input d = 0; input c = 0; def _xab = xab >= 0.128 and xab <= 261.8 ; def _abc = abc >= 0.444 and abc <= 0.618; def _bcd = bcd >= 0.618 and bcd <= .886; def _xad = xad >= .618 and xad <= 1.618 ; plot ret = _xab and _abc and _bcd and _xad and (if _mode == 1 then d < c else d > c); } #--------------------------------------------------# #===== Contracting Triangle Harmonic Pattern Function =====# #--------------------------------------------------# script isContr { input _mode = 0; input tolerance = 0; input xab = 0; input xad = 0; input abc = 0; input bcd = 0; input d = 0; input c = 0; def _xab = xab >= .318 and xab <= .886; def _abc = abc >= .618 and abc <= .886; def _bcd = bcd >= .618 and bcd <= .886 ; def _xad = xad >= .12 and xad <= .886 ; plot ret = _xab and _abc and _bcd and _xad and (if _mode == 1 then d < c else d > c); } #--------------------------------------------------# #===== Crab 1.618 Harmonic Pattern Function =====# #--------------------------------------------------# script isCrab1618 { input _mode = 0; input tolerance = 0; input xab = 0; input xad = 0; input abc = 0; input bcd = 0; input d = 0; input c = 0; def _xab = (xab >= 0.382 - tolerance) and (xab <= 0.382 + tolerance) ; def _abc = ( abc >= 0.382 - tolerance) and (abc <= 0.618 + tolerance); def _bcd = ( bcd >= 2.24 - tolerance) and (bcd <= 3.618 + tolerance); def _xad = ( xad >= 1.618 - tolerance) and (xad <= 1.618 + tolerance) ; plot ret = _xab and _abc and _bcd and _xad and (if _mode == 1 then d < c else d > c); } #--------------------------------------------------# #===== Crab deep Harmonic Pattern Function =====# #--------------------------------------------------# script isCrabd { input _mode = 0; input tolerance = 0; input xab = 0; input xad = 0; input abc = 0; input bcd = 0; input d = 0; input c = 0; def _xab = (xab >= 0.886 - tolerance) and (xab <= 0.886 + tolerance) ; def _abc = ( abc >= 0.382 - tolerance) and (abc <= 0.886 + tolerance); def _bcd = ( bcd >= 2.618 - tolerance) and (bcd <= 3.618 + tolerance); def _xad = ( xad >= 1.618 - tolerance) and (xad <= 1.618 + tolerance) ; plot ret = _xab and _abc and _bcd and _xad and (if _mode == 1 then d < c else d > c); } #--------------------------------------------------# #===== Butterfly 1 Harmonic Pattern Function =====# #--------------------------------------------------# script isBut1 { input _mode = 0; input tolerance = 0; input xab = 0; input xad = 0; input abc = 0; input bcd = 0; input d = 0; input c = 0; def _xab = (xab >= 0.786 - tolerance) and (xab >= 0.786 + tolerance) ; def _abc = (abc >= 0.382 - tolerance) and ( abc <= 0.886 + tolerance); def _bcd = (bcd >= 1.618 - tolerance) and (bcd <= 2.618 + tolerance); def _xad = (xad >= 1.27 - tolerance) and (xad <= 1.618 + tolerance); plot ret = _xab and _abc and _bcd and _xad and (if _mode == 1 then d < c else d > c); } #--------------------------------------------------# #===== Butterfly 1113 Harmonic Pattern Function =====# #--------------------------------------------------# script isBut2 { input _mode = 0; input tolerance = 0; input xab = 0; input xad = 0; input abc = 0; input bcd = 0; input d = 0; input c = 0; def _xab = (xab >= 0.786 - tolerance) and (xab <= 2.00 + tolerance); def _abc = (abc >= .618 - tolerance) and (abc <= 1.00 + tolerance); def _bcd = ( bcd >= 1.218 - tolerance) and (bcd <= 1.218 + tolerance) ; def _xad = (xad >= 1.272 - tolerance) and (xad <= 1.272 + tolerance); plot ret = _xab and _abc and _bcd and _xad and (if _mode == 1 then d < c else d > c); } #--------------------------------------------------# #===== Butterfly alt Harmonic Pattern Function =====# #--------------------------------------------------# script isButalt { input _mode = 0; input tolerance = 0; input xab = 0; input xad = 0; input abc = 0; input bcd = 0; input d = 0; input c = 0; def _xab = (xab >= 0.382 - tolerance) and (xab <= .618 + tolerance) ; def _abc = (abc >= 1.218 - tolerance) and (abc <= 2.618 + tolerance) ; def _bcd = (bcd >= 1.272 - tolerance) and (bcd <= 1.272 + tolerance) ; def _xad = (xad >= .618 - tolerance) and (xad <= .786 + tolerance); plot ret = _xab and _abc and _bcd and _xad and (if _mode == 1 then d < c else d > c); } #-----------------------------------------------# #===== Head And Shoulders Pattern Function =====# #-----------------------------------------------# script isHNS1 { input _mode = 0; input tolerance = 0; input xab = 0; input xad = 0; input abc = 0; input bcd = 0; input d = 0; input c = 0; def _xab = xab >= 1.13 and xab <= 1000; def _abc = abc >= .01 and abc <= 1000; def _bcd = bcd >= .01 and bcd <= .98; def _xad = xad >= .886 and xad <= 1.12; plot ret = _xab and _abc and _bcd and _xad and (if _mode == 1 then d < c else d > c); } #-----------------------------------------------# #===== Head And Shoulders2 Pattern Function =====# ##added bulkowski strength measures aren't working so just educational #-----------------------------------------------# script isHNS3 { input _mode = 0; input tol = 0; input x1 = 0; input x = 0; input a = 0; input b = 0; input c = 0; input d = 0; input tp3u = 0; input tp5u = 0; input istop =0.0; input isbot =0.0; def xxa = between(Round((AbsValue(a - x)/ AbsValue(x - x1)),2),(.218 - tol),(.88 + tol)) ; def xab = between(Round((AbsValue(b - a)/ AbsValue(a - x)),2),(1.18 - tol),(100 + tol)) ; def abc = between(Round((AbsValue(c - b)/ AbsValue(b - a)),2), (.88 - tol),(1.12 + tol)) ; def xd = between(Round((AbsValue(d-x) / AbsValue(x)),2),(.001 - tol),(1.005 +tol)); def bcd = between(Round((AbsValue(d - c) / AbsValue(c - b)),2),(.12 - tol), (.88 + tol)) ; def xad = between(Round((AbsValue(d - a) / AbsValue(a - x)),2),(.88 - tol), (1.12 + tol)) ; def time = (AbsValue(tp5u) / AbsValue(tp3u)); def reslope = linearRegressionSlope(vwap); def high52w = if d then GetValue(close, GetMaxValueOffset(high, 364), 364 - 1) else high52w[1];## def low52w = if d then GetValue(close, GetMinValueOffset(low, 364), 364 - 1) else low52w[1]; def bullhl = if max(a,c)<=high52w and min(x,b)<= low52w then 1 else 0; def bearhl = if max(a,c)>=high52w and min(x,b)>= low52w then 1 else 0; def strength1 = (max(a,c)/absvalue((max(a,c)-b)))>=.19 ; # 20% drop def strength2 = (a && istop && a>b) or( a&&isbot &&a<b); # left shoulder greater then right def strength3 = between(Round((AbsValue(d - c) / AbsValue(b - a)),2),(.0 - tol), (.05 + tol)) or Between(time,(1-tol),(1+tol)) ; # symmetry def strength4 = reslope<0; # downward sloping volume n/a plot strength = strength1 or strength2 or strength3 or strength4 or (if _mode == 1 then d < c else d > c); plot ret = xxa and xab and abc and xd and bcd and xad and (if _mode == 1 then d < c else d > c); } def e_hns3str = yes and isHNS3(-1, tolerance, x1_,x,a,b,c, d, tp3u,tp5u,istop,isbot).strength and isHNS3(-1,tolerance, x1_,x,a,b,c, d, tp3u,tp5u,istop,isbot).strength[1] == 0; def e_hns3 = yes and isHNS3(-1, tolerance, x1_,x,a,b,c, d, tp3u,tp5u,istop,isbot).ret and isHNS3(-1,tolerance, x1_,x,a,b,c, d, tp3u,tp5u,istop,isbot).ret[1] == 0; AddChartBubble(e_hns3[-2] , high, "Bear Head and Shoulders v3"+ if e_hns3str then "Strength : yes" else " Strength: no", Color.RED, yes); def u_hns3 = yes and isHNS3(1,tolerance, x1_,x,a,b,c, d, tp3u,tp5u).ret and isHNS3(1,tolerance, x1_,x,a,b,c, d ,tp3u,tp5u).ret[1] == 0; AddChartBubble(u_hns3[-2] , low, "Bull Head and Shoulders v3 ", Color.GREEN, no); #= ====Gilmore 90% reversal variation with alma Pattern Function =====# #---------------------------------------# script isGilmoreReversal { input _mode = 0; input x = 0; input a = 0; input b = 0; input c = 0; input d = 0; input tol = 0; input tp3u = 0; input tp4u = 0 ; input tp5u = 0; input tp25u = 0 ; def Data = close; def Window = 9; def Sigma = 6; def Offset = 0.85; def nRSI = 6; def m = (Offset * (Window - 1)); def s = Window / Sigma; def SumVectorData = fold y = 0 to Window with WS do WS + Exp(-(Sqr(y - m)) / (2 * Sqr(s))) * GetValue(Data, (Window - 1) - y); def SumVector = fold z = 0 to Window with CW do CW + Exp(-(Sqr(z - m)) / (2 * Sqr(s))); def almav = SumVectorData / SumVector; def NetChgAvg = (almav- almav[1]); def TotChgAvg = (AbsValue(almav- almav[1])); def ChgRatio = if TotChgAvg != 0 then NetChgAvg / TotChgAvg else 0; def RSI = Round(50 * (ChgRatio + 1), 2); def fullk = reference StochasticFull().Fullk; def fullD = reference StochasticFull().FullD; def ratio = (AbsValue(tp25u) / AbsValue(tp4u)); def ratio1 = (AbsValue(d-a) / AbsValue(c-b)); def ratio2 = (AbsValue(tp5u) / AbsValue(tp3u)); def ratio3 = (AbsValue(d-c) / AbsValue(b-x)); def RVentryt = Between(ratio,(1.618-tol),(1.618+tol)) or Between(ratio,(2-tol),(2+tol)) or Between(ratio,(3-tol),(3+tol)); def RVentryp = Between(ratio1,(1.618-tol),(1.618+tol)) or Between(ratio1,(2-tol),(2+tol)) or Between(ratio1,(3-tol),(3+tol)); def cdabl = Between(ratio2,(1-tol),(1+tol))or Between(ratio3,(1-tol),(1+tol)) ;## length & price degree def certainbuy = (RVentryt or RVentryp and cdabl) ; def condi1 = ( certainbuy and RSI <= 5) or (certainbuy and fullk <= 20 ) or (certainbuy and fulld <= 20) ; def condi2 =( certainbuy and RSI>= 94) or (certainbuy and fullk>= 80 ) or (certainbuy and fulld >= 80) ; def condi3 =(certainbuy and RSI >= 94) or (certainbuy[1] and fullk<= 18.5) or (certainbuy[1] and fulld <= 18.5) ; plot ret = condi1 and (if _mode == 1 then d < c else d > c); plot ret1 = condi2 and (if _mode == 1 then d < c else d > c); } # gilmore strength measures need cd=xa or bc=xa in time or price and crosses, such as falsebreak, reverse, inside , outside and double. ################### redefine values for complex Elliot waves ########################### ############################################################################################ def x1 = z_0 + GetValue(z_0, z_0 + 1, 0) + 1; def x2 = z_1 + GetValue(z_0, z_1 + 1, 0) + 1; def x3 = z_2 + GetValue(z_0, z_2 + 1, 0) + 1; def x4 = z_3 + GetValue(z_0, z_3 + 1, 0) + 1; def x5 = z_4 + GetValue(z_0, z_4 + 1, 0) + 1; def x6= z_5 + GetValue(z_0, z_5+ 1, 0) + 1; def x7 = z_6 + GetValue(z_0, z_6 + 1, 0) + 1; def x8 = z_7+ GetValue(z_0, z_7 + 1, 0) + 1; def x9 = z_8+ GetValue(z_0, z_8 + 1, 0) + 1; def x10 = z_9+ GetValue(z_0, z_9 + 1, 0) + 1; #--------------------------------------------------# #=====Elliot Wave 5 Harmonic Pattern Function =====# #--------------------------------------------------# script isEW5 { input _mode = 0; input x1xxa = 0; input x1xab = 0; input abc = 0; input x1xcd = 0; input d = 0; input c = 0; def _x1xxa = x1xxa >= .318 and x1xxa <= .618 ; def _x1xab = x1xab >= 1.00 and x1xab <= 4.236; def _abc = abc >= 0.318 and abc <= 618; def _x1xcd = x1xcd >= 1.00 and x1xcd <= 2.62 ; plot ret = _x1xxa and _x1xab and _abc and _x1xcd and (if _mode == 1 then d < c else d > c); } #--------------------------------------------------# #=====Elliot Wave 4 Harmonic Pattern Function =====# #--------------------------------------------------# script isEW4 { input _mode = 0; input xab = 0; input xabc = 0; input bcd = 0; input d = 0; input c = 0; def _xab = xab >= .318 and xab <= .618 ; def _xabc = xabc >= 1.00 and xabc <= 4.236; def _bcd = bcd >= 0.318 and bcd <= 618; plot ret = _xab and _xabc and _bcd and (if _mode == 1 then d < c else d > c); } #---------------------------------------# #======== EW 5 abc or greater cycle 2 Structure Pattern Function =========# #---------------------------------------# script isEW { input _mode = 0; input tol = 0; input x1 = 0; input x2 = 0; input x3 = 0; input x4 = 0; input x5 = 0; input x6 = 0; input x7 = 0; input x8 = 0; input x9 = 0; def uwcr = Round((AbsValue(x1 - x2) / AbsValue(x3 - x4)),2); def uwbr = Round((AbsValue(x2 - x3) / AbsValue(x3 - x4)),2); def uwar = Round((AbsValue(x3 - x4) / AbsValue(x4 - x9)),2); def uw5r = Round((AbsValue(x4 - x5) / AbsValue(x8 - x9)),2); def uw4r = Round((AbsValue(x5 - x6) / AbsValue(x6 - x7)),2); def uw3r = Round((AbsValue(x6 - x7) / AbsValue(x8 - x9)),2); def uw2r = Round((AbsValue(x7 - x8) / AbsValue(x8 - x9)),2); def _uwcr = Between(uwcr, (.50-tol), (2.618+tol)) ; def _uwbr = Between(uwbr,(.382-tol), (1.236+tol)) and uwar<=(.99) ; def _uw5r = Between(uw5r, (1.14-tol), (4.236+tol)); def _uw4r = Between(uw4r,(.24-tol), (.886+tol)) ; def _uw3r = Between(uw3r, (1.14-tol), (4.23+tol)) ; def _uw2r = Between(uw2r, (.24-tol), (0.854+tol)); plot ret = _uwcr and _uwbr and _uw5r and _uw4r and _uw3r and _uw2r and (if _mode == 1 then x1 < x2 else x1> x2); } #---------------------------------------# #======== EW 5 wave 4 correction is abc Structure Pattern Function =========# #---------------------------------------# script isEW4abc { input _mode = 0; input tol = 0; input x1 = 0; input x2 = 0; input x3 = 0; input x4 = 0; input x5 = 0; input x6 = 0; input x7 = 0; input x8 = 0; input x9 = 0; def we45 = Round((AbsValue(x1 - x2) / AbsValue(x7 - x8)),2); def we4c = Round((AbsValue(x2 - x3) / AbsValue(x4 - x5)),2); def we4b = Round((AbsValue(x3 - x4) / AbsValue(x4 - x5)),2); def we44 = Round((AbsValue(x2 - x5) / AbsValue(x5 - x6)),2); def we43 = Round((AbsValue(x5 - x6) / AbsValue(x7 - x8)),2); def we42 = Round((AbsValue(x6 - x7) / AbsValue(x7 - x8)),2); def _we45 =Between(we45, (1-tol), (4.236+tol)) ; def _we4c = Between(we4c,(.50-tol), (2.618+tol)); def _we4b = Between(we4b, (.382-tol), (1.236+tol)); def _we44 = Between( we44,(.24-tol), (.886+tol)) ; def _we43= Between(we43, (1.14-tol), (4.23+tol)) ; def _we42 = Between(we42, (.24-tol), (0.854+tol));; plot ret = _we45 and _we4c and _we4b and _we44 and _we43 and _we42 and (if _mode == 1 then x1 < x2 else x1> x2); } #---------------------------------------# #======== EW 5 wave 3 is extension Structure Pattern Function =========# #---------------------------------------# script isEW5ext3 { input _mode = 0; input tol = 0; input x1 = 0; input x2 = 0; input x3 = 0; input x4 = 0; input x5 = 0; input x6 = 0; input x7 = 0; input x8 = 0; input x9 = 0; input x10 = 0; def w5er = Round((AbsValue(x1 - x2) / AbsValue(x9 - x10)),2); def w4er = Round((AbsValue(x2 - x3) / AbsValue(x3 - x8)),2); def w3er = Round((AbsValue(x3 - x8) / AbsValue(x9 - x10)),2); def w35er = Round((AbsValue(x3 - x4) / AbsValue(x7 - x8)),2); def w34er = Round((AbsValue(x4 - x5) / AbsValue(x5 - x6)),2); def w33er = Round((AbsValue(x5 - x6) / AbsValue(x7 - x8)),2); def w32er = Round((AbsValue(x6 - x7) / AbsValue(x7 - x8)),2); def w2er = Round((AbsValue(x8 - x9) / AbsValue(x9 - x10)),2); def _w5er =Between(w5er, (1-tol), (4.236+tol)) ; def _w4er= Between( w4er,(.24-tol), (.886+tol)); def _w3er = Between(w3er, (1.14-tol), (4.236+tol)); def _w35er = Between(w35er,(1-tol), (4.236+tol)); def _w34er= Between(w34er, (.24-tol), (.854+tol)); def _w33er = Between(w33er, (1.14-tol), (4.236+tol)); def _w32er = Between(w32er, (.24-tol), (.618+tol)); def _w2er =Between(w2er , (.24-tol), (0.854+tol)); plot ret = _w5er and _w4er and _w3er and _w35er and _w34er and _w33er and _w32er and _w2er and (if _mode == 1 then x1 < x2 else x1> x2); } #bears def u_abcd1 = showPatterns and isABCD(-1, abc, bcd, d, c) and isABCD(-1, abc, bcd, d, c)[1] == 0; AddChartBubble(u_abcd1[-2] , high, "Bear ABCD", Color.RED, yes); def u_bat1 = showPatterns and isBat(-1, xab, xad, abc, bcd, d, c) and isBat(-1, xab, xad, abc, bcd, d, c)[1] == 0; AddChartBubble(u_bat1[-2] , high, "Bear Bat",Color.rED, yes); def u_abat1 = showPatterns and isAltBat(-1, xab, xad, abc, bcd, d, c) and isAltBat(-1, xab, xad, abc, bcd, d, c)[1] == 0; AddChartBubble(u_abat1[-2] , high, "Bear Alt Bat", Color.RED, yes); def u_bfly1 = showPatterns and isButterfly(-1, xab, xad, abc, bcd, d, c) and isButterfly(-1, xab, xad, abc, bcd, d, c)[1] == 0; AddChartBubble(u_bfly1[-2] , high, "Bear Butterfly", Color.RED, yes); def u_gley1 = showPatterns and isGartley(-1, xab, xad, abc, bcd, d, c) and isGartley(-1, xab, xad, abc, bcd, d, c)[1] == 0; AddChartBubble(u_gley1[-2] , high, "Bear Gartley", Color.RED, yes); def u_crb1 = showPatterns and isCrab(-1, xab, xad, abc, bcd, d, c) and isCrab(-1, xab, xad, abc, bcd, d, c)[1] == 0; AddChartBubble(u_crb1[-2] , high, "Bear Crab", Color.RED, yes); def u_shrk1 = showPatterns and isShark(-1, xab, xad, abc, bcd, d, c) and isShark(-1, xab, xad, abc, bcd, d, c)[1] == 0; AddChartBubble(u_shrk1[-2] , high, "Bear Shark",Color.RED, yes); def u_5o1 = showPatterns and is5o(-1, xab, xad, abc, bcd, d, c) and is5o(-1, xab, xad, abc, bcd, d, c)[1] == 0; AddChartBubble(u_5o1[-2] , high, "Bear 5-O", Color.RED, yes); def u_wlf1 = showPatterns and isWolf(-1, xab, xad, abc, bcd, d, c) and isWolf(-1, xab, xad, abc, bcd, d, c)[1] == 0; AddChartBubble(u_wlf1[-2] , high, "Bear Wolf Wave",Color.RED, yes); def u_hns1 = showPatterns and isHns(-1, xab, xad, abc, bcd, d, c) and isHns(-1, xab, xad, abc, bcd, d, c)[1] == 0; AddChartBubble(u_hns1[-2] , high, "Bear Head and Shoulders",Color.RED, yes); def u_ctr1 = showPatterns and isConTria(-1, xab, xad, abc, bcd, d, c) and isConTria(-1, xab, xad, abc, bcd, d, c)[1] == 0; AddChartBubble(u_ctr1[-2] , high, "Bear Contracting Triangle",Color.RED, yes); def u_exp1 = showPatterns and isExpTria(-1, xab, xad, abc, bcd, d, c) and isExpTria(-1, xab, xad, abc, bcd, d, c)[1] == 0; AddChartBubble(u_exp1[-2] , high, "Bear Expanding Triangle",Color.RED, yes); ###MCDONS Additions def u_abcdr1 = showPatterns and isABCDR(-1, abc, bcd, d, c) and isABCDR(-1, abc, bcd, d, c)[1] == 0; AddChartBubble(u_abcdr1[-2] , high, "Bear Reciprocal",Color.RED, yes); def u_gf1 = showPatterns and isGfly(-1, xab, xad, abc, bcd, d, c) and isGfly(-1, xab, xad, abc, bcd, d, c)[1] == 0; AddChartBubble(u_gf1[-2] , high, "Bear 121",Color.RED, yes); def u_oto1 = showPatterns and isOTO (-1, xab, xad, abc, bcd, d, c) and isOTO(-1, xab, xad, abc, bcd, d, c)[1] == 0; AddChartBubble(u_oto1[-2] , high, "Bear 121",Color.RED, yes); def u_bs1 = showPatterns and isBS (-1, xab, xad, abc, bcd, d, c) and isBS(-1, xab, xad, abc, bcd, d, c)[1] == 0; AddChartBubble(u_bs1[-2] , high, "Bear BlackSwan",Color.RED, yes); def u_rect1 = showPatterns and isRect (-1, xab, xad, abc, bcd, d, c) and isRect (-1, xab, xad, abc, bcd, d, c)[1] == 0; AddChartBubble(u_rect1[-2] , high, "Bear Rectangle", Color.RED, yes); def u_ad1 = showPatterns and isADsc (-1, xab, xad, abc, bcd, d, c) and isADsc (-1, xab, xad, abc, bcd, d, c)[1] == 0; AddChartBubble(u_ad1[-2] , high, "Bear AscDsc Triangle",Color.RED, yes); def u_3d1 = showPatterns and is3d (-1, xab, xad, abc, bcd, d, c) and is3d (-1, xab, xad, abc, bcd, d, c)[1] == 0; AddChartBubble(u_3d1[-2] , high, "Bear Three drives", Color.RED, yes); def u_sh1 = showPatterns and isSHen (-1, xab, xad, abc, bcd, d, c) and isSHen (-1, xab, xad, abc, bcd, d, c)[1] == 0; AddChartBubble(u_sh1[-2] , high, "Bear Strong Henry",Color.RED, yes); def u_con1 = showPatterns and isContr(-1, xab, xad, abc, bcd, d, c) and isContr(-1, xab, xad, abc, bcd, d, c)[1] == 0; AddChartBubble(u_con1[-2] , high, "Bear Contracting Tri", Color.RED, yes); def u_crabd1 = showPatterns and isCrabd(-1, tolerance, xab, xad, abc, bcd, d, c) and isCrabd(-1, tolerance, xab, xad, abc, bcd, d, c)[1] == 0; AddChartBubble(u_crabd1[-2] , high, "Bear Crab Deep", Color.RED, yes); def u_crab16181 = showPatterns and isCrab1618(-1, tolerance, xab, xad, abc, bcd, d, c) and isCrab1618(-1, tolerance, xab, xad, abc, bcd, d, c)[1] == 0; AddChartBubble(u_crab16181[-2] , high, "Bear Crab 1.618", Color.RED, yes); def u_but1 = showPatterns and isBut1(-1, tolerance, xab, xad, abc, bcd, d, c) and isBut1(-1, tolerance, xab, xad, abc, bcd, d, c)[1] == 0; AddChartBubble(u_but1[-2] , high, "Bear Butterfly",Color.RED, yes); def u_but21 = showPatterns and isBut2(-1, tolerance, xab, xad, abc, bcd, d, c) and isBut2(-1, tolerance, xab, xad, abc, bcd, d, c)[1] == 0; AddChartBubble(u_but21[-2] , high, "Bear Butterfly 113",Color.RED, yes); def u_hns11 = showPatterns and isHNS1(-1, xab, xad, abc, bcd, d, c) and isHNS1(-1, xab, xad, abc, bcd, d, c)[1] == 0; AddChartBubble(u_hns11[-2] , high, "Bear Head and Shoulders",Color.RED, yes); def u_isSymm1 = showPatterns and isSymm(-1, xab, xad, abc, bcd, xabbxd, dcxab, xababc, d, c) and isSymm(-1, xab, xad, abc, bcd, xabbxd, dcxab, xababc, d, c)[1] == 0; AddChartBubble(u_isSymm1[-2] , high, "bear Symmetry",Color.RED, yes); def u_isCyph1 = showPatterns and isCyph(-1, xab, xad, abc, bcd, d, c) and isCyph(-1, xab, xad, abc, bcd, d, c)[1] == 0; AddChartBubble(u_isCyph1[-2] , high, "bear Cypher", Color.RED, yes); def e_isGilmoreReversal = showgilmore and isGilmoreReversal (-1, x, a, b, c, d,tolerance, tp3u,tp4u,tp5u,tp25u).ret1 and isGilmoreReversal (-1, x, a, b, c, d,tolerance, tp3u,tp4u,tp5u,tp25u).ret1[1] == 0; AddChartBubble(e_isGilmoreReversal[-2] , high, " bear isGilmoreReversal ", Color.RED, yes); def u_ew51 = showPatterns and isEW5(-1, x1xxa, x1xab , abc, x1xcd, d, c) and isEW5 (-1, x1xxa, x1xab , abc, x1xcd, d, c)[1] == 0; AddChartBubble(u_ew51[-2] , high, "Bear Elliot Wave 5", Color.RED, yes); def u_ew1 = showPatterns and isEW4(-1, xab, xabc, bcd, d, c) and isEW4 (-1, xab, xabc, bcd, d, c)[1] == 0; AddChartBubble(u_ew1[-2] , high, "Bear Elliot Wave 4", Color.RED, yes); def u_isEW1 = showgilmore and isEW(-1,tolerance,x1,x2,x3,x4,x5,x6,x7,x8,x9) and isEW(-1,tolerance,x1,x2,x3,x4,x5,x6,x7,x8,x9)[1] == 0; AddChartBubble(u_isEW1[-2],high, "bear Elliot 5 abc ", Color.red, no); def u_isEW4abc1 = showgilmore and isEW4abc(-1,tolerance,x1,x2,x3,x4,x5,x6,x7,x8,x9) and isEW4abc(-1,tolerance,x1,x2,x3,x4,x5,x6,x7,x8,x9)[1] == 0; AddChartBubble(u_isEW4abc1[-2] ,high, "bear Elliot 5 wv4= abc ", Color.red, no); def u_isEW5ext31 = showgilmore and isEW5ext3(-1,tolerance,x1,x2,x3,x4,x5,x6,x7,x8,x9,x10) and isEW5ext3(-1,tolerance,x1,x2,x3,x4,x5,x6,x7,x8,x9,x10)[1] == 0; AddChartBubble(u_isEW5ext31[-2] ,high, "bear Elliot 5 extend wave 3 ", Color.red, no); #bulls def u_abcd2 = showPatterns and isABCD(1, abc, bcd, d, c) and isABCD(1, abc, bcd, d, c)[1] == 0; AddChartBubble(u_abcd2[-2] , low, "Bull ABCD" , Color.GREEN, no); def u_bat2 = showPatterns and isBat(1, xab, xad, abc, bcd, d, c) and isBat(1, xab, xad, abc, bcd, d, c)[1] == 0; AddChartBubble(u_bat2[-2], low , "Bull Bat", Color.GREEN, no); def u_abat2 = showPatterns and isAltBat(1, xab, xad, abc, bcd, d, c) and isAltBat(1, xab, xad, abc, bcd, d, c)[1] == 0; AddChartBubble(u_abat2[-2] , low, "Bull Alt Bat", Color.GREEN, no); def u_bfly2 = showPatterns and isButterfly(1, xab, xad, abc, bcd, d, c) and isButterfly(1, xab, xad, abc, bcd, d, c)[1] == 0; AddChartBubble(u_bfly2[-2] , low, "Bull Butterfly", Color.GREEN, no); def u_gley2 = showPatterns and isGartley(1, xab, xad, abc, bcd, d, c) and isGartley(1, xab, xad, abc, bcd, d, c)[1] == 0; AddChartBubble(u_gley2[-2] , low, "Bull Gartley", Color.GREEN, no); def u_crb2 = showPatterns and isCrab(1, xab, xad, abc, bcd, d, c) and isCrab(1, xab, xad, abc, bcd, d, c)[1] == 0; AddChartBubble(u_crb2[-2] , low, "Bull Crab", Color.GREEN, no); def u_shrk2 = showPatterns and isShark(1, xab, xad, abc, bcd, d, c) and isShark(1, xab, xad, abc, bcd, d, c)[1] == 0; AddChartBubble(u_shrk2[-2] , low, "Bull Shark", Color.GREEN, no); def u_5o2 = showPatterns and is5o(1, xab, xad, abc, bcd, d, c) and is5o(1, xab, xad, abc, bcd, d, c)[1] == 0; AddChartBubble(u_5o2[-2] , low, "Bull 5-O", Color.GREEN, no); def u_wlf2 = showPatterns and isWolf(1, xab, xad, abc, bcd, d, c) and isWolf(1, xab, xad, abc, bcd, d, c)[1] == 0; AddChartBubble(u_wlf2[-2] , low, "Bull Wolf Wave", Color.GREEN, no); def u_hns2 = showPatterns and isHns(1, xab, xad, abc, bcd, d, c) and isHns(1, xab, xad, abc, bcd, d, c)[1] == 0; AddChartBubble(u_hns2[-2] , low, "Bull Head and Shoulders", Color.GREEN, no); def u_ctr2 = showPatterns and isConTria(1, xab, xad, abc, bcd, d, c) and isConTria(1, xab, xad, abc, bcd, d, c)[1] == 0; AddChartBubble(u_ctr2[-2] , low, "Bull Contracting Triangle", Color.GREEN, no); def u_exp2 = showPatterns and isExpTria(1, xab, xad, abc, bcd, d, c) and isExpTria(1, xab, xad, abc, bcd, d, c)[1] == 0; AddChartBubble(u_exp2[-2] , low, "Bull Expanding Triangle", Color.GREEN, no); ###MCDONS Additions def u_abcdr2 = showPatterns and isABCDR(1, abc, bcd, d, c) and isABCDR(1, abc, bcd, d, c)[1] == 0; AddChartBubble(u_abcdr2[-2] , low, "Bull ABCD Reciprocal", Color.GREEN, no); def u_ew52 = showgilmore and isEW5(1, x1xxa, x1xab , abc, x1xcd, d, c) and isEW5(1, x1xxa, x1xab , abc, x1xcd, d, c) [1] == 0; AddChartBubble(u_ew52[-2] , low, "Bull Elliot Wave 5", Color.GREEN, no); def u_ew2 = showgilmore and isEW4(1, xab, xabc, bcd, d, c) and isEW4 (1, xab, xabc, bcd, d, c)[1] == 0; AddChartBubble(u_ew2[-2] , low, "Bull Elliot Wave 4", Color.GREEN, no); def u_gf2 = showPatterns and isGfly(1, xab, xad, abc, bcd, d, c) and isGfly (1, xab, xad, abc, bcd, d, c)[1] == 0; AddChartBubble(u_gf2[-2] , low, "Bull 121", Color.GREEN, no); def u_oto2 = showPatterns and isOTO(1, xab, xad, abc, bcd, d, c) and isOTO (1, xab, xad, abc, bcd, d, c)[1] == 0; AddChartBubble(u_oto2[-2] , low, "Bull 121", Color.GREEN, no); def u_bs2 = showPatterns and isBS(1, xab, xad, abc, bcd, d, c) and isBS (1, xab, xad, abc, bcd, d, c)[1] == 0; AddChartBubble(u_bs2[-2] , low, "Bull BlackSwan", Color.GREEN, no); def u_rect2 = showgilmore and isRect (1, xab, xad, abc, bcd, d, c) and isRect (1, xab, xad, abc, bcd, d, c)[1] == 0; AddChartBubble(u_rect2[-2] , low, "Bull Rectangle", Color.GREEN, no); def u_ad2 = showPatterns and isADsc (1, xab, xad, abc, bcd, d, c) and isADsc (1, xab, xad, abc, bcd, d, c)[1] == 0; AddChartBubble(u_ad2[-2] , low, "Bull AscDsc Triangle", Color.GREEN, no); def u_3d2 = showPatterns and is3d (1, xab, xad, abc, bcd, d, c) and is3d (1, xab, xad, abc, bcd, d, c)[1] == 0; AddChartBubble(u_3d2[-2] , low, "Bull ThreeDrives", Color.GREEN, no); def u_sh2 = showPatterns and isSHen (1, xab, xad, abc, bcd, d, c) and isSHen (1, xab, xad, abc, bcd, d, c)[1] == 0; AddChartBubble(u_sh2[-2] , low, "Bull Strong Henry", Color.GREEN, no); def u_con2 = showPatterns and isContr(1, xab, xad, abc, bcd, d, c) and isContr(1, xab, xad, abc, bcd, d, c)[1] == 0; AddChartBubble(u_con2[-2] , low, "Bull Contracting Try", Color.GREEN, no); def u_crab16182 = showPatterns and isCrab1618(1, tolerance, xab, xad, abc, bcd, d, c) and isCrab1618(1, tolerance, xab, xad, abc, bcd, d, c)[1] == 0; AddChartBubble(u_crab16182[-2] , low, "Bull Crab 1.1618", Color.GREEN, no); def u_crabd2 = showPatterns and isCrabd(1, tolerance, xab, xad, abc, bcd, d, c) and isCrabd(1, tolerance, xab, xad, abc, bcd, d, c)[1] == 0; AddChartBubble(u_crabd2[-2] , low, "Bull Crab Deep", Color.GREEN, no); def u_but2 = showPatterns and isBut1(1, tolerance, xab, xad, abc, bcd, d, c) and isBut1(1, tolerance, xab, xad, abc, bcd, d, c)[1] == 0; AddChartBubble(u_but2[-2] , low, "Bull Butterfly", Color.GREEN, no); def u_but22 = showPatterns and isBut2(1, tolerance, xab, xad, abc, bcd, d, c) and isBut2(1, tolerance, xab, xad, abc, bcd, d, c)[1] == 0; AddChartBubble(u_but22[-2] , low, "Bull Butterfly 113", Color.GREEN, no); def u_hns12 = showPatterns and isHNS1(1, xab, xad, abc, bcd, d, c) and isHNS1(1, xab, xad, abc, bcd, d, c)[1] == 0; AddChartBubble(u_hns12[-2] , low, "Bull Head and Shoulders", Color.GREEN, no); def u_isSymm2 = showPatterns and isSymm(1, xab, xad, abc, bcd, xabbxd, dcxab, xababc, d, c) and isSymm(1, xab, xad, abc, bcd, xabbxd, dcxab, xababc, d, c)[1] == 0; AddChartBubble(u_isSymm2[-2] , low, "bull Symmetry " , Color.GREEN, no); def u_isCyph2 = showPatterns and isCyph(1, xab, xad, abc, bcd, d, c) and isCyph(1, xab, xad, abc, bcd, d, c)[1] == 0; AddChartBubble(u_isCyph2[-2] , low, "bull Cypher" , Color.GREEN, no); def u_isGilmoreReversal = showgilmore and isGilmoreReversal(1, x, a, b, c, d,tolerance, tp3u,tp4u,tp5u,tp25u ) and isGilmoreReversal(1, x, a, b, c, d,tolerance, tp3u,tp4u,tp5u,tp25u)[1] == 0; AddChartBubble(u_isGilmoreReversal[-2] , low, " bull isGilmoreReversal", Color.GREEN, no); def u_isEW4abc2 = showgilmore and isEW4abc(1,tolerance,x1,x2,x3,x4,x5,x6,x7,x8,x9) and isEW4abc(1,tolerance,x1,x2,x3,x4,x5,x6,x7,x8,x9)[1] == 0; AddChartBubble( u_isEW4abc2[-2] , low, "bull Elliot 5 wv4 = abc ", Color.GREEN, no); def u_isEW5ext32 = showgilmore and isEW5ext3(1,tolerance,x1,x2,x3,x4,x5,x6,x7,x8,x9,x10) and isEW5ext3(1,tolerance,x1,x2,x3,x4,x5,x6,x7,x8,x9,x10)[1] == 0; AddChartBubble( u_isEW5ext32[-2] , low, "bull Elliot 5 extend wave 3 ", Color.GREEN, no); #============ End Syracusepro Harmonics and Fractals ============#
Shareable Link
https://tos.mx/DuAPJc
Video Tutorial
Sadly no.This is really excellent. Thank you for sharing with the community. Is there a way to scan for the Bull ABCD?
There are no scans for repainting indicators.
read more: https://usethinkscript.com/threads/answers-to-commonly-asked-questions.6006/#post-149342
Last edited by a moderator:
HiBoth the code and the shared link load fine.
You didn't provide enough information to say where you went astray.
For future reference, here is a tutorial on how to cut & paste a study into the ToS app:
https://usethinkscript.com/threads/how-to-import-existing-thinkscript-code-on-thinkorswim.10/
And here is a tutorial on how to import a shared link:
https://usethinkscript.com/threads/...ed-item-error-in-thinkorswim.5098/#post-57930
Perhaps this will help. Here is a chart with the indicator already loaded on it.
When you import, the following link. It will open a chart with the indicator, and it will put the study into your custom study tab for your future use.
Shared Chart Link: http://tos.mx/0MAHhpU Click here for --> Easiest way to load shared links
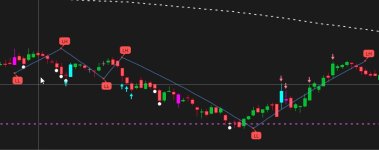
In week time frame can you create scan to find condition of stock that have higher low and higher high and have correction to privies high
See attach photo what I mean ,to scan pullback to previse higher low

Last edited by a moderator:
@samhanoh
Yes. It is a perfect chart. With perfectly defined higher high and higher low.
Provides perfect backtesting.
But sadly no.
Your chart does not exist in real life.
It is a re-written fairy-tale.
All the bad signals are erased. Leaving behind a pretty pretty chart.
Repainted signals appear flawless in hinesight.
Repainted charts are inherently deceptive and unreliable for making profitable trading decisions.
These indicators adjust their plotted lines retrospectively, making past signals look perfect.
Sadly no. You can not get any reliable results from repainting indicators.
The allure of the perfection in historical signals often blinds new traders and easily wipes out portfolios.
read more:
https://usethinkscript.com/threads/answers-to-commonly-asked-questions.6006/#post-57833
These Patterns all work off the Fibonacci and follow specific measurements for the pattern to be true, not sure if the "Zigzag" does the same thing.View attachment 1446@horserider - Thanks for the reply. I am somewhat new on using these patterns. Here is a picture of part of waht I mean. Note the completed pattern is colored in. There are also lines connecting the points to confirm the actual dimensions.
mod note:
The poster is discussing Cypher Patterns
A Cypher pattern is calculated by identifying key points (X, A, B, C, and D) on a price chart, where each point is defined by specific Fibonacci retracement levels applied to the previous leg, essentially creating a pattern where price retraces a certain percentage before extending beyond the original move, ultimately reversing at a predictable point (D) based on Fibonacci ratios; this pattern is considered a harmonic pattern in technical analysis.
No, this is not how ZigZag works.
Here's how ZigZag works:
- Defining Extremes: As price reaches a new high, the ZigZag indicator marks it as the current "highest high."
- Recalibration: If a subsequent candle closes at an even higher level, the prior "highest high" designation is erased and updated to the new level.
- Finalizing Points: Only when price reverses by a pre-determined percentage does the indicator lock in a high or low, leaving behind what appears to be an ideal pivot point.
Last edited by a moderator:
hi everyone, I am looking for Thinkorswim Harmonic SCAN script. Does anyone know it by any chance? Thanks so much!!
Sadly no.
1. the script is too complex for the scan hacker (as well as watchlists and conditional orders)
2. repainters do not provide reliable results in the scans, watchlists, or conditional orders.
https://usethinkscript.com/threads/...gzag-bat-butterfly-abcd.69/page-7#post-149758
https://usethinkscript.com/threads/...gzag-bat-butterfly-abcd.69/page-7#post-149948
Last edited by a moderator:
so is ther way at the V point up or down instead of ploting an arrow to plot the value of the bar at V point@samhanoh
Yes. It is a perfect chart. With perfectly defined higher high and higher low.
Provides perfect backtesting.
But sadly no.
Your chart does not exist in real life.
It is a re-written fairy-tale.
All the bad signals are erased. Leaving behind a pretty pretty chart.
Repainted signals appear flawless in hinesight.
Repainted charts are inherently deceptive and unreliable for making profitable trading decisions.
These indicators adjust their plotted lines retrospectively, making past signals look perfect.
Sadly no. You can not get any reliable results from repainting indicators.
The allure of the perfection in historical signals often blinds new traders and easily wipes out portfolios.
read more:
https://usethinkscript.com/threads/answers-to-commonly-asked-questions.6006/#post-57833
"See attached photo. Currently, the bubble shows LL/HL etc., but I want it to display the closing price of the bar at the V-shaped high or low turning point instead."
Attachments
Last edited by a moderator:
so is ther way at the V point up or down instead of ploting an arrow to plot the value of the bar at V point
Yes, I do believe that there are many zigzags on this forum that plot the value at the high and low points.
You will need to go through these to find which ones:
https://usethinkscript.com/search/1910955/?q=zig*&t=post&c[title_only]=1&o=replies&g=1
Here is an example of values being plotted at high low points:
https://usethinkscript.com/threads/difference-between-two-zigzag-high-pivot-points.8460/
Has anyone found an optimal time frame to use this indicator?This is a multi-harmonic patterns indicator for ThinkorSwim that is consists of 12 different type of patterns including Wolf Wave, Zig Zag, Butterfly, Crab, Elliot Wave, Gartley, and many more.
All of these harmonic and fractals patterns are identified automatically for you. Once the pattern is detected, it will be drawn and labeled right on your chart.
These bearish and bullish patterns can be used to find potential long or short reversal trade ideas.
View attachment 4332
thinkScript Code
Code:# HarmonicsAndFractals_v03_Mcdon # name by JQ #hint select either showpatterns or gilmores to declutter. #----------------------------------------------------------------# #============== Syracusepro Harmonics and Fractals ==============# #----------------------------------------------------------------# #===== This program was made with the intention of educational # #===== purposes. It contains fractal and harmonic patterns. # #===== On the zigzags, the Fibonacci sequence numbers are also # #===== included, and shows what makes each patterns valid with # #===== their correct names. # #=========== I hope people interested can make a great program # #=========== out of this material. Thanks. ======================# #----------------------------------------------------------------# #---------------- Total of 12 Harmonic Patterns -----------------# #================= Http://www.thinkscriptcode.com ===============# #---------------------------------------# #===== Irregular fractals function =====# #---------------------------------------# ###### ###### mcdon030 addded tolerance per Larry Pesavento and 19 more patterns ###### mcdon030 7 more patterns, elliot waves, head and shoulders and bg 90% reversal ###### notes: DUST ETF daily confluence wave4 and hns script isRegularFractal { input mode = 0; plot ret = if mode == 1 then high[4] < high[3] and high[3] < high[2] and high[2] > high[1] and high[1] > high[0] else if mode == -1 then low[4] > low[3] and low[3] > low[2] and low[2] < low[1] and low[1] < low[0] else 0; } #---------------------------------------# #===== BWilliams fractals function =====# #---------------------------------------# script isBWFractal { input mode = 0; plot ret = if mode == 1 then high[4] < high[2] and high[3] <= high[2] and high[2] >= high[1] and high[2] > high[0] else if mode == -1 then low[4] > low[2] and low[3] >= low[2] and low[2] <= low[1] and low[2] < low[0] else 0; } input showgilmore = Yes; input showPatterns = Yes; input showBarColors = No; input filterBW = No; input ShowHHLL = No; input ShowTimeFractals1 = No; input showArrows = No; input tolerance = .06; input timeframe1 = {MIN, TWO_MIN, THREE_MIN, FOUR_MIN, FIVE_MIN, TEN_MIN, FIFTEEN_MIN, TWENTY_MIN, THIRTY_MIN, HOUR, TWO_HOURS, FOUR_HOURS, default DAY, TWO_DAYS, THREE_DAYS, FOUR_DAYS, WEEK, MONTH, OPT_EXP}; input showchannel1 = No; input showchannel2 = No; input showchannel3 = No; input showZigZag = Yes; def bn = BarNumber(); def h2 = high[2]; def l2 = low[2]; def filteredtopf = if filterBW then isRegularFractal(1) else isBWFractal(1); def filteredbotf = if filterBW then isRegularFractal(-1) else isBWFractal(-1); plot TopFractals = filteredtopf[-2]; plot BottomFractals = filteredbotf[-2]; TopFractals.SetPaintingStrategy(PaintingStrategy.BOOLEAN_WEDGE_DOWN); TopFractals.SetDefaultColor(Color.RED); BottomFractals.SetPaintingStrategy(PaintingStrategy.BOOLEAN_WEDGE_UP); BottomFractals.SetDefaultColor(Color.GREEN ); def b1_0 = if bn == 0 then -1 else if filteredtopf == 0 then 0 else if b1_0[1] > -1 then b1_0[1] + 1 else -1; def b1_1 = b1_0 + GetValue(b1_0, b1_0 + 1, 0) + 1; def b1_2 = b1_1 + GetValue(b1_0, b1_1 + 1, 0) + 1; def b2_0 = if bn == 0 then -1 else if filteredbotf == 0 then 0 else if b2_0[1] > -1 then b2_0[1] + 1 else -1; def b2_1 = b2_0 + GetValue(b2_0, b2_0 + 1, 0) + 1; def b2_2 = b2_1 + GetValue(b2_0, b1_1 + 1, 0) + 1; def higherhigh = if filteredtopf == 0 or b1_2 == b1_1 then 0 else GetValue(high[2], b1_1, 0) < GetValue(high[2], b1_0, 0) and GetValue(high[2], b1_2, 0) < GetValue(high[2], b1_0, 0); def lowerhigh = if filteredtopf == 0 or b1_2 == b1_1 then 0 else GetValue(high[2], b1_1, 0) > GetValue(high[2], b1_0, 0) and GetValue(high[2], b1_2, 0) > GetValue(high[2], b1_0, 0); def higherlow = if filteredbotf == 0 or b2_2 == b2_1 then 0 else GetValue(low[2], b2_1, 0) < GetValue(low[2], b2_0, 0) and GetValue(low[2], b2_2, 0) < GetValue(low[2], b2_0, 0); def lowerlow = if filteredbotf == 0 or b2_2 == b2_1 then 0 else GetValue(low[2], b2_1, 0) > GetValue(low[2], b2_0, 0) and GetValue(low[2], b2_2, 0) > GetValue(low[2], b2_0, 0); AddChartBubble(ShowHHLL and higherhigh, high[-2], "[HH]", Color.CYAN, yes); AddChartBubble(ShowHHLL and lowerhigh, high[-2], "[LH]", Color.CYAN, yes); AddChartBubble(ShowHHLL and higherlow, low[-2], "[HL]", Color.GREEN); AddChartBubble(ShowHHLL and lowerlow, low[-2], "[LL]", Color.GREEN); def hh = if bn == 0 then -1 else if higherhigh == 1 then 0 else if hh[1] > -1 then hh[1] + 1 else -1; def ll = if bn == 0 then -1 else if lowerlow == 1 then 0 else if ll[1] > -1 then ll[1] + 1 else -1; def higherhhigh = if higherhigh == 0 or hh == -1 then 0 else GetValue(high[2], hh, 0) >= high(period = timeframe1) ; def lowerllow = if lowerlow == 0 or ll == -1 then 0 else GetValue(low[2], ll, 0) <= low(period = timeframe1); AddChartBubble(ShowTimeFractals1 and higherhhigh , high[-2], "[TL]", Color.GREEN, yes); AddChartBubble(ShowTimeFractals1 and lowerllow, low[-2], "[TL]", Color.GREEN); plot TopChannel1 = if showchannel1 and filteredtopf then h2[-2] else Double.NaN; plot BottomChannel1 = if showchannel1 and filteredbotf then l2[-2] else Double.NaN; TopChannel1.SetDefaultColor(Color.GREEN); BottomChannel1.SetDefaultColor(Color.RED); TopChannel1.EnableApproximation(); BottomChannel1.EnableApproximation(); plot TopChannel2 = if showchannel2 and higherhigh then h2[-2] else Double.NaN; plot BottomChannel2 = if showchannel2 and lowerlow then l2[-2] else Double.NaN; TopChannel2.SetDefaultColor(Color.BLUE); BottomChannel2.SetDefaultColor(Color.BLUE); TopChannel2.EnableApproximation(); BottomChannel2.EnableApproximation(); plot TopChannel3 = if showchannel3 and higherhhigh then h2[-2] else Double.NaN; plot BottomChannel3 = if showchannel3 and lowerllow then l2[-2] else Double.NaN; TopChannel3.SetDefaultColor(Color.VIOLET); BottomChannel3.SetDefaultColor(Color.VIOLET); TopChannel3.EnableApproximation(); BottomChannel3.EnableApproximation(); AddCloud(TopChannel3, BottomChannel3, Color.GREEN, Color.RED); def istop = if ShowTimeFractals1 then (if higherhhigh then 1 else 0) else (if filteredtopf then 1 else 0); def isbot = if ShowTimeFractals1 then (if lowerllow then 1 else 0) else (if filteredbotf then 1 else 0); def topcount0 = if istop then bn else topcount0[1]; def botcount0 = if isbot then bn else botcount0[1]; def topcount = bn - topcount0; def botcount = bn - botcount0; def zigzag = if istop and topcount[1] > botcount[1] then h2 else if isbot and topcount[1] < botcount[1] then l2 else Double.NaN; ##def zigzag = if istop and topcount[1] > botcount[1] && istop>isbot[1] then h2 else if isbot and topcount[1] < botcount[1] && isbot<istop[1] then l2 else Double.NaN; plot zz = if showZigZag then zigzag[-2] else Double.NaN; zz.SetDefaultColor(Color.WHITE); zz.EnableApproximation(); AssignPriceColor(if showBarColors and IsNaN(zigzag) == 0 then (if h2 == zigzag then Color.BLUE else if l2 == zigzag then Color.CYAN else Color.CURRENT) else Color.CURRENT); def z_0 = if bn == 0 then -1 else if IsNaN(zigzag) == 0 then 0 else if z_0[1] > -1 then z_0[1] + 1 else -1; def z_1 = z_0 + GetValue(z_0, z_0 + 1, 0) + 1; def z_2 = z_1 + GetValue(z_0, z_1 + 1, 0) + 1; def z_3 = z_2 + GetValue(z_0, z_2 + 1, 0) + 1; def z_4 = z_3 + GetValue(z_0, z_3 + 1, 0) + 1; def z_5 = z_4 + GetValue(z_0, z_4 + 1, 0) + 1; def z_6= z_5 + GetValue(z_0, z_5+ 1, 0) + 1; def z_7 = z_6 + GetValue(z_0, z_6 + 1, 0) + 1; def z_8 = z_7+ GetValue(z_0, z_7 + 1, 0) + 1; def z_9 = z_8+ GetValue(z_0, z_8 + 1, 0) + 1; #======= Preparing the XABCD Patterns =======# def x1_ = GetValue(zigzag, z_5, 0); #mcdon def x = GetValue(zigzag, z_4, 0); def a = GetValue(zigzag, z_3, 0); def b = GetValue(zigzag, z_2, 0); def c = GetValue(zigzag, z_1, 0); def d = GetValue(zigzag, z_0, 0); #====== Combination to create the patterns ======# def xab = (AbsValue(b - a) / AbsValue(x - a)); def xad = (AbsValue(a - d) / AbsValue(x - a)); def abc = (AbsValue(b - c) / AbsValue(a - b)); def bcd = (AbsValue(c - d) / AbsValue(b - c)); def xabc = (AbsValue(b - c) / AbsValue(x - a)); ################ mcdons additions def x1xcd = (AbsValue(d - c) / AbsValue(x1_ - x));## wave5 def x1xab = (AbsValue(b - a) / AbsValue(x1_ - x));## wave3 def x1xxa = (AbsValue(x - a) / AbsValue(x1_ - x));## wave2 def xabbxd = (AbsValue(bcd ) / AbsValue(xab)); def dcxab = (AbsValue(xab) / AbsValue(bcd )); def xababc = (AbsValue(xab) / AbsValue(abc)); ### time measures def currentBar = HighestAll(if !IsNaN(c) then bn else double.nan); def cp2 = if a then currentBar-bn else cp2[1]; def cp3 = if b then currentBar-bn else cp3[1]; def cp4 = if c then currentBar-bn else cp4[1]; def cp5 = if d then currentBar-bn else cp5[1]; def tp3u =if b then currentBar-cp2 else tp3u[1]; def tp4u = if c then currentBar-cp3 else tp4u[1] ; def tp5u = if d then currentBar-cp4 else tp5u[1] ; def tp25u = if d then currentBar-cp2 else tp25u [1] ; #===== Checking to see if there is a pattern functions =====# #---------------------------------------# #======== Bat Pattern Function =========# #---------------------------------------# script isBat { input _mode = 0; input xab = 0; input xad = 0; input abc = 0; input bcd = 0; input d = 0; input c = 0; def _xab = xab >= 0.382 and xab <= 0.5; def _abc = abc >= 0.382 and abc <= 0.886; def _bcd = bcd >= 1.618 and bcd <= 2.618; def _xad = xad <= 0.886; plot ret = _xab and _abc and _bcd and _xad and (if _mode == 1 then d < c else d > c); } #---------------------------------------# #==== Alternate Bat Pattern Function ===# #---------------------------------------# script isAltBat { input _mode = 0; input xab = 0; input xad = 0; input abc = 0; input bcd = 0; input d = 0; input c = 0; def _xab = xab <= 0.382; def _abc = abc >= 0.382 and abc <= 0.886; def _bcd = bcd >= 2.0 and bcd <= 3.618; def _xad = xad <= 1.13; plot ret = _xab and _abc and _bcd and _xad and (if _mode == 1 then d < c else d > c); } #---------------------------------------# #= ==== Butterfly Pattern Function =====# #---------------------------------------# script isButterfly { input _mode = 0; input xab = 0; input xad = 0; input abc = 0; input bcd = 0; input d = 0; input c = 0; def _xab = xab <= 0.786; def _abc = abc >= 0.382 and abc <= 0.886; def _bcd = bcd >= 1.618 and bcd <= 2.618; def _xad = xad >= 1.27 and xad <= 1.618; plot ret = _xab and _abc and _bcd and _xad and (if _mode == 1 then d < c else d > c); } #---------------------------------------# #======== ABCD Pattern Function ========# #---------------------------------------# script isABCD { input _mode = 0; input abc = 0; input bcd = 0; input d = 0; input c = 0; def _abc = abc >= 0.382 and abc <= 0.886; def _bcd = bcd >= 1.13 and bcd <= 2.618; plot ret = _abc and _bcd and (if _mode == 1 then d < c else d > c); } #---------------------------------------# #====== Gartley Pattern Function =======# #---------------------------------------# script isGartley { input _mode = 0; input xab = 0; input xad = 0; input abc = 0; input bcd = 0; input d = 0; input c = 0; def _xab = xab >= 0.5 and xab <= 0.618; def _abc = abc >= 0.382 and abc <= 0.886; def _bcd = bcd >= 1.13 and bcd <= 2.618; def _xad = xad >= 0.75 and xad <= 0.875; plot ret = _xab and _abc and _bcd and _xad and (if _mode == 1 then d < c else d > c); } #---------------------------------------# #======== Crab Pattern Function ========# #---------------------------------------# script isCrab { input _mode = 0; input xab = 0; input xad = 0; input abc = 0; input bcd = 0; input d = 0; input c = 0; def _xab = xab >= 0.75 and xab <= 0.875; def _abc = abc >= 0.382 and abc <= 0.886; def _bcd = bcd >= 2.0 and bcd <= 3.618; def _xad = xad >= 1.5 and xad <= 1.625; plot ret = _xab and _abc and _bcd and _xad and (if _mode == 1 then d < c else d > c); } #---------------------------------------# #======== Shark Pattern Function =======# #---------------------------------------# script isShark { input _mode = 0; input xab = 0; input xad = 0; input abc = 0; input bcd = 0; input d = 0; input c = 0; def _xab = xab >= 0.5 and xab <= 0.875; def _abc = abc >= 1.13 and abc <= 1.618; def _bcd = bcd >= 1.27 and bcd <= 2.24; def _xad = xad >= 0.88 and xad <= 1.13; plot ret = _xab and _abc and _bcd and _xad and (if _mode == 1 then d < c else d > c); } #---------------------------------------# #========= 5-0 Pattern Function ========# #---------------------------------------# script is5o { input _mode = 0; input xab = 0; input xad = 0; input abc = 0; input bcd = 0; input d = 0; input c = 0; def _xab = xab >= 1.13 and xab <= 1.618; def _abc = abc >= 1.618 and abc <= 2.24; def _bcd = bcd >= 0.5 and bcd <= 0.625; def _xad = xad >= 0.0 and xad <= 0.236; plot ret = _xab and _abc and _bcd and _xad and (if _mode == 1 then d < c else d > c); } #---------------------------------------# #======= Wolfe Pattern Function ========# #---------------------------------------# script isWolf { input _mode = 0; input xab = 0; input xad = 0; input abc = 0; input bcd = 0; input d = 0; input c = 0; def _xab = xab >= 1.27 and xab <= 1.618; def _abc = abc >= 0 and abc <= 5; def _bcd = bcd >= 1.27 and bcd <= 1.618; def _xad = xad >= 0.0 and xad <= 5; plot ret = _xab and _abc and _bcd and _xad and (if _mode == 1 then d < c else d > c); } #-----------------------------------------------# #===== Head And Shoulders Pattern Function =====# #-----------------------------------------------# script isHnS { input _mode = 0; input xab = 0; input xad = 0; input abc = 0; input bcd = 0; input d = 0; input c = 0; def _xab = xab >= 2.0 and xab <= 10; def _abc = abc >= 0.90 and abc <= 1.1; def _bcd = bcd >= 0.236 and bcd <= 0.88; def _xad = xad >= 0.90 and xad <= 1.1; plot ret = _xab and _abc and _bcd and _xad and (if _mode == 1 then d < c else d > c); } #--------------------------------------------------# #===== Con Triangle Harmonic Pattern Function =====# #--------------------------------------------------# script isConTria { input _mode = 0; input xab = 0; input xad = 0; input abc = 0; input bcd = 0; input d = 0; input c = 0; def _xab = xab >= 0.382 and xab <= 0.618; def _abc = abc >= 0.382 and abc <= 0.618; def _bcd = bcd >= 0.382 and bcd <= 0.618; def _xad = xad >= 0.236 and xad <= 0.764; plot ret = _xab and _abc and _bcd and _xad and (if _mode == 1 then d < c else d > c); } #-----------------------------------------# #===== Exp Triangle Pattern Function =====# #-----------------------------------------# script isExpTria { input _mode = 0; input xab = 0; input xad = 0; input abc = 0; input bcd = 0; input d = 0; input c = 0; def _xab = xab >= 1.236 and xab <= 1.618; def _abc = abc >= 1.000 and abc <= 1.618; def _bcd = bcd >= 1.236 and bcd <= 2.000; def _xad = xad >= 2.000 and xad <= 2.236; plot ret = _xab and _abc and _bcd and _xad and (if _mode == 1 then d < c else d > c); } #############################33333333333333 MCDON's Additions ########################## #--------------------------------------------------# #===== Symmetry Harmonic Pattern Function =====# #--------------------------------------------------# script isSymm { input _mode = 0; input xab = 0; input xad = 0; input abc = 0; input bcd = 0; input xabbxd = 0; input dcxab = 0; input xababc = 0; input d = 0; input c = 0; def _xab = xab >= .382 and xab <= 4.236; def _abc = abc >= .1 and abc <= 1000; def _bcd = bcd >= .1 and bcd <= 1000; def _xad = xad >= .1 and xad <= 1000; def _xabbxd = xabbxd >= .50 and xabbxd <= 1.272; def _dcxab = dcxab >= .50 and dcxab <= 1.272; def _xababc = xababc >= .50 and xababc <= 1.272; plot ret = _xab and _abc and _bcd and _xad and _xabbxd and _dcxab and _xababc and (if _mode == 1 then d < c else d > c); } #------------------------------------ -----# #===== Cypher Pattern Function =====# #-----------------------------------------# script isCyph { input _mode = 0; input xab = 0; input xad = 0; input abc = 0; input bcd = 0; input d = 0; input c = 0; def _xab = xab >= .382 and xab <= 0.618; def _abc = abc >= 1.13 and abc <= 1.414; def _bcd = bcd >= 1.272 and bcd <= 2.000; def _xad = xad >= .786 and xad <= .786; plot ret = _xab and _abc and _bcd and _xad and (if _mode == 1 then d < c else d > c); } #--------------------------------------------------# #===== ABCD Reciprocal Harmonic Pattern Function =====# #--------------------------------------------------# script isABCDR { input _mode = 0; input abc = 0; input bcd = 0; input d = 0; input c = 0; def _abc = abc >= 1.13 and abc <= 0.786; def _bcd = bcd >= .382 and bcd <= .886; plot ret = _abc and _bcd and (if _mode == 1 then d < c else d > c); } #--------------------------------------------------# #=====GarFly Harmonic Pattern Function =====# #--------------------------------------------------# script isGfly { input _mode = 0; input xab = 0; input xad = 0; input abc = 0; input bcd = 0; input d = 0; input c = 0; def _xab = xab >= .618 and xab <= 0.618 ; def _abc = abc >= 0.318 and abc <= .886; def _bcd = bcd >= 1.618 and bcd <= 2.24; def _xad = xad >= 1.272 and xad <= 1.272; plot ret = _xab and _abc and _bcd and _xad and (if _mode == 1 then d < c else d > c); } #--------------------------------------------------# #=====One Two One Harmonic Pattern Function =====# #--------------------------------------------------# script isOTO { input _mode = 0; input xab = 0; input xad = 0; input abc = 0; input bcd = 0; input d = 0; input c = 0; def _xab = xab >= .50 and xab <= .786 ; def _abc = abc >= 1.128 and abc <= 3.618; def _bcd = bcd >= .382 and bcd <= .786; def _xad = xad >= .382 and xad <= .786 ; plot ret = _xab and _abc and _bcd and _xad and (if _mode == 1 then d < c else d > c); } #--------------------------------------------------# #=====Black Swan Harmonic Pattern Function =====# #--------------------------------------------------# script isBS { input _mode = 0; input xab = 0; input xad = 0; input abc = 0; input bcd = 0; input d = 0; input c = 0; def _xab = xab >= 1.382 and xab <= 2.618 ; def _abc = abc >= 0.236 and abc <= .50; def _bcd = bcd >= 1.128 and bcd <= 2.00; def _xad = xad >= 1.128 and xad <= 2.618 ; plot ret = _xab and _abc and _bcd and _xad and (if _mode == 1 then d < c else d > c); } #--------------------------------------------------# #=====Rectangle Harmonic Pattern Function =====##### check ratios #--------------------------------------------------# script isRect { input _mode = 0; input xab = 0; input xad = 0; input abc = 0; input bcd = 0; input d = 0; input c = 0; def _xab = xab >= .318 and xab <= .618 ; def _abc = abc >= 0.88 and abc <= 1.12; def _bcd = bcd >= 0.88 and bcd <= 1.12; def _xad = xad >= 0.318 and xad <= 0.618 ; plot ret = _xab and _abc and _bcd and _xad and (if _mode == 1 then d < c else d > c); } #--------------------------------------------------# #===== Ascending and Descending or "wedge" Harmonic Pattern Function =====# #--------------------------------------------------# script isADsc { input _mode = 0; input xab = 0; input xad = 0; input abc = 0; input bcd = 0; input d = 0; input c = 0; def _xab = xab >= .50 and xab <= .786; def _abc = abc >= 0.90 and abc <= 1.1; def _bcd = bcd >= 0.50 and bcd <= .786; def _xad = xad >= .50 and xad <= 100; plot ret = _xab and _abc and _bcd and _xad and (if _mode == 1 then d < c else d > c); } #--------------------------------------------------# #===== ThreeDrives Harmonic Pattern Function =====# #--------------------------------------------------# script is3d { input _mode = 0; input xab = 0; input xad = 0; input abc = 0; input bcd = 0; input d = 0; input c = 0; def _xab = xab >= 1.13 and xab <= 1.618 ; def _abc = abc >= 0.382 and abc <= 0.886; def _bcd = bcd >= 1.13 and bcd <= 1.618; def _xad = xad >= 1.27 and xad <= 1.618 ; plot ret = _xab and _abc and _bcd and _xad and (if _mode == 1 then d < c else d > c); } #--------------------------------------------------# #===== Strong Henry Harmonic Pattern Function =====# #--------------------------------------------------# script isSHen { input _mode = 0; input xab = 0; input xad = 0; input abc = 0; input bcd = 0; input d = 0; input c = 0; def _xab = xab >= 0.128 and xab <= 261.8 ; def _abc = abc >= 0.444 and abc <= 0.618; def _bcd = bcd >= 0.618 and bcd <= .886; def _xad = xad >= .618 and xad <= 1.618 ; plot ret = _xab and _abc and _bcd and _xad and (if _mode == 1 then d < c else d > c); } #--------------------------------------------------# #===== Contracting Triangle Harmonic Pattern Function =====# #--------------------------------------------------# script isContr { input _mode = 0; input tolerance = 0; input xab = 0; input xad = 0; input abc = 0; input bcd = 0; input d = 0; input c = 0; def _xab = xab >= .318 and xab <= .886; def _abc = abc >= .618 and abc <= .886; def _bcd = bcd >= .618 and bcd <= .886 ; def _xad = xad >= .12 and xad <= .886 ; plot ret = _xab and _abc and _bcd and _xad and (if _mode == 1 then d < c else d > c); } #--------------------------------------------------# #===== Crab 1.618 Harmonic Pattern Function =====# #--------------------------------------------------# script isCrab1618 { input _mode = 0; input tolerance = 0; input xab = 0; input xad = 0; input abc = 0; input bcd = 0; input d = 0; input c = 0; def _xab = (xab >= 0.382 - tolerance) and (xab <= 0.382 + tolerance) ; def _abc = ( abc >= 0.382 - tolerance) and (abc <= 0.618 + tolerance); def _bcd = ( bcd >= 2.24 - tolerance) and (bcd <= 3.618 + tolerance); def _xad = ( xad >= 1.618 - tolerance) and (xad <= 1.618 + tolerance) ; plot ret = _xab and _abc and _bcd and _xad and (if _mode == 1 then d < c else d > c); } #--------------------------------------------------# #===== Crab deep Harmonic Pattern Function =====# #--------------------------------------------------# script isCrabd { input _mode = 0; input tolerance = 0; input xab = 0; input xad = 0; input abc = 0; input bcd = 0; input d = 0; input c = 0; def _xab = (xab >= 0.886 - tolerance) and (xab <= 0.886 + tolerance) ; def _abc = ( abc >= 0.382 - tolerance) and (abc <= 0.886 + tolerance); def _bcd = ( bcd >= 2.618 - tolerance) and (bcd <= 3.618 + tolerance); def _xad = ( xad >= 1.618 - tolerance) and (xad <= 1.618 + tolerance) ; plot ret = _xab and _abc and _bcd and _xad and (if _mode == 1 then d < c else d > c); } #--------------------------------------------------# #===== Butterfly 1 Harmonic Pattern Function =====# #--------------------------------------------------# script isBut1 { input _mode = 0; input tolerance = 0; input xab = 0; input xad = 0; input abc = 0; input bcd = 0; input d = 0; input c = 0; def _xab = (xab >= 0.786 - tolerance) and (xab >= 0.786 + tolerance) ; def _abc = (abc >= 0.382 - tolerance) and ( abc <= 0.886 + tolerance); def _bcd = (bcd >= 1.618 - tolerance) and (bcd <= 2.618 + tolerance); def _xad = (xad >= 1.27 - tolerance) and (xad <= 1.618 + tolerance); plot ret = _xab and _abc and _bcd and _xad and (if _mode == 1 then d < c else d > c); } #--------------------------------------------------# #===== Butterfly 1113 Harmonic Pattern Function =====# #--------------------------------------------------# script isBut2 { input _mode = 0; input tolerance = 0; input xab = 0; input xad = 0; input abc = 0; input bcd = 0; input d = 0; input c = 0; def _xab = (xab >= 0.786 - tolerance) and (xab <= 2.00 + tolerance); def _abc = (abc >= .618 - tolerance) and (abc <= 1.00 + tolerance); def _bcd = ( bcd >= 1.218 - tolerance) and (bcd <= 1.218 + tolerance) ; def _xad = (xad >= 1.272 - tolerance) and (xad <= 1.272 + tolerance); plot ret = _xab and _abc and _bcd and _xad and (if _mode == 1 then d < c else d > c); } #--------------------------------------------------# #===== Butterfly alt Harmonic Pattern Function =====# #--------------------------------------------------# script isButalt { input _mode = 0; input tolerance = 0; input xab = 0; input xad = 0; input abc = 0; input bcd = 0; input d = 0; input c = 0; def _xab = (xab >= 0.382 - tolerance) and (xab <= .618 + tolerance) ; def _abc = (abc >= 1.218 - tolerance) and (abc <= 2.618 + tolerance) ; def _bcd = (bcd >= 1.272 - tolerance) and (bcd <= 1.272 + tolerance) ; def _xad = (xad >= .618 - tolerance) and (xad <= .786 + tolerance); plot ret = _xab and _abc and _bcd and _xad and (if _mode == 1 then d < c else d > c); } #-----------------------------------------------# #===== Head And Shoulders Pattern Function =====# #-----------------------------------------------# script isHNS1 { input _mode = 0; input tolerance = 0; input xab = 0; input xad = 0; input abc = 0; input bcd = 0; input d = 0; input c = 0; def _xab = xab >= 1.13 and xab <= 1000; def _abc = abc >= .01 and abc <= 1000; def _bcd = bcd >= .01 and bcd <= .98; def _xad = xad >= .886 and xad <= 1.12; plot ret = _xab and _abc and _bcd and _xad and (if _mode == 1 then d < c else d > c); } #-----------------------------------------------# #===== Head And Shoulders2 Pattern Function =====# ##added bulkowski strength measures aren't working so just educational #-----------------------------------------------# script isHNS3 { input _mode = 0; input tol = 0; input x1 = 0; input x = 0; input a = 0; input b = 0; input c = 0; input d = 0; input tp3u = 0; input tp5u = 0; input istop =0.0; input isbot =0.0; def xxa = between(Round((AbsValue(a - x)/ AbsValue(x - x1)),2),(.218 - tol),(.88 + tol)) ; def xab = between(Round((AbsValue(b - a)/ AbsValue(a - x)),2),(1.18 - tol),(100 + tol)) ; def abc = between(Round((AbsValue(c - b)/ AbsValue(b - a)),2), (.88 - tol),(1.12 + tol)) ; def xd = between(Round((AbsValue(d-x) / AbsValue(x)),2),(.001 - tol),(1.005 +tol)); def bcd = between(Round((AbsValue(d - c) / AbsValue(c - b)),2),(.12 - tol), (.88 + tol)) ; def xad = between(Round((AbsValue(d - a) / AbsValue(a - x)),2),(.88 - tol), (1.12 + tol)) ; def time = (AbsValue(tp5u) / AbsValue(tp3u)); def reslope = linearRegressionSlope(vwap); def high52w = if d then GetValue(close, GetMaxValueOffset(high, 364), 364 - 1) else high52w[1];## def low52w = if d then GetValue(close, GetMinValueOffset(low, 364), 364 - 1) else low52w[1]; def bullhl = if max(a,c)<=high52w and min(x,b)<= low52w then 1 else 0; def bearhl = if max(a,c)>=high52w and min(x,b)>= low52w then 1 else 0; def strength1 = (max(a,c)/absvalue((max(a,c)-b)))>=.19 ; # 20% drop def strength2 = (a && istop && a>b) or( a&&isbot &&a<b); # left shoulder greater then right def strength3 = between(Round((AbsValue(d - c) / AbsValue(b - a)),2),(.0 - tol), (.05 + tol)) or Between(time,(1-tol),(1+tol)) ; # symmetry def strength4 = reslope<0; # downward sloping volume n/a plot strength = strength1 or strength2 or strength3 or strength4 or (if _mode == 1 then d < c else d > c); plot ret = xxa and xab and abc and xd and bcd and xad and (if _mode == 1 then d < c else d > c); } def e_hns3str = yes and isHNS3(-1, tolerance, x1_,x,a,b,c, d, tp3u,tp5u,istop,isbot).strength and isHNS3(-1,tolerance, x1_,x,a,b,c, d, tp3u,tp5u,istop,isbot).strength[1] == 0; def e_hns3 = yes and isHNS3(-1, tolerance, x1_,x,a,b,c, d, tp3u,tp5u,istop,isbot).ret and isHNS3(-1,tolerance, x1_,x,a,b,c, d, tp3u,tp5u,istop,isbot).ret[1] == 0; AddChartBubble(e_hns3[-2] , high, "Bear Head and Shoulders v3"+ if e_hns3str then "Strength : yes" else " Strength: no", Color.RED, yes); def u_hns3 = yes and isHNS3(1,tolerance, x1_,x,a,b,c, d, tp3u,tp5u).ret and isHNS3(1,tolerance, x1_,x,a,b,c, d ,tp3u,tp5u).ret[1] == 0; AddChartBubble(u_hns3[-2] , low, "Bull Head and Shoulders v3 ", Color.GREEN, no); #= ====Gilmore 90% reversal variation with alma Pattern Function =====# #---------------------------------------# script isGilmoreReversal { input _mode = 0; input x = 0; input a = 0; input b = 0; input c = 0; input d = 0; input tol = 0; input tp3u = 0; input tp4u = 0 ; input tp5u = 0; input tp25u = 0 ; def Data = close; def Window = 9; def Sigma = 6; def Offset = 0.85; def nRSI = 6; def m = (Offset * (Window - 1)); def s = Window / Sigma; def SumVectorData = fold y = 0 to Window with WS do WS + Exp(-(Sqr(y - m)) / (2 * Sqr(s))) * GetValue(Data, (Window - 1) - y); def SumVector = fold z = 0 to Window with CW do CW + Exp(-(Sqr(z - m)) / (2 * Sqr(s))); def almav = SumVectorData / SumVector; def NetChgAvg = (almav- almav[1]); def TotChgAvg = (AbsValue(almav- almav[1])); def ChgRatio = if TotChgAvg != 0 then NetChgAvg / TotChgAvg else 0; def RSI = Round(50 * (ChgRatio + 1), 2); def fullk = reference StochasticFull().Fullk; def fullD = reference StochasticFull().FullD; def ratio = (AbsValue(tp25u) / AbsValue(tp4u)); def ratio1 = (AbsValue(d-a) / AbsValue(c-b)); def ratio2 = (AbsValue(tp5u) / AbsValue(tp3u)); def ratio3 = (AbsValue(d-c) / AbsValue(b-x)); def RVentryt = Between(ratio,(1.618-tol),(1.618+tol)) or Between(ratio,(2-tol),(2+tol)) or Between(ratio,(3-tol),(3+tol)); def RVentryp = Between(ratio1,(1.618-tol),(1.618+tol)) or Between(ratio1,(2-tol),(2+tol)) or Between(ratio1,(3-tol),(3+tol)); def cdabl = Between(ratio2,(1-tol),(1+tol))or Between(ratio3,(1-tol),(1+tol)) ;## length & price degree def certainbuy = (RVentryt or RVentryp and cdabl) ; def condi1 = ( certainbuy and RSI <= 5) or (certainbuy and fullk <= 20 ) or (certainbuy and fulld <= 20) ; def condi2 =( certainbuy and RSI>= 94) or (certainbuy and fullk>= 80 ) or (certainbuy and fulld >= 80) ; def condi3 =(certainbuy and RSI >= 94) or (certainbuy[1] and fullk<= 18.5) or (certainbuy[1] and fulld <= 18.5) ; plot ret = condi1 and (if _mode == 1 then d < c else d > c); plot ret1 = condi2 and (if _mode == 1 then d < c else d > c); } # gilmore strength measures need cd=xa or bc=xa in time or price and crosses, such as falsebreak, reverse, inside , outside and double. ################### redefine values for complex Elliot waves ########################### ############################################################################################ def x1 = z_0 + GetValue(z_0, z_0 + 1, 0) + 1; def x2 = z_1 + GetValue(z_0, z_1 + 1, 0) + 1; def x3 = z_2 + GetValue(z_0, z_2 + 1, 0) + 1; def x4 = z_3 + GetValue(z_0, z_3 + 1, 0) + 1; def x5 = z_4 + GetValue(z_0, z_4 + 1, 0) + 1; def x6= z_5 + GetValue(z_0, z_5+ 1, 0) + 1; def x7 = z_6 + GetValue(z_0, z_6 + 1, 0) + 1; def x8 = z_7+ GetValue(z_0, z_7 + 1, 0) + 1; def x9 = z_8+ GetValue(z_0, z_8 + 1, 0) + 1; def x10 = z_9+ GetValue(z_0, z_9 + 1, 0) + 1; #--------------------------------------------------# #=====Elliot Wave 5 Harmonic Pattern Function =====# #--------------------------------------------------# script isEW5 { input _mode = 0; input x1xxa = 0; input x1xab = 0; input abc = 0; input x1xcd = 0; input d = 0; input c = 0; def _x1xxa = x1xxa >= .318 and x1xxa <= .618 ; def _x1xab = x1xab >= 1.00 and x1xab <= 4.236; def _abc = abc >= 0.318 and abc <= 618; def _x1xcd = x1xcd >= 1.00 and x1xcd <= 2.62 ; plot ret = _x1xxa and _x1xab and _abc and _x1xcd and (if _mode == 1 then d < c else d > c); } #--------------------------------------------------# #=====Elliot Wave 4 Harmonic Pattern Function =====# #--------------------------------------------------# script isEW4 { input _mode = 0; input xab = 0; input xabc = 0; input bcd = 0; input d = 0; input c = 0; def _xab = xab >= .318 and xab <= .618 ; def _xabc = xabc >= 1.00 and xabc <= 4.236; def _bcd = bcd >= 0.318 and bcd <= 618; plot ret = _xab and _xabc and _bcd and (if _mode == 1 then d < c else d > c); } #---------------------------------------# #======== EW 5 abc or greater cycle 2 Structure Pattern Function =========# #---------------------------------------# script isEW { input _mode = 0; input tol = 0; input x1 = 0; input x2 = 0; input x3 = 0; input x4 = 0; input x5 = 0; input x6 = 0; input x7 = 0; input x8 = 0; input x9 = 0; def uwcr = Round((AbsValue(x1 - x2) / AbsValue(x3 - x4)),2); def uwbr = Round((AbsValue(x2 - x3) / AbsValue(x3 - x4)),2); def uwar = Round((AbsValue(x3 - x4) / AbsValue(x4 - x9)),2); def uw5r = Round((AbsValue(x4 - x5) / AbsValue(x8 - x9)),2); def uw4r = Round((AbsValue(x5 - x6) / AbsValue(x6 - x7)),2); def uw3r = Round((AbsValue(x6 - x7) / AbsValue(x8 - x9)),2); def uw2r = Round((AbsValue(x7 - x8) / AbsValue(x8 - x9)),2); def _uwcr = Between(uwcr, (.50-tol), (2.618+tol)) ; def _uwbr = Between(uwbr,(.382-tol), (1.236+tol)) and uwar<=(.99) ; def _uw5r = Between(uw5r, (1.14-tol), (4.236+tol)); def _uw4r = Between(uw4r,(.24-tol), (.886+tol)) ; def _uw3r = Between(uw3r, (1.14-tol), (4.23+tol)) ; def _uw2r = Between(uw2r, (.24-tol), (0.854+tol)); plot ret = _uwcr and _uwbr and _uw5r and _uw4r and _uw3r and _uw2r and (if _mode == 1 then x1 < x2 else x1> x2); } #---------------------------------------# #======== EW 5 wave 4 correction is abc Structure Pattern Function =========# #---------------------------------------# script isEW4abc { input _mode = 0; input tol = 0; input x1 = 0; input x2 = 0; input x3 = 0; input x4 = 0; input x5 = 0; input x6 = 0; input x7 = 0; input x8 = 0; input x9 = 0; def we45 = Round((AbsValue(x1 - x2) / AbsValue(x7 - x8)),2); def we4c = Round((AbsValue(x2 - x3) / AbsValue(x4 - x5)),2); def we4b = Round((AbsValue(x3 - x4) / AbsValue(x4 - x5)),2); def we44 = Round((AbsValue(x2 - x5) / AbsValue(x5 - x6)),2); def we43 = Round((AbsValue(x5 - x6) / AbsValue(x7 - x8)),2); def we42 = Round((AbsValue(x6 - x7) / AbsValue(x7 - x8)),2); def _we45 =Between(we45, (1-tol), (4.236+tol)) ; def _we4c = Between(we4c,(.50-tol), (2.618+tol)); def _we4b = Between(we4b, (.382-tol), (1.236+tol)); def _we44 = Between( we44,(.24-tol), (.886+tol)) ; def _we43= Between(we43, (1.14-tol), (4.23+tol)) ; def _we42 = Between(we42, (.24-tol), (0.854+tol));; plot ret = _we45 and _we4c and _we4b and _we44 and _we43 and _we42 and (if _mode == 1 then x1 < x2 else x1> x2); } #---------------------------------------# #======== EW 5 wave 3 is extension Structure Pattern Function =========# #---------------------------------------# script isEW5ext3 { input _mode = 0; input tol = 0; input x1 = 0; input x2 = 0; input x3 = 0; input x4 = 0; input x5 = 0; input x6 = 0; input x7 = 0; input x8 = 0; input x9 = 0; input x10 = 0; def w5er = Round((AbsValue(x1 - x2) / AbsValue(x9 - x10)),2); def w4er = Round((AbsValue(x2 - x3) / AbsValue(x3 - x8)),2); def w3er = Round((AbsValue(x3 - x8) / AbsValue(x9 - x10)),2); def w35er = Round((AbsValue(x3 - x4) / AbsValue(x7 - x8)),2); def w34er = Round((AbsValue(x4 - x5) / AbsValue(x5 - x6)),2); def w33er = Round((AbsValue(x5 - x6) / AbsValue(x7 - x8)),2); def w32er = Round((AbsValue(x6 - x7) / AbsValue(x7 - x8)),2); def w2er = Round((AbsValue(x8 - x9) / AbsValue(x9 - x10)),2); def _w5er =Between(w5er, (1-tol), (4.236+tol)) ; def _w4er= Between( w4er,(.24-tol), (.886+tol)); def _w3er = Between(w3er, (1.14-tol), (4.236+tol)); def _w35er = Between(w35er,(1-tol), (4.236+tol)); def _w34er= Between(w34er, (.24-tol), (.854+tol)); def _w33er = Between(w33er, (1.14-tol), (4.236+tol)); def _w32er = Between(w32er, (.24-tol), (.618+tol)); def _w2er =Between(w2er , (.24-tol), (0.854+tol)); plot ret = _w5er and _w4er and _w3er and _w35er and _w34er and _w33er and _w32er and _w2er and (if _mode == 1 then x1 < x2 else x1> x2); } #bears def u_abcd1 = showPatterns and isABCD(-1, abc, bcd, d, c) and isABCD(-1, abc, bcd, d, c)[1] == 0; AddChartBubble(u_abcd1[-2] , high, "Bear ABCD", Color.RED, yes); def u_bat1 = showPatterns and isBat(-1, xab, xad, abc, bcd, d, c) and isBat(-1, xab, xad, abc, bcd, d, c)[1] == 0; AddChartBubble(u_bat1[-2] , high, "Bear Bat",Color.rED, yes); def u_abat1 = showPatterns and isAltBat(-1, xab, xad, abc, bcd, d, c) and isAltBat(-1, xab, xad, abc, bcd, d, c)[1] == 0; AddChartBubble(u_abat1[-2] , high, "Bear Alt Bat", Color.RED, yes); def u_bfly1 = showPatterns and isButterfly(-1, xab, xad, abc, bcd, d, c) and isButterfly(-1, xab, xad, abc, bcd, d, c)[1] == 0; AddChartBubble(u_bfly1[-2] , high, "Bear Butterfly", Color.RED, yes); def u_gley1 = showPatterns and isGartley(-1, xab, xad, abc, bcd, d, c) and isGartley(-1, xab, xad, abc, bcd, d, c)[1] == 0; AddChartBubble(u_gley1[-2] , high, "Bear Gartley", Color.RED, yes); def u_crb1 = showPatterns and isCrab(-1, xab, xad, abc, bcd, d, c) and isCrab(-1, xab, xad, abc, bcd, d, c)[1] == 0; AddChartBubble(u_crb1[-2] , high, "Bear Crab", Color.RED, yes); def u_shrk1 = showPatterns and isShark(-1, xab, xad, abc, bcd, d, c) and isShark(-1, xab, xad, abc, bcd, d, c)[1] == 0; AddChartBubble(u_shrk1[-2] , high, "Bear Shark",Color.RED, yes); def u_5o1 = showPatterns and is5o(-1, xab, xad, abc, bcd, d, c) and is5o(-1, xab, xad, abc, bcd, d, c)[1] == 0; AddChartBubble(u_5o1[-2] , high, "Bear 5-O", Color.RED, yes); def u_wlf1 = showPatterns and isWolf(-1, xab, xad, abc, bcd, d, c) and isWolf(-1, xab, xad, abc, bcd, d, c)[1] == 0; AddChartBubble(u_wlf1[-2] , high, "Bear Wolf Wave",Color.RED, yes); def u_hns1 = showPatterns and isHns(-1, xab, xad, abc, bcd, d, c) and isHns(-1, xab, xad, abc, bcd, d, c)[1] == 0; AddChartBubble(u_hns1[-2] , high, "Bear Head and Shoulders",Color.RED, yes); def u_ctr1 = showPatterns and isConTria(-1, xab, xad, abc, bcd, d, c) and isConTria(-1, xab, xad, abc, bcd, d, c)[1] == 0; AddChartBubble(u_ctr1[-2] , high, "Bear Contracting Triangle",Color.RED, yes); def u_exp1 = showPatterns and isExpTria(-1, xab, xad, abc, bcd, d, c) and isExpTria(-1, xab, xad, abc, bcd, d, c)[1] == 0; AddChartBubble(u_exp1[-2] , high, "Bear Expanding Triangle",Color.RED, yes); ###MCDONS Additions def u_abcdr1 = showPatterns and isABCDR(-1, abc, bcd, d, c) and isABCDR(-1, abc, bcd, d, c)[1] == 0; AddChartBubble(u_abcdr1[-2] , high, "Bear Reciprocal",Color.RED, yes); def u_gf1 = showPatterns and isGfly(-1, xab, xad, abc, bcd, d, c) and isGfly(-1, xab, xad, abc, bcd, d, c)[1] == 0; AddChartBubble(u_gf1[-2] , high, "Bear 121",Color.RED, yes); def u_oto1 = showPatterns and isOTO (-1, xab, xad, abc, bcd, d, c) and isOTO(-1, xab, xad, abc, bcd, d, c)[1] == 0; AddChartBubble(u_oto1[-2] , high, "Bear 121",Color.RED, yes); def u_bs1 = showPatterns and isBS (-1, xab, xad, abc, bcd, d, c) and isBS(-1, xab, xad, abc, bcd, d, c)[1] == 0; AddChartBubble(u_bs1[-2] , high, "Bear BlackSwan",Color.RED, yes); def u_rect1 = showPatterns and isRect (-1, xab, xad, abc, bcd, d, c) and isRect (-1, xab, xad, abc, bcd, d, c)[1] == 0; AddChartBubble(u_rect1[-2] , high, "Bear Rectangle", Color.RED, yes); def u_ad1 = showPatterns and isADsc (-1, xab, xad, abc, bcd, d, c) and isADsc (-1, xab, xad, abc, bcd, d, c)[1] == 0; AddChartBubble(u_ad1[-2] , high, "Bear AscDsc Triangle",Color.RED, yes); def u_3d1 = showPatterns and is3d (-1, xab, xad, abc, bcd, d, c) and is3d (-1, xab, xad, abc, bcd, d, c)[1] == 0; AddChartBubble(u_3d1[-2] , high, "Bear Three drives", Color.RED, yes); def u_sh1 = showPatterns and isSHen (-1, xab, xad, abc, bcd, d, c) and isSHen (-1, xab, xad, abc, bcd, d, c)[1] == 0; AddChartBubble(u_sh1[-2] , high, "Bear Strong Henry",Color.RED, yes); def u_con1 = showPatterns and isContr(-1, xab, xad, abc, bcd, d, c) and isContr(-1, xab, xad, abc, bcd, d, c)[1] == 0; AddChartBubble(u_con1[-2] , high, "Bear Contracting Tri", Color.RED, yes); def u_crabd1 = showPatterns and isCrabd(-1, tolerance, xab, xad, abc, bcd, d, c) and isCrabd(-1, tolerance, xab, xad, abc, bcd, d, c)[1] == 0; AddChartBubble(u_crabd1[-2] , high, "Bear Crab Deep", Color.RED, yes); def u_crab16181 = showPatterns and isCrab1618(-1, tolerance, xab, xad, abc, bcd, d, c) and isCrab1618(-1, tolerance, xab, xad, abc, bcd, d, c)[1] == 0; AddChartBubble(u_crab16181[-2] , high, "Bear Crab 1.618", Color.RED, yes); def u_but1 = showPatterns and isBut1(-1, tolerance, xab, xad, abc, bcd, d, c) and isBut1(-1, tolerance, xab, xad, abc, bcd, d, c)[1] == 0; AddChartBubble(u_but1[-2] , high, "Bear Butterfly",Color.RED, yes); def u_but21 = showPatterns and isBut2(-1, tolerance, xab, xad, abc, bcd, d, c) and isBut2(-1, tolerance, xab, xad, abc, bcd, d, c)[1] == 0; AddChartBubble(u_but21[-2] , high, "Bear Butterfly 113",Color.RED, yes); def u_hns11 = showPatterns and isHNS1(-1, xab, xad, abc, bcd, d, c) and isHNS1(-1, xab, xad, abc, bcd, d, c)[1] == 0; AddChartBubble(u_hns11[-2] , high, "Bear Head and Shoulders",Color.RED, yes); def u_isSymm1 = showPatterns and isSymm(-1, xab, xad, abc, bcd, xabbxd, dcxab, xababc, d, c) and isSymm(-1, xab, xad, abc, bcd, xabbxd, dcxab, xababc, d, c)[1] == 0; AddChartBubble(u_isSymm1[-2] , high, "bear Symmetry",Color.RED, yes); def u_isCyph1 = showPatterns and isCyph(-1, xab, xad, abc, bcd, d, c) and isCyph(-1, xab, xad, abc, bcd, d, c)[1] == 0; AddChartBubble(u_isCyph1[-2] , high, "bear Cypher", Color.RED, yes); def e_isGilmoreReversal = showgilmore and isGilmoreReversal (-1, x, a, b, c, d,tolerance, tp3u,tp4u,tp5u,tp25u).ret1 and isGilmoreReversal (-1, x, a, b, c, d,tolerance, tp3u,tp4u,tp5u,tp25u).ret1[1] == 0; AddChartBubble(e_isGilmoreReversal[-2] , high, " bear isGilmoreReversal ", Color.RED, yes); def u_ew51 = showPatterns and isEW5(-1, x1xxa, x1xab , abc, x1xcd, d, c) and isEW5 (-1, x1xxa, x1xab , abc, x1xcd, d, c)[1] == 0; AddChartBubble(u_ew51[-2] , high, "Bear Elliot Wave 5", Color.RED, yes); def u_ew1 = showPatterns and isEW4(-1, xab, xabc, bcd, d, c) and isEW4 (-1, xab, xabc, bcd, d, c)[1] == 0; AddChartBubble(u_ew1[-2] , high, "Bear Elliot Wave 4", Color.RED, yes); def u_isEW1 = showgilmore and isEW(-1,tolerance,x1,x2,x3,x4,x5,x6,x7,x8,x9) and isEW(-1,tolerance,x1,x2,x3,x4,x5,x6,x7,x8,x9)[1] == 0; AddChartBubble(u_isEW1[-2],high, "bear Elliot 5 abc ", Color.red, no); def u_isEW4abc1 = showgilmore and isEW4abc(-1,tolerance,x1,x2,x3,x4,x5,x6,x7,x8,x9) and isEW4abc(-1,tolerance,x1,x2,x3,x4,x5,x6,x7,x8,x9)[1] == 0; AddChartBubble(u_isEW4abc1[-2] ,high, "bear Elliot 5 wv4= abc ", Color.red, no); def u_isEW5ext31 = showgilmore and isEW5ext3(-1,tolerance,x1,x2,x3,x4,x5,x6,x7,x8,x9,x10) and isEW5ext3(-1,tolerance,x1,x2,x3,x4,x5,x6,x7,x8,x9,x10)[1] == 0; AddChartBubble(u_isEW5ext31[-2] ,high, "bear Elliot 5 extend wave 3 ", Color.red, no); #bulls def u_abcd2 = showPatterns and isABCD(1, abc, bcd, d, c) and isABCD(1, abc, bcd, d, c)[1] == 0; AddChartBubble(u_abcd2[-2] , low, "Bull ABCD" , Color.GREEN, no); def u_bat2 = showPatterns and isBat(1, xab, xad, abc, bcd, d, c) and isBat(1, xab, xad, abc, bcd, d, c)[1] == 0; AddChartBubble(u_bat2[-2], low , "Bull Bat", Color.GREEN, no); def u_abat2 = showPatterns and isAltBat(1, xab, xad, abc, bcd, d, c) and isAltBat(1, xab, xad, abc, bcd, d, c)[1] == 0; AddChartBubble(u_abat2[-2] , low, "Bull Alt Bat", Color.GREEN, no); def u_bfly2 = showPatterns and isButterfly(1, xab, xad, abc, bcd, d, c) and isButterfly(1, xab, xad, abc, bcd, d, c)[1] == 0; AddChartBubble(u_bfly2[-2] , low, "Bull Butterfly", Color.GREEN, no); def u_gley2 = showPatterns and isGartley(1, xab, xad, abc, bcd, d, c) and isGartley(1, xab, xad, abc, bcd, d, c)[1] == 0; AddChartBubble(u_gley2[-2] , low, "Bull Gartley", Color.GREEN, no); def u_crb2 = showPatterns and isCrab(1, xab, xad, abc, bcd, d, c) and isCrab(1, xab, xad, abc, bcd, d, c)[1] == 0; AddChartBubble(u_crb2[-2] , low, "Bull Crab", Color.GREEN, no); def u_shrk2 = showPatterns and isShark(1, xab, xad, abc, bcd, d, c) and isShark(1, xab, xad, abc, bcd, d, c)[1] == 0; AddChartBubble(u_shrk2[-2] , low, "Bull Shark", Color.GREEN, no); def u_5o2 = showPatterns and is5o(1, xab, xad, abc, bcd, d, c) and is5o(1, xab, xad, abc, bcd, d, c)[1] == 0; AddChartBubble(u_5o2[-2] , low, "Bull 5-O", Color.GREEN, no); def u_wlf2 = showPatterns and isWolf(1, xab, xad, abc, bcd, d, c) and isWolf(1, xab, xad, abc, bcd, d, c)[1] == 0; AddChartBubble(u_wlf2[-2] , low, "Bull Wolf Wave", Color.GREEN, no); def u_hns2 = showPatterns and isHns(1, xab, xad, abc, bcd, d, c) and isHns(1, xab, xad, abc, bcd, d, c)[1] == 0; AddChartBubble(u_hns2[-2] , low, "Bull Head and Shoulders", Color.GREEN, no); def u_ctr2 = showPatterns and isConTria(1, xab, xad, abc, bcd, d, c) and isConTria(1, xab, xad, abc, bcd, d, c)[1] == 0; AddChartBubble(u_ctr2[-2] , low, "Bull Contracting Triangle", Color.GREEN, no); def u_exp2 = showPatterns and isExpTria(1, xab, xad, abc, bcd, d, c) and isExpTria(1, xab, xad, abc, bcd, d, c)[1] == 0; AddChartBubble(u_exp2[-2] , low, "Bull Expanding Triangle", Color.GREEN, no); ###MCDONS Additions def u_abcdr2 = showPatterns and isABCDR(1, abc, bcd, d, c) and isABCDR(1, abc, bcd, d, c)[1] == 0; AddChartBubble(u_abcdr2[-2] , low, "Bull ABCD Reciprocal", Color.GREEN, no); def u_ew52 = showgilmore and isEW5(1, x1xxa, x1xab , abc, x1xcd, d, c) and isEW5(1, x1xxa, x1xab , abc, x1xcd, d, c) [1] == 0; AddChartBubble(u_ew52[-2] , low, "Bull Elliot Wave 5", Color.GREEN, no); def u_ew2 = showgilmore and isEW4(1, xab, xabc, bcd, d, c) and isEW4 (1, xab, xabc, bcd, d, c)[1] == 0; AddChartBubble(u_ew2[-2] , low, "Bull Elliot Wave 4", Color.GREEN, no); def u_gf2 = showPatterns and isGfly(1, xab, xad, abc, bcd, d, c) and isGfly (1, xab, xad, abc, bcd, d, c)[1] == 0; AddChartBubble(u_gf2[-2] , low, "Bull 121", Color.GREEN, no); def u_oto2 = showPatterns and isOTO(1, xab, xad, abc, bcd, d, c) and isOTO (1, xab, xad, abc, bcd, d, c)[1] == 0; AddChartBubble(u_oto2[-2] , low, "Bull 121", Color.GREEN, no); def u_bs2 = showPatterns and isBS(1, xab, xad, abc, bcd, d, c) and isBS (1, xab, xad, abc, bcd, d, c)[1] == 0; AddChartBubble(u_bs2[-2] , low, "Bull BlackSwan", Color.GREEN, no); def u_rect2 = showgilmore and isRect (1, xab, xad, abc, bcd, d, c) and isRect (1, xab, xad, abc, bcd, d, c)[1] == 0; AddChartBubble(u_rect2[-2] , low, "Bull Rectangle", Color.GREEN, no); def u_ad2 = showPatterns and isADsc (1, xab, xad, abc, bcd, d, c) and isADsc (1, xab, xad, abc, bcd, d, c)[1] == 0; AddChartBubble(u_ad2[-2] , low, "Bull AscDsc Triangle", Color.GREEN, no); def u_3d2 = showPatterns and is3d (1, xab, xad, abc, bcd, d, c) and is3d (1, xab, xad, abc, bcd, d, c)[1] == 0; AddChartBubble(u_3d2[-2] , low, "Bull ThreeDrives", Color.GREEN, no); def u_sh2 = showPatterns and isSHen (1, xab, xad, abc, bcd, d, c) and isSHen (1, xab, xad, abc, bcd, d, c)[1] == 0; AddChartBubble(u_sh2[-2] , low, "Bull Strong Henry", Color.GREEN, no); def u_con2 = showPatterns and isContr(1, xab, xad, abc, bcd, d, c) and isContr(1, xab, xad, abc, bcd, d, c)[1] == 0; AddChartBubble(u_con2[-2] , low, "Bull Contracting Try", Color.GREEN, no); def u_crab16182 = showPatterns and isCrab1618(1, tolerance, xab, xad, abc, bcd, d, c) and isCrab1618(1, tolerance, xab, xad, abc, bcd, d, c)[1] == 0; AddChartBubble(u_crab16182[-2] , low, "Bull Crab 1.1618", Color.GREEN, no); def u_crabd2 = showPatterns and isCrabd(1, tolerance, xab, xad, abc, bcd, d, c) and isCrabd(1, tolerance, xab, xad, abc, bcd, d, c)[1] == 0; AddChartBubble(u_crabd2[-2] , low, "Bull Crab Deep", Color.GREEN, no); def u_but2 = showPatterns and isBut1(1, tolerance, xab, xad, abc, bcd, d, c) and isBut1(1, tolerance, xab, xad, abc, bcd, d, c)[1] == 0; AddChartBubble(u_but2[-2] , low, "Bull Butterfly", Color.GREEN, no); def u_but22 = showPatterns and isBut2(1, tolerance, xab, xad, abc, bcd, d, c) and isBut2(1, tolerance, xab, xad, abc, bcd, d, c)[1] == 0; AddChartBubble(u_but22[-2] , low, "Bull Butterfly 113", Color.GREEN, no); def u_hns12 = showPatterns and isHNS1(1, xab, xad, abc, bcd, d, c) and isHNS1(1, xab, xad, abc, bcd, d, c)[1] == 0; AddChartBubble(u_hns12[-2] , low, "Bull Head and Shoulders", Color.GREEN, no); def u_isSymm2 = showPatterns and isSymm(1, xab, xad, abc, bcd, xabbxd, dcxab, xababc, d, c) and isSymm(1, xab, xad, abc, bcd, xabbxd, dcxab, xababc, d, c)[1] == 0; AddChartBubble(u_isSymm2[-2] , low, "bull Symmetry " , Color.GREEN, no); def u_isCyph2 = showPatterns and isCyph(1, xab, xad, abc, bcd, d, c) and isCyph(1, xab, xad, abc, bcd, d, c)[1] == 0; AddChartBubble(u_isCyph2[-2] , low, "bull Cypher" , Color.GREEN, no); def u_isGilmoreReversal = showgilmore and isGilmoreReversal(1, x, a, b, c, d,tolerance, tp3u,tp4u,tp5u,tp25u ) and isGilmoreReversal(1, x, a, b, c, d,tolerance, tp3u,tp4u,tp5u,tp25u)[1] == 0; AddChartBubble(u_isGilmoreReversal[-2] , low, " bull isGilmoreReversal", Color.GREEN, no); def u_isEW4abc2 = showgilmore and isEW4abc(1,tolerance,x1,x2,x3,x4,x5,x6,x7,x8,x9) and isEW4abc(1,tolerance,x1,x2,x3,x4,x5,x6,x7,x8,x9)[1] == 0; AddChartBubble( u_isEW4abc2[-2] , low, "bull Elliot 5 wv4 = abc ", Color.GREEN, no); def u_isEW5ext32 = showgilmore and isEW5ext3(1,tolerance,x1,x2,x3,x4,x5,x6,x7,x8,x9,x10) and isEW5ext3(1,tolerance,x1,x2,x3,x4,x5,x6,x7,x8,x9,x10)[1] == 0; AddChartBubble( u_isEW5ext32[-2] , low, "bull Elliot 5 extend wave 3 ", Color.GREEN, no); #============ End Syracusepro Harmonics and Fractals ============#
Shareable Link
https://tos.mx/DuAPJc
Video Tutorial
Has anyone found an optimal time frame to use this indicator?
Harmonic patterns work on any timeframe—from quick intraday charts to long-term ones—thanks to the fractal nature of price action. Same shapes, different scales.
But here’s what matters:
More Reliable on Higher Timeframes:
Patterns are significant at key levels. And key levels (support/resistance) are more easily drawn/seen on higher aggregations.
Patterns hold up better since there’s less noise and random spikes than on 1-min or 5-min charts.
Use Multi-Timeframe Confirmation: You can still use on your lower timeframe. But check higher ones for backup—it helps confirm reversals or trend continuation. 3-frame analysis is the bedrock of price action.
Watch for Volatility: Fast-moving markets can mess with pattern accuracy, especially on small timeframes. Adjust your strategy and manage risk smartly.
Don’t Ignore Market Context: Always factor in the bigger trend and sentiment. Patterns alone don’t tell the full story.
https://usethinkscript.com/threads/market-review-trend-is-your-friend.20968/
Last edited by a moderator:
Similar threads
-
Automatic patterns studies, Bull, Bear, Bullish only & Bearish only For ThinkOrSwim
- Started by mourningwood4521
- Replies: 8
-
 One Black Crow & One White Soldier Candlestick Patterns for ThinkorSwim
- Started by BenTen
- Replies: 17
-
-
-
Not the exact question you're looking for?
Start a new thread and receive assistance from our community.
87k+
Posts
1834
Online
Similar threads
-
Automatic patterns studies, Bull, Bear, Bullish only & Bearish only For ThinkOrSwim
- Started by mourningwood4521
- Replies: 8
-
One Black Crow & One White Soldier Candlestick Patterns for ThinkorSwim
- Started by BenTen
- Replies: 17
-
-
-
Similar threads
-
Automatic patterns studies, Bull, Bear, Bullish only & Bearish only For ThinkOrSwim
- Started by mourningwood4521
- Replies: 8
-
One Black Crow & One White Soldier Candlestick Patterns for ThinkorSwim
- Started by BenTen
- Replies: 17
-
-
-
The Market Trading Game Changer
Join 2,500+ subscribers inside the useThinkScript VIP Membership Club
- Exclusive indicators
- Proven strategies & setups
- Private Discord community
- ‘Buy The Dip’ signal alerts
- Exclusive members-only content
- Add-ons and resources
- 1 full year of unlimited support
Frequently Asked Questions
What is useThinkScript?
useThinkScript is the #1 community of stock market investors using indicators and other tools to power their trading strategies. Traders of all skill levels use our forums to learn about scripting and indicators, help each other, and discover new ways to gain an edge in the markets.
How do I get started?
We get it. Our forum can be intimidating, if not overwhelming. With thousands of topics, tens of thousands of posts, our community has created an incredibly deep knowledge base for stock traders. No one can ever exhaust every resource provided on our site.
If you are new, or just looking for guidance, here are some helpful links to get you started.
- The most viewed thread:
https://usethinkscript.com/threads/repainting-trend-reversal-for-thinkorswim.183/ - Our most popular indicator:
https://usethinkscript.com/threads/buy-the-dip-indicator-for-thinkorswim.3553/ - Answers to frequently asked questions:
https://usethinkscript.com/threads/answers-to-commonly-asked-questions.6006/
What are the benefits of VIP Membership?
VIP members get exclusive access to these proven and tested premium indicators: Buy the Dip, Advanced Market Moves 2.0, Take Profit, and Volatility Trading Range. In addition, VIP members get access to over 50 VIP-only custom indicators, add-ons, and strategies, private VIP-only forums, private Discord channel to discuss trades and strategies in real-time, customer support, trade alerts, and much more. Learn all about VIP membership here.
How can I access the premium indicators?
To access the premium indicators, which are plug and play ready, sign up for VIP membership here.