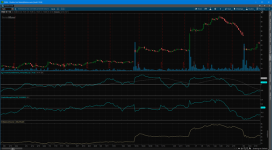
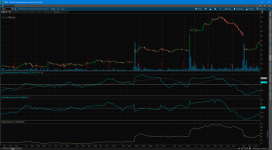
Finite Volume Elements (FVE) for ThinkOrSwim

korygill

Well-known member
VIP
The Finite Volume Elements (FVE) strategy is a money flow indicator that combines trading volume and volatility indicators to gauge market sentiment. The FVE strategy is considered stable and reliable compared to single indicators.

This indicator is the work of Markos Katsanos. I have ported the indicator to thinkorswim.
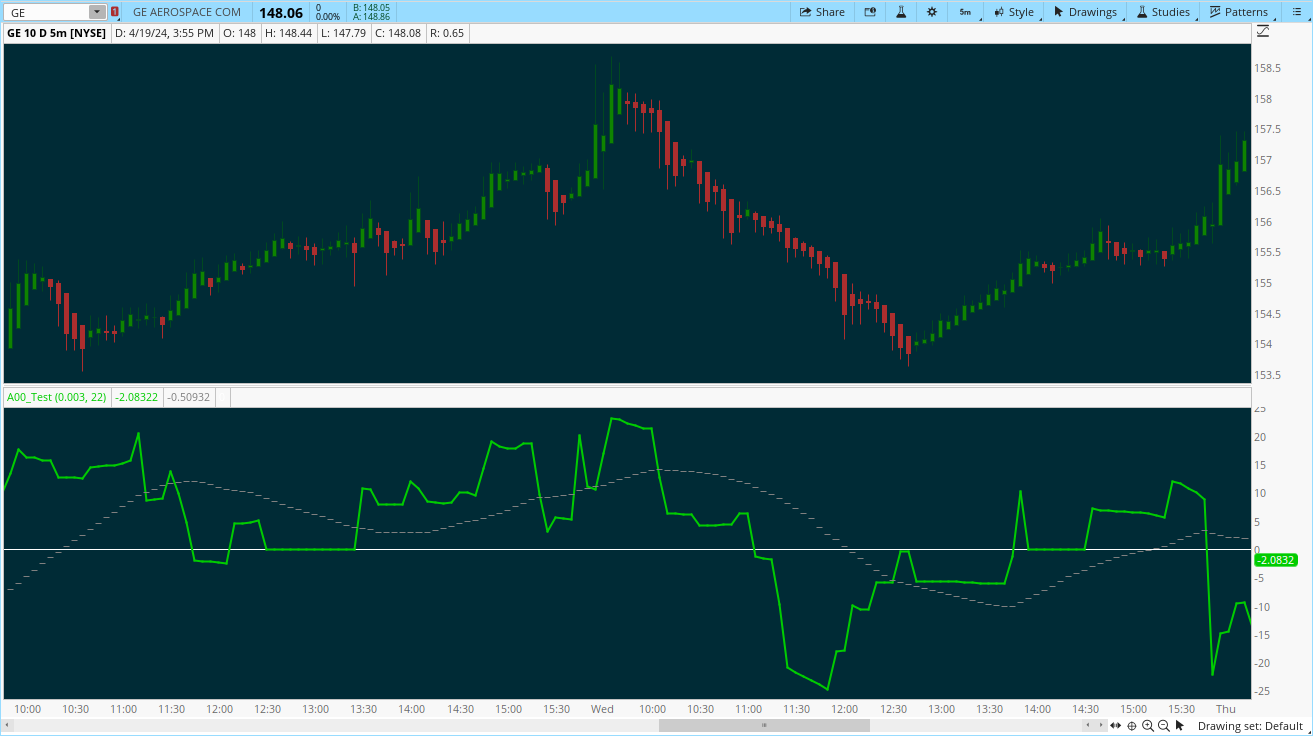
85mjfG4.png


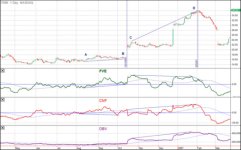
Here is a chart of the indicator from Markos

yZuIL4H.jpg


ThinkScript code for this indicator

Code:
#
# FiniteVolumeElements_FVE
#
# Author: Kory Gill, @korygill
#
# Created from idea on https://usethinkscript.com/threads/finite-volume-elements.593/
# Original idea is from http://mkatsanos.com/FVE.html
#
# VERSION HISTORY (sortable date and time (your local time is fine), and your initials
# 20190907-1200-KG    - Created.
# ...
# ...

declare once_per_bar;
declare lower;

#
# inputs
#
input CutOff = 0.003;
input Samples = 22;

#
# logic
#
def bn = BarNumber();
def nan = double.NaN;

def tp = hlc3;
def mf = (close - (high+low)/2) + tp - tp[1];
def fveFactor = if mf > (CutOff*Close)
                then 1
                else if mf < (-1*CutOff*Close) then -1
                else 0;

def VolumePlusMinus = volume * fveFactor;
def fveSum = Sum(VolumePlusMinus, Samples);
def fve = if bn > Samples
          then (fveSum / (Average(volume,Samples) * Samples)) * 100
          else nan;


#
# plots
#
plot pFVE = fve;

plot pFVE_MA = MovingAverage(AverageType.SIMPLE, fve, 30);
pFVE_MA.SetDefaultColor(Color.Gray);
PFVE_MA.SetPaintingStrategy(PaintingStrategy.DASHES);

plot zeroLine = 0;
zeroLine.SetDefaultColor(Color.White);

Link to a flex grid as shown above

https://tos.mx/PUmEFD

Happy trading,
Kory Gill, @korygill
 

Attachments

  • 9ii07hy.png
    9ii07hy.png
    151.7 KB · Views: 533
  • yZuIL4H.jpg
    yZuIL4H.jpg
    42.7 KB · Views: 254
  • 9ii07hy.png
    9ii07hy.png
    151.7 KB · Views: 264
Last edited by a moderator:
Hello, I have serious doubts about this code.

Why are you not using any measurement of price range in the cutoff?
 
I have been using this indicator for about 6 months. I keep noticing more and more correlations with the movement of stock.

This indicator can be used to signal entry as indicated by the 1st rectangle in the photo below. But my favorite use is to identify chop as shown in the 2nd rectangle.

If both the FVE and OBV (On Balance Volume) are below their moving averages (as signified by the red lines), the stock is either descending or in chop.

I use it to filter every scan I run and every arrow that I draw. It removes a lot of false signals.

Here is my chart:
https://tos.mx/6si5qBI
 
Last edited:
Made it MTF capable and set it to the higher time frame on the lower time frame chart

Code:
#
# FiniteVolumeElements_FVE
#
# Author: Kory Gill, [USER=212]@korygill[/USER]
#
# Created from idea on https://usethinkscript.com/threads/finite-volume-elements.593/
# Original idea is from http://mkatsanos.com/FVE.html
#
# VERSION HISTORY (sortable date and time (your local time is fine), and your initials
# 20190907-1200-KG    - Created.
# ...7/20/2020 Added MTF Capability in order to combat the fact that it does not appear on lower than 2 minute time frames### Ramon Del Villar AKA Pelonsax
# ...

declare lower;
input AGG = aggregationPeriod.FIVE_MIN;
input CutOff = 0.003;
input Samples_Used = 22;
def samples = Samples_Used * (AGG/60000);

def bn = BarNumber();
def nan = double.NaN;

def tp = hlc3(period = AGG);
def mf = (close(period = AGG) - (high(period = AGG)+low(period = AGG))/2) + tp - tp[1];
def fveFactor = if mf > (CutOff*Close(period = AGG))
                then 1
                else if mf < (-1*CutOff*Close(period = AGG)) then -1
                else 0;

def VolumePlusMinus = volume(period = AGG) * fveFactor;
def fveSum = Sum(VolumePlusMinus, Samples);
def fve = if bn > Samples
          then (fveSum / (Average(volume(period = AGG),Samples) * Samples)) * 100
          else nan;

plot pFVE = fve;

plot pFVE_MA = MovingAverage(AverageType.SIMPLE, fve, 30);
pFVE_MA.SetDefaultColor(Color.Gray);
PFVE_MA.SetPaintingStrategy(PaintingStrategy.DASHES);

plot zeroLine = 0;
zeroLine.SetDefaultColor(Color.White);
 
Last edited by a moderator:
I'VE DONE IT!!!!!!!! OMFG I CAN'T BELIEVE I DID IT!!! (Okay, truth is, this is a little over my head, but I think I did it. You be the judge)

Ladies and Gentlemen......

Spike_Dampened_Finite_Volume_Elements (I suppose another way of calling it could be "NORMALIZED_FINITE_VOLUME_ELEMENTS")

I took the logic from Volume Flow Indicator which is a normalized version of On Balance Volume and applied it here. Below are the indicators in question back to back. Previously, I had thought that the only way to show the original FVE study on a one minute chart was to change the aggregation, but as you can see, there is no need to do that with this "Normalized" Version (though it is possible if one were so inclined.

f3LzNWO.png


Here is the code to the dampened indicator:

Code:
# FiniteVolumeElements_FVE
#
# Author: Kory Gill, [USER=212]@korygill[/USER]
#
# Created from idea on https://usethinkscript.com/threads/finite-volume-elements.593/
# Original idea is from http://mkatsanos.com/FVE.html
#
# VERSION HISTORY (sortable date and time (your local time is fine), and your initials
# 20190907-1200-KG    - Created.

###############################################################################
### NORMALIZATION (Volume Damping adaptation) by Ramon Del Villar AKA PElonsax
### 7/20/2020 #################################################################
###############################################################################
# The damping logic is taken directly from VFI #

declare once_per_bar;
declare lower;

#
# inputs
#
input Samples = 22;

#
# logic
#
def bn = BarNumber();
def nan = double.NaN;


input maxVolumeCutOff = 2.5;
###Coefficient used in calculation of “Cut Off” value. Lower values mean stronger damping of volume spikes###

Assert(maxVolumeCutOff > 0, "'max volume cut off' must be positive: " + maxVolumeCutOff);

def cutOff = 0.2 * StDev(Log(hlc3) - Log(hlc3[1]), 30) * close;
def hlcChange = hlc3 - hlc3[1];
def avgVolume = Average(volume, 30)[1];
def minVolume = Min(volume, avgVolume * maxVolumeCutOff);
def dirVolume = if hlcChange > cutOff
    then minVolume
    else if hlcChange < -cutOff
        then -minVolume
        else 0;


def mf = (close - (high+low)/2) + hlc3 - hlc3 [1];
def fveSum = Sum(dirVolume, Samples);

def fve = if bn > Samples
          then (fveSum / (Average(avgVolume, Samples) * Samples)) * 100
          else nan;


#
# plots
#
plot pFVE = fve;

plot pFVE_MA = MovingAverage(AverageType.SIMPLE, fve, 30);
pFVE_MA.SetDefaultColor(Color.Gray);
PFVE_MA.SetPaintingStrategy(PaintingStrategy.DASHES);

plot zeroLine = 0;
zeroLine.SetDefaultColor(Color.White);

Here is a shareable link:

https://tos.mx/asxD578
ENJOY!!
 
@petey150

Code:
# to chg the length of the moving average, change line#17: The "30" represents length
def FVE_MA = MovingAverage(AverageType.SIMPLE, fve, 30);
 

Join useThinkScript to post your question to a community of 21,000+ developers and traders.

Not the exact question you're looking for?

Start a new thread and receive assistance from our community.

87k+ Posts
246 Online
Create Post

The Market Trading Game Changer

Join 2,500+ subscribers inside the useThinkScript VIP Membership Club
  • Exclusive indicators
  • Proven strategies & setups
  • Private Discord community
  • ‘Buy The Dip’ signal alerts
  • Exclusive members-only content
  • Add-ons and resources
  • 1 full year of unlimited support

Frequently Asked Questions

What is useThinkScript?

useThinkScript is the #1 community of stock market investors using indicators and other tools to power their trading strategies. Traders of all skill levels use our forums to learn about scripting and indicators, help each other, and discover new ways to gain an edge in the markets.

How do I get started?

We get it. Our forum can be intimidating, if not overwhelming. With thousands of topics, tens of thousands of posts, our community has created an incredibly deep knowledge base for stock traders. No one can ever exhaust every resource provided on our site.

If you are new, or just looking for guidance, here are some helpful links to get you started.

What are the benefits of VIP Membership?
VIP members get exclusive access to these proven and tested premium indicators: Buy the Dip, Advanced Market Moves 2.0, Take Profit, and Volatility Trading Range. In addition, VIP members get access to over 50 VIP-only custom indicators, add-ons, and strategies, private VIP-only forums, private Discord channel to discuss trades and strategies in real-time, customer support, trade alerts, and much more. Learn all about VIP membership here.
How can I access the premium indicators?
To access the premium indicators, which are plug and play ready, sign up for VIP membership here.
Back
Top