
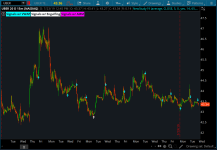
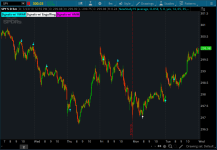
Here is the Enhanced version of the popular Trend Reversal indicator available here for ThinkorSwim.
Before we jump into what's new, I just want to clarify that the new version will continue to repaint. Repainting was the problem with the original Trend Reversal. Though there is no way to fix that issue, we continue to find ways to improve it.
One way to increase the reliability of the signals is to implement additional trend reversal patterns. Included in the Enhanced version are:


The reversal candle (pulled from the original version) must either be an Engulfing candle, below/above VWAP, or matches with the signal given by the Advanced Market Moves.
We assume that if any of the three conditions match up in a single candle, most likely there would be a point of reversal in trend. Of course, since this indicator repaint, it’s impossible to backtest. Hopefully, this Enhanced version will work better since additional conditions have been added.
Shareable Link: https://tos.mx/1we0QW

Feel free to test it out and let me know. I heard a lot of positive feedback from members using the original version.
Before we jump into what's new, I just want to clarify that the new version will continue to repaint. Repainting was the problem with the original Trend Reversal. Though there is no way to fix that issue, we continue to find ways to improve it.
One way to increase the reliability of the signals is to implement additional trend reversal patterns. Included in the Enhanced version are:
- Bullish and Bearish Engulfing candles
- VWAP
- Advanced Market Moves (will not be included in the public release due to obvious reason)
Here’s How it Works:
From now on, the Trend Reversal Signals will only appear on your chart if it fits the following requirement:The reversal candle (pulled from the original version) must either be an Engulfing candle, below/above VWAP, or matches with the signal given by the Advanced Market Moves.
We assume that if any of the three conditions match up in a single candle, most likely there would be a point of reversal in trend. Of course, since this indicator repaint, it’s impossible to backtest. Hopefully, this Enhanced version will work better since additional conditions have been added.
thinkScript Code
Code:
# Enhanced Trend Reversal Indicator with Signals
# Added VWAP and Engulfing Candles
# Assembled by BenTen at useThinkScript.com
# Original developer: Bayside of Enhanced Investor
# Original version: https://usethinkscript.com/threads/trend-reversal-indicator-with-signals-for-thinkorswim.183/
# Version 1.0 (read changelog in forum)

def price = close;
def superfast_length = 9;
def fast_length = 14;
def slow_length = 21;
def displace = 0;

def mov_avg9 = ExpAverage(price[-displace], superfast_length);
def mov_avg14 = ExpAverage(price[-displace], fast_length);
def mov_avg21 = ExpAverage(price[-displace], slow_length);

# MAs part of Trend Reversal
def Superfast = mov_avg9;
def Fast = mov_avg14;
def Slow = mov_avg21;

def buy = mov_avg9 > mov_avg14 and mov_avg14 > mov_avg21 and low > mov_avg9;
def stopbuy = mov_avg9 <= mov_avg14;
def buynow = !buy[1] and buy;
def buysignal = CompoundValue(1, if buynow and !stopbuy then 1 else if buysignal[1] == 1 and stopbuy then 0 else buysignal[1], 0);

def Buy_Signal = buysignal[1] == 0 and buysignal == 1;
def Momentum_Down = buysignal[1] == 1 and buysignal == 0;

def sell = mov_avg9 < mov_avg14 and mov_avg14 < mov_avg21 and high < mov_avg9;
def stopsell = mov_avg9 >= mov_avg14;
def sellnow = !sell[1] and sell;
def sellsignal = CompoundValue(1, if sellnow and !stopsell then 1 else if sellsignal[1] == 1 and stopsell then 0 else sellsignal[1], 0);
def Sell_Signal = sellsignal[1] == 0 and sellsignal;

input method = {default average, high_low};
def bubbleoffset = .0005;
def percentamount = .01;
def revAmount = .05;
def atrreversal = 2.0;
def atrlength = 5;
def pricehigh = high;
def pricelow = low;
def averagelength = 5;
def averagetype = AverageType.EXPONENTIAL;
def mah = MovingAverage(averagetype, pricehigh, averagelength);
def mal = MovingAverage(averagetype, pricelow, averagelength);
def priceh = if method == method.high_low then pricehigh else mah;
def pricel = if method == method.high_low then pricelow else mal;
def EI = ZigZagHighLow("price h" = priceh, "price l" = pricel, "percentage reversal" = percentamount, "absolute reversal" = revAmount, "atr length" = atrlength, "atr reversal" = atrreversal);
rec EISave = if !IsNaN(EI) then EI else GetValue(EISave, 1);
def chg = (if EISave == priceh then priceh else pricel) - GetValue(EISave, 1);
def isUp = chg >= 0;
def EIL = if !IsNaN(EI) and !isUp then pricel else GetValue(EIL, 1);
def EIH = if !IsNaN(EI) and isUp then priceh else GetValue(EIH, 1);
def dir = CompoundValue(1, if EIL != EIL[1] or pricel == EIL[1] and pricel == EISave then 1 else if EIH != EIH[1] or priceh == EIH[1] and priceh == EISave then -1 else dir[1], 0);
def signal = CompoundValue(1, if dir > 0 and pricel > EIL then if signal[1] <= 0 then 1 else signal[1] else if dir < 0 and priceh < EIH then if signal[1] >= 0 then -1 else signal[1] else signal[1], 0);

# Define original signals
def bullish2 = signal > 0 and signal[1] <= 0;
def bearish2 = signal < 0 and signal[1] >= 0;

# VWAP
input numDevDn = -2.0;
input numDevUp = 2.0;
input timeFrame = {default DAY, WEEK, MONTH};

def cap = GetAggregationPeriod();
def errorInAggregation =
    timeFrame == timeFrame.DAY and cap >= AggregationPeriod.WEEK or
    timeFrame == timeFrame.WEEK and cap >= AggregationPeriod.MONTH;
Assert(!errorInAggregation, "timeFrame should be not less than current chart aggregation period");

def yyyyMmDd = GetYYYYMMDD();
def periodIndx;
switch (timeFrame) {
case DAY:
    periodIndx = yyyyMmDd;
case WEEK:
    periodIndx = Floor((DaysFromDate(First(yyyyMmDd)) + GetDayOfWeek(First(yyyyMmDd))) / 7);
case MONTH:
    periodIndx = RoundDown(yyyyMmDd / 100, 0);
}
def isPeriodRolled = CompoundValue(1, periodIndx != periodIndx[1], yes);

def volumeSum;
def volumeVwapSum;
def volumeVwap2Sum;

if (isPeriodRolled) {
    volumeSum = volume;
    volumeVwapSum = volume * vwap;
    volumeVwap2Sum = volume * Sqr(vwap);
} else {
    volumeSum = CompoundValue(1, volumeSum[1] + volume, volume);
    volumeVwapSum = CompoundValue(1, volumeVwapSum[1] + volume * vwap, volume * vwap);
    volumeVwap2Sum = CompoundValue(1, volumeVwap2Sum[1] + volume * Sqr(vwap), volume * Sqr(vwap));
}
def priceVWAP = volumeVwapSum / volumeSum;
def deviation = Sqrt(Max(volumeVwap2Sum / volumeSum - Sqr(priceVWAP), 0));

def VWAP = priceVWAP;
#plot UpperBand = priceVWAP + numDevUp * deviation;
#plot LowerBand = priceVWAP + numDevDn * deviation;
def UpVWAP = price > VWAP;
def DownVWAP = price < VWAP;

# Engulfing Candles. Snippets from @ConfluenceCptl
def BodyMax = Max(open, close);
def BodyMin = Min(open, close);
def IsEngulfing = BodyMax > BodyMax[1] and
BodyMin < BodyMin[1];

# Define Signals with VWAP
def bullish_vwap = UpVWAP and bullish2;
def bearish_vwap = DownVWAP and bearish2;

# Plot Signals with VWAP
plot bull_vwap = bullish_vwap;
bull_vwap.SetPaintingStrategy(PaintingStrategy.BOOLEAN_ARROW_UP);
bull_vwap.SetDefaultColor(Color.CYAN);
bull_vwap.SetLineWeight(2);
plot bear_vwap = bearish_vwap;
bear_vwap.SetPaintingStrategy(PaintingStrategy.BOOLEAN_ARROW_DOWN);
bear_vwap.SetDefaultColor(Color.CYAN);
bear_vwap.SetLineWeight(2);

# Define Signals with Engulfing Candles
def bullish_engulf = bullish2 and Isengulfing and close > open;
def bearish_engulf = bearish2 and Isengulfing and close < open;

# Plot Signals with Engulfing Candles
plot bull_engulf = bullish_engulf;
bull_engulf.SetPaintingStrategy(PaintingStrategy.BOOLEAN_ARROW_UP);
bull_engulf.SetDefaultColor(Color.WHITE);
bull_engulf.SetLineWeight(2);
plot bear_engulf = bearish_engulf;
bear_engulf.SetPaintingStrategy(PaintingStrategy.BOOLEAN_ARROW_DOWN);
bear_engulf.SetDefaultColor(Color.WHITE);
bear_engulf.SetLineWeight(2);

AddLabel(yes,"Signals w/ VWAP",color.CYAN);
AddLabel(yes,"Signals w/ Engulfing",color.WHITE);

# Configurations
input bEngulf = yes;
input sEngulf = yes;
input bVWAP = yes;
input sVWAP = yes;
bull_engulf.SetHiding(!bEngulf);
bear_engulf.SetHiding(!sEngulf);
bull_vwap.SetHiding(!bVWAP);
bear_vwap.SetHiding(!sVWAP);
Shareable Link: https://tos.mx/1we0QW
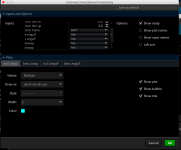
Configurations
There will be a lot of signals on your chart, however, I have color-coded them. You can also disable any type of arrows right from the indicator’s settings page. You don’t have to edit anything in the source code.Changelog
Version 1.0: Initial version
Feel free to test it out and let me know. I heard a lot of positive feedback from members using the original version.
Video Tutorial
Attachments
Last edited:
