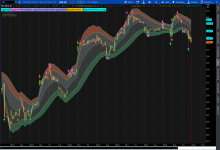
Standard Deviation Bands Enhanced for ThinkorSwim

horserider

Well-known member
VIP
The idea is the deviations are 1.3 (65%)and 2(98%) of prices. Prices breaking into or above or below these zones (red and Green) are extended and may signal a reversal soon. There is a safe holding zone in light gray for buys and dark gray for sells. Can trade on breaks of 1.3 line or once you are in a move up or down you can hold till safe zones are exited. Threw in some arrows for all the arrow fans.

Just be careful when price closes outside the bands. Instead of reversing it may ride the bands up or down.

ofL6ISy.png


Code:
# Enhanced Standard Deviation Bands by Horserider 9/21/2019
# Two standard TD Ameritrade IP Company, Inc. (c) 2019 StandardDeviation studies      combined into one study with deviations being 1.3 and 2.0 . User changeable length, dev, and avg type to suit their trading.
#
# Inner bands
input length = 20;
input numDevDn = -1.3;
input numDevUp = 1.3;
input averageType = AverageType.EXPONENTIAL;

def avg = MovingAverage(averageType, close);
def expDev = ExpAverage(AbsValue(avg - close), length);

plot UpperBand = avg + numDevUp * expDev;
plot MidLine = avg;
plot LowerBand = avg + numDevDn * expDev;

UpperBand.SetDefaultColor(GetColor(1));
MidLine.SetDefaultColor(GetColor(1));
MidLine.SetStyle(Curve.SHORT_DASH);
LowerBand.SetDefaultColor(GetColor(1));

# Outer bands
input lengthob = 20;
input numDevDnob = -2.0;
input numDevUpob = 2.0;
input averageTypeob = AverageType.EXPONENTIAL;

def avgob = MovingAverage(averageTypeob, close);
def expDevob = ExpAverage(AbsValue(avgob - close), lengthob);

plot UpperBandob = avgob + numDevUpob * expDevob;
#plot MidLineob = avgob;
plot LowerBandob = avgob + numDevDnob * expDevob;

UpperBandob.SetDefaultColor(GetColor(1));
#MidLineob.SetDefaultColor(GetColor(1));
#MidLineob.SetStyle(Curve.SHORT_DASH);
LowerBandob.SetDefaultColor(GetColor(1));


# Clouds for safe zones Light gray for long, dark gray for short.
AddCloud (midline,upperbandob, Color.lIGHT_GRAY, Color.lIGHT_GRAY);
AddCloud(midline, lowerband, Color.GRAY, Color.GRAY);

# Clounds for areas of possible reversals. Green for longs, red for shorts.
AddCloud( upperband,upperbandob, Color.LIGHT_RED, Color.LIGHT_RED);
AddCloud( lowerband,lowerbandob, Color.LIGHT_GREEN, Color.LIGHT_GREEN);

# Plot arrows for close crosses of Deviation lines. Indside plum, Outside red/green Arrows included because many like arrows. I suggest being careful following any arrow signal.
plot UpSignalob =  close crosses below   lowerbandob ;
plot DownSignalob = close crosses above upperbandob;

plot UpSignal =  close crosses   lowerband ;
plot DownSignal = close crosses  upperband;

UpSignal.SetDefaultColor(Color.PLUM);
UpSignal.SetPaintingStrategy(PaintingStrategy.BOOLEAN_ARROW_UP);
DownSignal.SetDefaultColor(Color.PLUM);
DownSignal.SetPaintingStrategy(PaintingStrategy.BOOLEAN_ARROW_DOWN);

UpSignalob.SetDefaultColor(Color.UPTICK);
UpSignalob.SetPaintingStrategy(PaintingStrategy.BOOLEAN_ARROW_UP);
DownSignalob.SetDefaultColor(Color.DOWNTICK);
DownSignalob.SetPaintingStrategy(PaintingStrategy.BOOLEAN_ARROW_DOWN);
 

Attachments

  • ofL6ISy.png
    ofL6ISy.png
    161.8 KB · Views: 494
Last edited by a moderator:
Hahaha,..just threw it together and with added arrows...........I tightened up the bands, with the reversal arrows,.......one more point, the reversal is not valid until AFTER a colored candle is created. I place an alert on top or bottom of the colored candle body, used as an "entry," when arrow generates up or down.
lKqEIFJ.jpg
could u pl share the code-Thanks
 
I am playing around with this study today and trying different deviations on different timeframes, some interesting observations so far.
I really like it for scalping on 1min timeframe.
 
@madeinnyc Good choice. just put arrows in because people seem to like arrows. Try this.
Code:
# Enhanced Standard Deviation Bands by Horserider 9/21/2019
# Two standard TD Ameritrade IP Company, Inc. (c) 2019 StandardDeviation studies      combined into one study with deviations being 1.3 and 2.0 . User changeable length, dev, and avg type to suit their trading.
#
# Inner bands
input length = 20;
input numDevDn = -1.3;
input numDevUp = 1.3;
input averageType = AverageType.EXPONENTIAL;

def avg = MovingAverage(averageType, close);
def expDev = ExpAverage(AbsValue(avg - close), length);

plot UpperBand = avg + numDevUp * expDev;
plot MidLine = avg;
plot LowerBand = avg + numDevDn * expDev;

UpperBand.SetDefaultColor(GetColor(1));
MidLine.SetDefaultColor(GetColor(1));
MidLine.SetStyle(Curve.SHORT_DASH);
LowerBand.SetDefaultColor(GetColor(1));

# Outer bands
input lengthob = 20;
input numDevDnob = -2.0;
input numDevUpob = 2.0;
input averageTypeob = AverageType.EXPONENTIAL;

def avgob = MovingAverage(averageTypeob, close);
def expDevob = ExpAverage(AbsValue(avgob - close), lengthob);

plot UpperBandob = avgob + numDevUpob * expDevob;
#plot MidLineob = avgob;
plot LowerBandob = avgob + numDevDnob * expDevob;

UpperBandob.SetDefaultColor(GetColor(1));
#MidLineob.SetDefaultColor(GetColor(1));
#MidLineob.SetStyle(Curve.SHORT_DASH);
LowerBandob.SetDefaultColor(GetColor(1));


# Clouds for safe zones Light gray for long, dark gray for short.
AddCloud (midline,upperbandob, Color.lIGHT_GRAY, Color.lIGHT_GRAY);
AddCloud(midline, lowerband, Color.GRAY, Color.GRAY);

# Clounds for areas of possible reversals. Green for longs, red for shorts.
AddCloud( upperband,upperbandob, Color.LIGHT_RED, Color.LIGHT_RED);
AddCloud( lowerband,lowerbandob, Color.LIGHT_GREEN, Color.LIGHT_GREEN);
 
Thanks @horserider
I thought this might be a good place to ask this question...
What is the difference between this code and utilizing the Bollinger Bands set to the same numbers and an Exponential MA?
I would not have thought there was a difference, but it seems there is a large difference....
Can anyone explain it to me please?

thanks
bama
 
@bamafamily333 Not compared them but most likely not a lot of difference. Without examining the code of each at this time , my guess is this.

def avg = MovingAverage(averageType, close);
def expDev = ExpAverage(AbsValue(avg - close), length);

So as far as I understand this is an exp. avg of std. dev. Math is not my strong subject so any math wiz is welcome to correct this. This study should be a smoother plot and less overshoot compared to BB.
 
Hi, I need a watchlist indicator based on the ESDBands study that can do the following:

1. Change the watchlist column's background color when price crosses over the bands.
2. I would like to see how far away the price is from the moving average, similar to % change with colored values, at the same time

So basically, I want to see the distance from the MA as a colored value (i.e. Green when Price > MA and Red when Price < MA) in the default background color (i.e. Black), and whenever the price crosses above or below the ESD Bands, the background color would change to something more noticeable like Yellow.

Can anyone make this for me?
 
@joekim1 Per your specifications, this is a watchlist for @horserider's Standard Deviation Bands Enhanced for ThinkorSwim which would have been a better place to put your request.

Code:
close>ma color.green
close<ma color.red
close above or below Enhanced Standard Deviation Bands color.yellow

UxBtDeF.png

Here is the link to the shared watchlist code: http://tos.mx/bQqIcoN

Before you ask for additional modifications, you should know that it is customary to make your own attempt at creating what you want and then come here and ask for help w/ any problems you are having. If you google TOS watchlists, you will find hundreds of videos on how to make a study into a watchlist.
HTH
 
Last edited:
Hi all, I'm not well versed in coding in tos. I was curious if anyone has any free time to code a backtest of this indicators code. Long when it hits the -2.0 standard deviation (lower band) and then take profit when it hits the midline. Short when it hits the 2.0 standard deviation (upper band) and take profit when it hits the midline. Here is the code for the indicator (shout out to a fellow member for posting it here).

Code:
# Enhanced Standard Deviation Bands by Horserider 9/21/2019
# Two standard TD Ameritrade IP Company, Inc. (c) 2019 StandardDeviation studies      combined into one study with deviations being 1.3 and 2.0 . User changeable length, dev, and avg type to suit their trading.
#
# Inner bands
input length = 20;
input numDevDn = -1.3;
input numDevUp = 1.3;
input averageType = AverageType.EXPONENTIAL;

def avg = MovingAverage(averageType, close);
def expDev = ExpAverage(AbsValue(avg - close), length);

plot UpperBand = avg + numDevUp * expDev;
plot MidLine = avg;
plot LowerBand = avg + numDevDn * expDev;

UpperBand.SetDefaultColor(GetColor(1));
MidLine.SetDefaultColor(GetColor(1));
MidLine.SetStyle(Curve.SHORT_DASH);
LowerBand.SetDefaultColor(GetColor(1));

# Outer bands
input lengthob = 20;
input numDevDnob = -2.0;
input numDevUpob = 2.0;
input averageTypeob = AverageType.EXPONENTIAL;

def avgob = MovingAverage(averageTypeob, close);
def expDevob = ExpAverage(AbsValue(avgob - close), lengthob);

plot UpperBandob = avgob + numDevUpob * expDevob;
#plot MidLineob = avgob;
plot LowerBandob = avgob + numDevDnob * expDevob;

UpperBandob.SetDefaultColor(GetColor(1));
#MidLineob.SetDefaultColor(GetColor(1));
#MidLineob.SetStyle(Curve.SHORT_DASH);
LowerBandob.SetDefaultColor(GetColor(1));


# Clouds for safe zones Light gray for long, dark gray for short.
AddCloud (midline,upperbandob, Color.lIGHT_GRAY, Color.lIGHT_GRAY);
AddCloud(midline, lowerband, Color.GRAY, Color.GRAY);

# Clounds for areas of possible reversals. Green for longs, red for shorts.
AddCloud( upperband,upperbandob, Color.LIGHT_RED, Color.LIGHT_RED);
AddCloud( lowerband,lowerbandob, Color.LIGHT_GREEN, Color.LIGHT_GREEN);

# Plot arrows for close crosses of Deviation lines. Indside plum, Outside red/green Arrows included because many like arrows. I suggest being careful following any arrow signal.
plot UpSignalob =  close crosses below   lowerbandob ;
plot DownSignalob = close crosses above upperbandob;

plot UpSignal =  close crosses   lowerband ;
plot DownSignal = close crosses  upperband;

UpSignal.SetDefaultColor(Color.PLUM);
UpSignal.SetPaintingStrategy(PaintingStrategy.BOOLEAN_ARROW_UP);
DownSignal.SetDefaultColor(Color.PLUM);
DownSignal.SetPaintingStrategy(PaintingStrategy.BOOLEAN_ARROW_DOWN);

UpSignalob.SetDefaultColor(Color.UPTICK);
UpSignalob.SetPaintingStrategy(PaintingStrategy.BOOLEAN_ARROW_UP);
DownSignalob.SetDefaultColor(Color.DOWNTICK);
DownSignalob.SetPaintingStrategy(PaintingStrategy.BOOLEAN_ARROW_DOWN);
 
@horserider I added an alert for this and now my indicator arrow are much smaller. How do I enlarge them again? Very limited at editing script. Thanks John
 
Last edited:
Horserider, I added an alert for this and now my indicator arrow are much smaller. How do I enlarge them again? Very limited at editing script. Thanks John
You can adjust arrow size, and color, from within the Studies Settings Panel itself...
 

Join useThinkScript to post your question to a community of 21,000+ developers and traders.

Similar threads

Not the exact question you're looking for?

Start a new thread and receive assistance from our community.

87k+ Posts
259 Online
Create Post

Similar threads

Similar threads

The Market Trading Game Changer

Join 2,500+ subscribers inside the useThinkScript VIP Membership Club
  • Exclusive indicators
  • Proven strategies & setups
  • Private Discord community
  • ‘Buy The Dip’ signal alerts
  • Exclusive members-only content
  • Add-ons and resources
  • 1 full year of unlimited support

Frequently Asked Questions

What is useThinkScript?

useThinkScript is the #1 community of stock market investors using indicators and other tools to power their trading strategies. Traders of all skill levels use our forums to learn about scripting and indicators, help each other, and discover new ways to gain an edge in the markets.

How do I get started?

We get it. Our forum can be intimidating, if not overwhelming. With thousands of topics, tens of thousands of posts, our community has created an incredibly deep knowledge base for stock traders. No one can ever exhaust every resource provided on our site.

If you are new, or just looking for guidance, here are some helpful links to get you started.

What are the benefits of VIP Membership?
VIP members get exclusive access to these proven and tested premium indicators: Buy the Dip, Advanced Market Moves 2.0, Take Profit, and Volatility Trading Range. In addition, VIP members get access to over 50 VIP-only custom indicators, add-ons, and strategies, private VIP-only forums, private Discord channel to discuss trades and strategies in real-time, customer support, trade alerts, and much more. Learn all about VIP membership here.
How can I access the premium indicators?
To access the premium indicators, which are plug and play ready, sign up for VIP membership here.
Back
Top