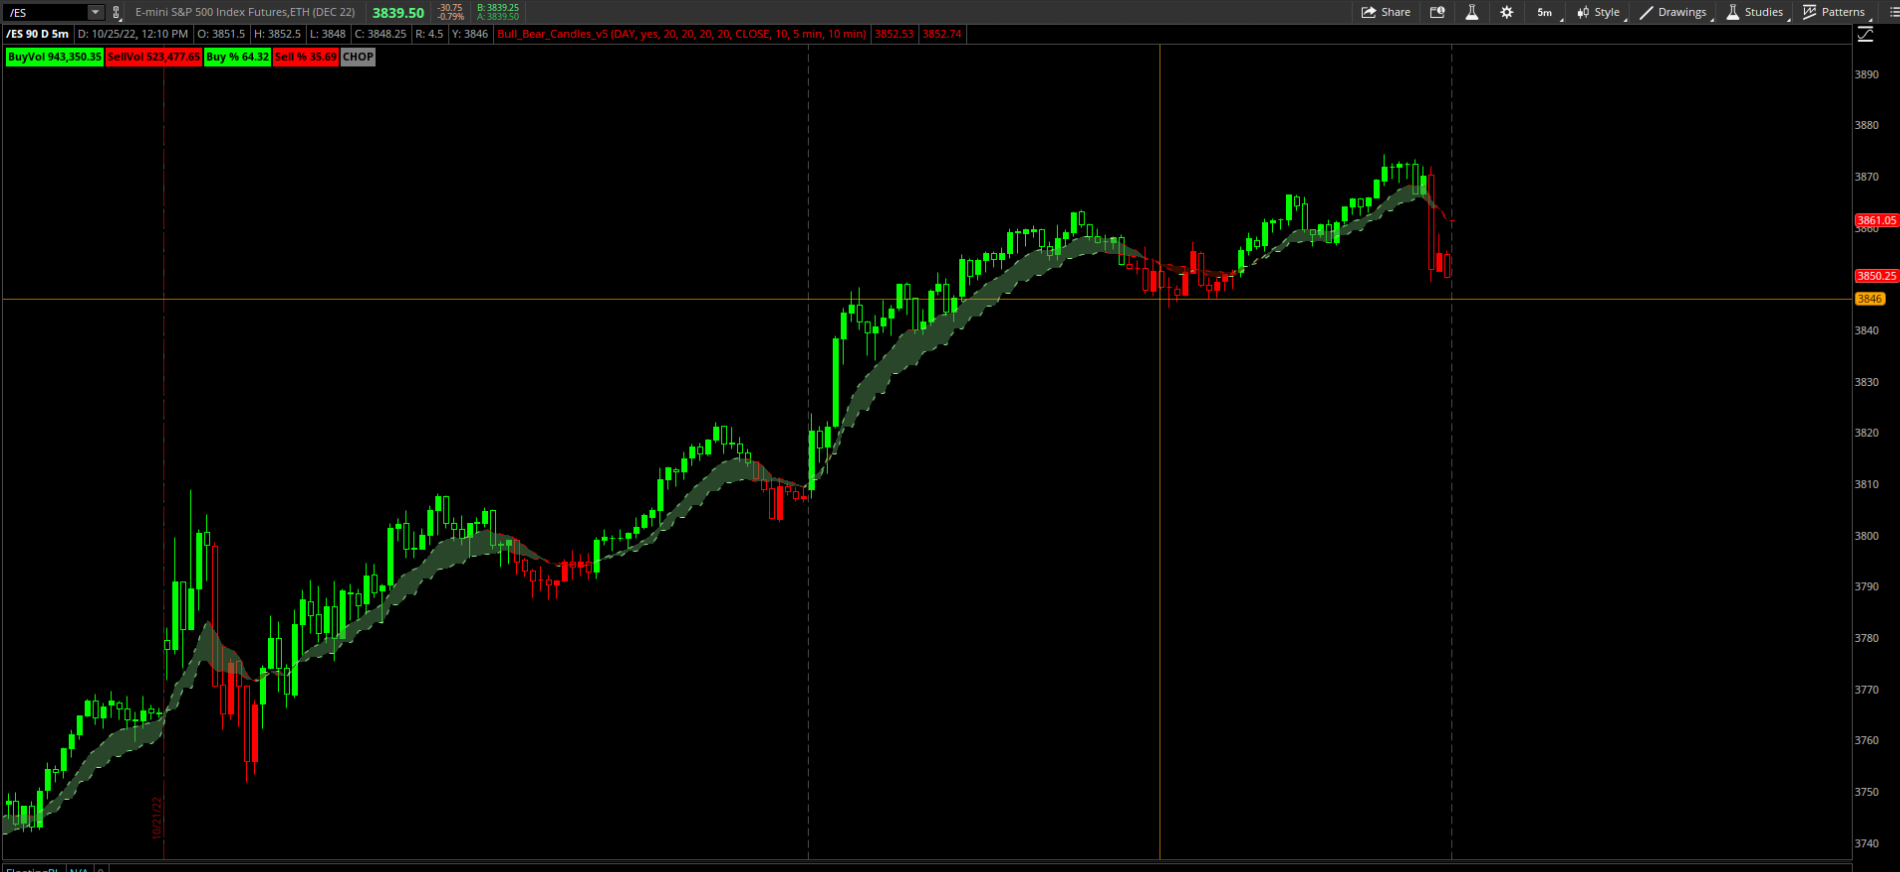
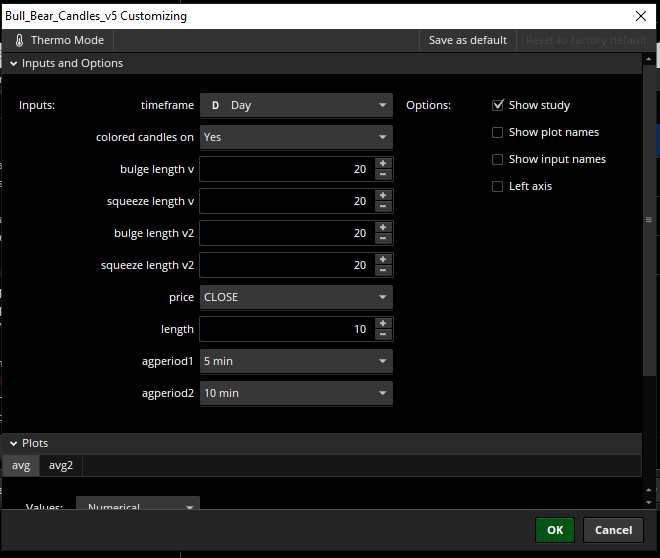
I have been using these in futures for paper trading to get familiar with /es, /nq.
With all the testing and back testing and overtrading and commissions and losses I did on my paper account for months, ever since I started using the zones for breakouts and stop losses, I was able to make all of the losses back to the point I’m scalping es in a 1 or 5 min chart 2-3 times a day.
My account was down $2k at one point before c3. It is now down $7.80.
This thing saved my life. Those auto generated real time zone painting is a HUGE game changer.
I made some adjustments to it and started adding signal arrows that show up when 7 of the indicstors are all bullish or bearish.
So not only do we get the parabolic sar arrow signals Chris made, but I am now getting conviction arrow indicstors when multiple indicators are on the same direction, the trend is getting stronger, and the volatility is rising.
If it is ok with Christopher, I can put up a version of my enhancement to this.
I didn’t remove any functionality, I just added ease of use and functionality.
I also don’t use pre market or after hours on my 5 min chart. MM manipulate them after hours to the point the charts can blow up on the open.