Hi @METAL,@Christopher84 What do you suggest setting the multipliers of PLD Bands and TS_V9 to for the SPX. I cannot find if you addressed this.
Thanks.
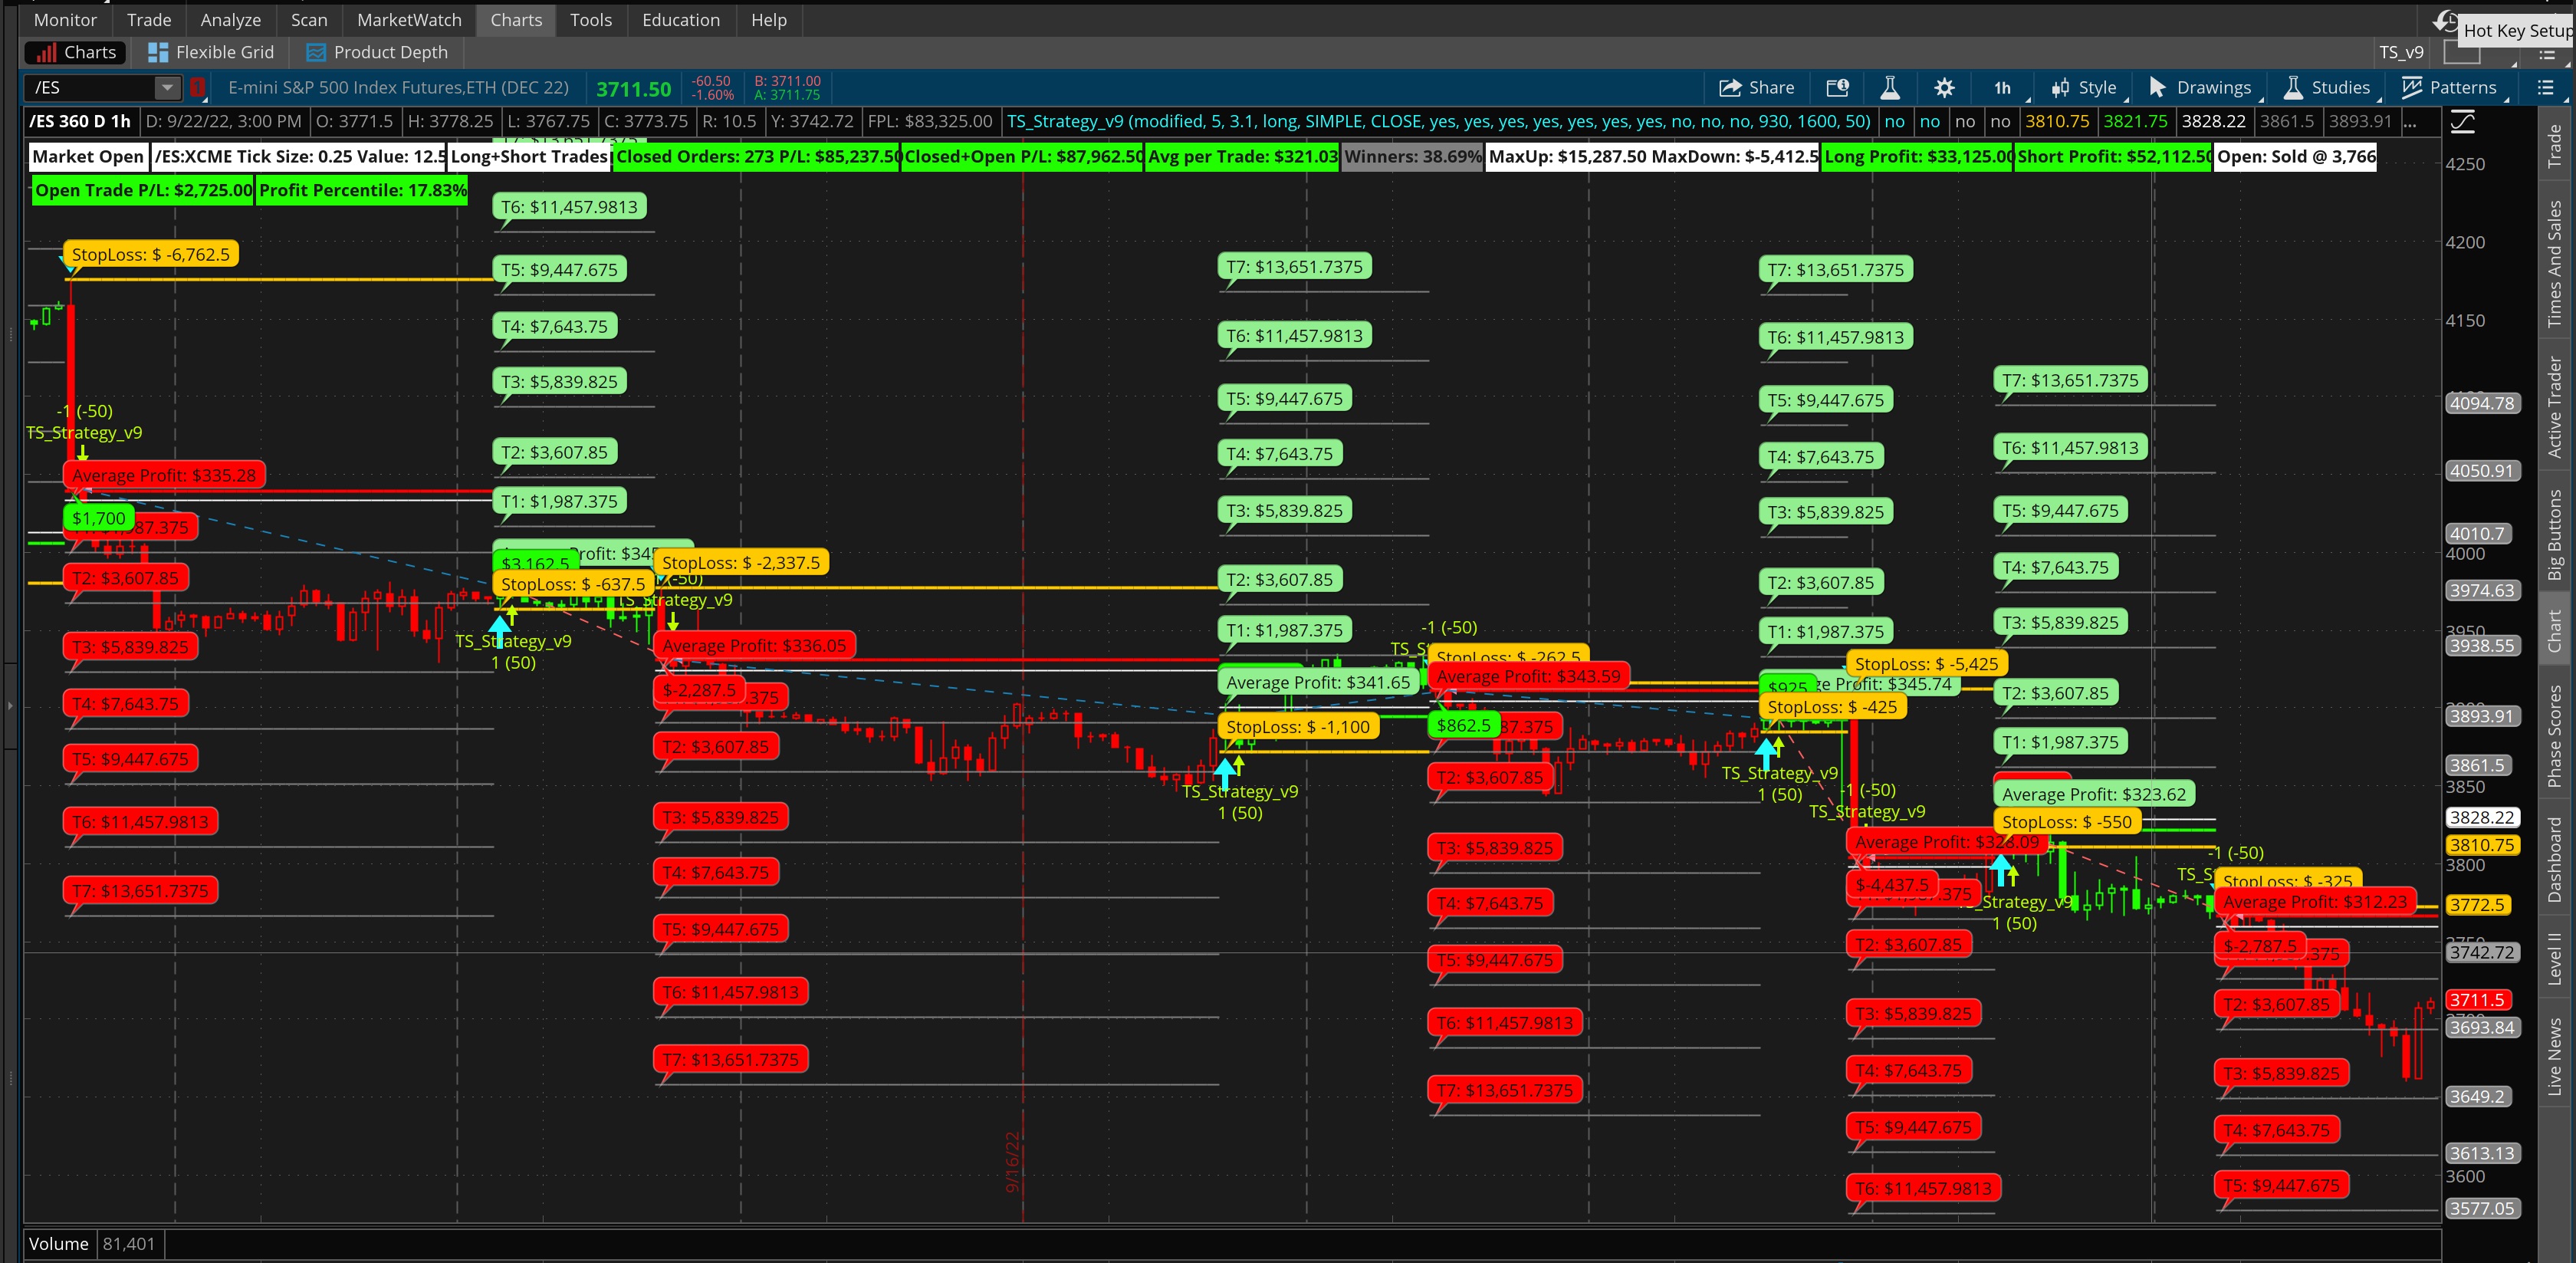
Mult (short for multiplier) for SPX should be set to 1. An easy way of figuring this out if you are unsure, is to look at the strategy entries and exits (it will call out the multiplier). Below is the chart for SPX, and on the entries and exits you will see 1 and -1. If this were the /es, you would see 1 (50) or -1 (-50), meaning that the multiplier should be set to 50. For /mes and /btc you will see 1 (5) and -1 (-5) indicating multiplier of 5 for these assets. I hope this helps!