@Christopher84 What do you suggest setting the multipliers of PLD Bands and TS_V9 to for the SPX. I cannot find if you addressed this.
Thanks.
Thanks.
Join useThinkScript to post your question to a community of 21,000+ developers and traders.
Hi @METAL,@Christopher84 What do you suggest setting the multipliers of PLD Bands and TS_V9 to for the SPX. I cannot find if you addressed this.
Thanks.
Oh Okay. Thanks. I didn't notice that the "call out" was related to the Mult. Thanks.Hi @METAL,
Mult (short for multiplier) for SPX should be set to 1. An easy way of figuring this out if you are unsure, is to look at the strategy entries and exits (it will call out the multiplier). Below is the chart for SPX, and on the entries and exits you will see 1 and -1. If this were the /es, you would see 1 (50) or -1 (-50), meaning that the multiplier should be set to 50. For /mes and /btc you will see 1 (5) and -1 (-5) indicating multiplier of 5 for these assets. I hope this helps!

Yes it can however not with full functionality. No labels, no C3 line, & you will have to change the colors because for some reason all the green and red lines are all pink.
Just add the study on your app and change the colors comparing it to your computer version.
Ok sorry it took so long… this is how to change mobile settings to look right-ish
thanks. still not getting it. doesn't know.... would you share the grip indicator which V. you plotted to the mobile. thanks.
@hotwins
(YHextlineOB & YHextlineOS are off unfortunately it causes some scaling issues on mobile - I have tried to adjust the line limits but nothing worked so I turn them off)
The dashed lines on my chart are the confirmation candles study “near term support & resistance” lines… so everything else turned off (of course I just deleted everything except the code needed for the lines but works either way)
Hope this helps!
Hi @HODL-Lay-HE-hoo!,@Christopher84
Christopher… who rolls on 84s… (pretty sure the 84 is in reference to his spiked rims) is the line limits adjustment for all lines? I would like to limit the length of the orange and light green dashed lines so they don’t effect the scaling on mobile as much.
Hi @HODL-Lay-HE-hoo!,
If I'm understanding you correctly, the adjustment for the length of those lines is BulgeLengthPrice2 (top line NearTResistance) and SqueezeLengthPrice2 (bottom line NearTSupport). Hope this helps!
Hi @HODL-Lay-HE-hoo!,The lines are called YHextLineOB & YHextLineOB from the C3 Max Spark
Hi @GiantBull!@Christopher84 I have been your using your indicator and have had the best trading results I've ever had. I have two 2 questions that I wanted to ask:
1. The candles switch colors many times during a trend so when do you determine that the trend is near an end and a reversal might happen? Do you use other indicators? Support/resistance? Combo of both?
2. Is there a way you can make a tutorial on how you combined all these indicators in thinkscript? I know I might be asking a lot here but the coding is so well done. I would really love to learn how you coded this script so in the future I can possibly make a script for indicators that I personally like.
1 hour chart for the /es using TS_Analysis v9 set to 5, 3.1 is doing extremely well. 50.49% win rate.

1 hour chart for the /es using TS_Analysis v9 set to 5, 3.1 is doing extremely well. 50.49% win rate.

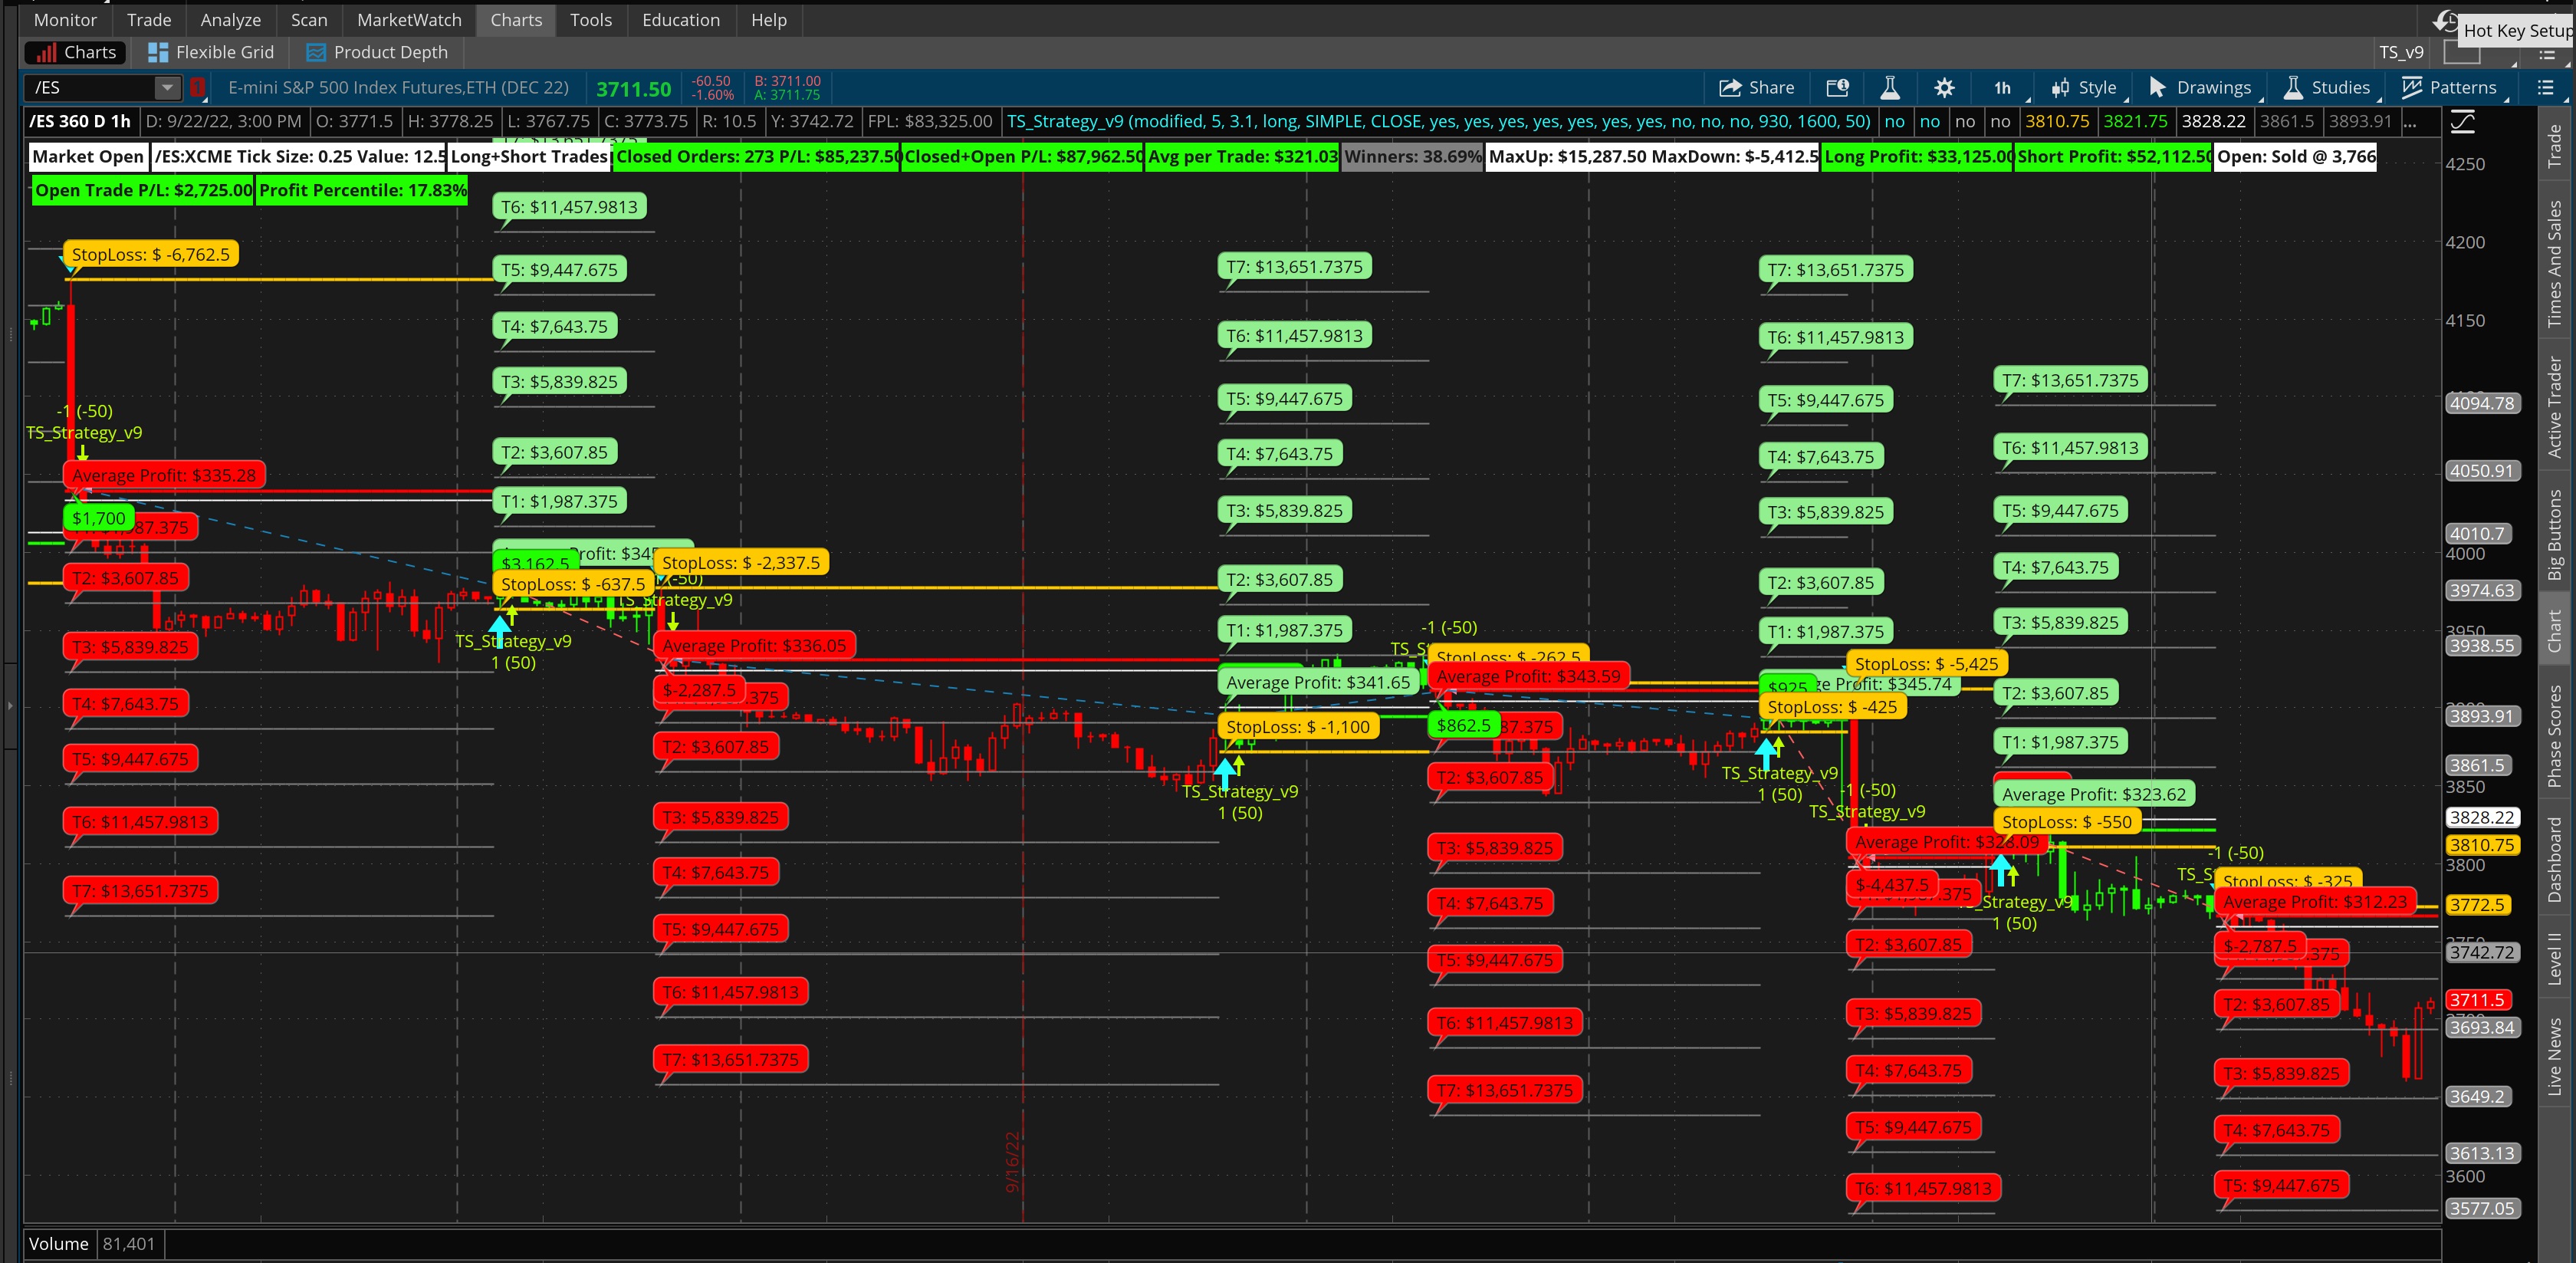
Hi @bradolson!Hi Christopher- Thank you for all of your effort. I've learned a lot from your video and in this thread. In your post above, you noted that TS_v9 had a 50.49% win rate. I've posted an image below, also from a chart today, which shows a 38.69% win rate. Wondering if you could help me figure out why there's a difference? Maybe I don't have all of the same settings??
I'm using:
TS_strategy_v9 code is from page 1 of the thread
/es
1 hour, 360 day
atr period = 5
atr factor = 3.1
mult = 50
extended hours = off
Thanks

Hi @bradolson!
Great question! The issue is in your chart settings. Under the Futures tab in settings, turn off start aggregation at market open. This should remedy the difference that you are seeing. Hope this helps!
Can you share the script/code for PLD and EMAD_Lower plots?16004[/ATTACH]']
The green and orange dashed lines people... beautiful
Hi @sandy_s157,Can you share the script/code for PLD and EMAD_Lower plots?
Start a new thread and receive assistance from our community.
useThinkScript is the #1 community of stock market investors using indicators and other tools to power their trading strategies. Traders of all skill levels use our forums to learn about scripting and indicators, help each other, and discover new ways to gain an edge in the markets.
We get it. Our forum can be intimidating, if not overwhelming. With thousands of topics, tens of thousands of posts, our community has created an incredibly deep knowledge base for stock traders. No one can ever exhaust every resource provided on our site.
If you are new, or just looking for guidance, here are some helpful links to get you started.