
somthing wrong red candle is turning to greyHi Everyone!
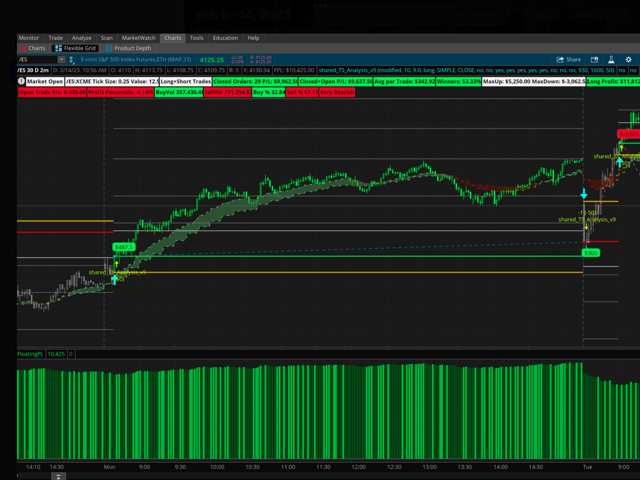
Just wanted to take a minute and share this 2 min chart utilizing Bull_Bear_Combo and TS_v9 (adjusted settings for the 2 min chart). Currently this strategy has 57% Winners. https://tos.mx/Yb4ajVS Happy trading everyone!

Confirmation Candles Indicator For ThinkorSwim
- Thread starter Christopher84
- Start date
Similar threads
-
Volume Confirmation for a Trend System For ThinkOrSwim
- Started by GLENNOHULL
- Replies: 4
-
Confirmation Candle with Key Level and Weighted Paintbars Chart Setup For ThinkOrSwim
- Started by rip78
- Replies: 8
-
 The Confirmation Trend Chart Setup | The End All Be All | For ThinkOrSwim
- Started by HODL-Lay-HE-hoo!
- Replies: 284
-
 DEMA Crossover with Heikin-Ashi Candle Confirmation for ThinkorSwim
- Started by theelderwand
- Replies: 67
-
 Repaints NSDT HAMA Candles + SSL Channel For ThinkOrSwim
- Started by samer800
- Replies: 61
Similar threads
-
Volume Confirmation for a Trend System For ThinkOrSwim
- Started by GLENNOHULL
- Replies: 4
-
Confirmation Candle with Key Level and Weighted Paintbars Chart Setup For ThinkOrSwim
- Started by rip78
- Replies: 8
-
The Confirmation Trend Chart Setup | The End All Be All | For ThinkOrSwim
- Started by HODL-Lay-HE-hoo!
- Replies: 284
-
DEMA Crossover with Heikin-Ashi Candle Confirmation for ThinkorSwim
- Started by theelderwand
- Replies: 67
-
Repaints NSDT HAMA Candles + SSL Channel For ThinkOrSwim
- Started by samer800
- Replies: 61
The Market Trading Game Changer
Join 2,500+ subscribers inside the useThinkScript VIP Membership Club
- Exclusive indicators
- Proven strategies & setups
- Private Discord community
- ‘Buy The Dip’ signal alerts
- Exclusive members-only content
- Add-ons and resources
- 1 full year of unlimited support
Frequently Asked Questions
What is useThinkScript?
useThinkScript is the #1 community of stock market investors using indicators and other tools to power their trading strategies. Traders of all skill levels use our forums to learn about scripting and indicators, help each other, and discover new ways to gain an edge in the markets.
How do I get started?
We get it. Our forum can be intimidating, if not overwhelming. With thousands of topics, tens of thousands of posts, our community has created an incredibly deep knowledge base for stock traders. No one can ever exhaust every resource provided on our site.
If you are new, or just looking for guidance, here are some helpful links to get you started.
- The most viewed thread:
https://usethinkscript.com/threads/repainting-trend-reversal-for-thinkorswim.183/ - Our most popular indicator:
https://usethinkscript.com/threads/buy-the-dip-indicator-for-thinkorswim.3553/ - Answers to frequently asked questions:
https://usethinkscript.com/threads/answers-to-commonly-asked-questions.6006/
What are the benefits of VIP Membership?
VIP members get exclusive access to these proven and tested premium indicators: Buy the Dip, Advanced Market Moves 2.0, Take Profit, and Volatility Trading Range. In addition, VIP members get access to over 50 VIP-only custom indicators, add-ons, and strategies, private VIP-only forums, private Discord channel to discuss trades and strategies in real-time, customer support, trade alerts, and much more. Learn all about VIP membership here.
How can I access the premium indicators?
To access the premium indicators, which are plug and play ready, sign up for VIP membership here.