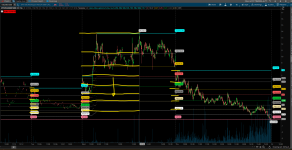
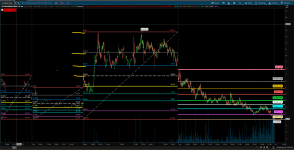
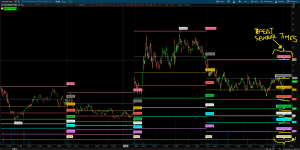
Auto Fib (Fibonacci) Levels Indicator for ThinkorSwim

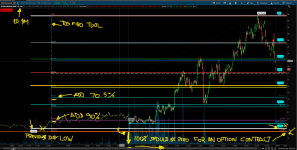
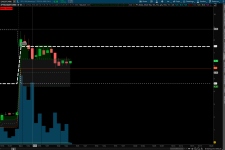
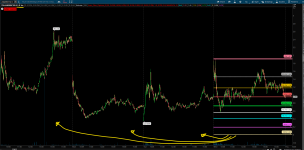
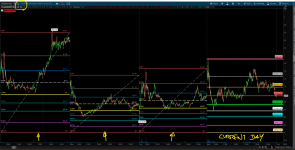
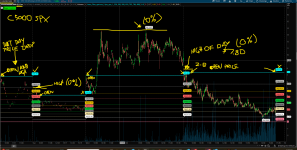
Good afternoon @tomsk @SleepyZ I hope you are doing well, As I mentioned before, I am not a coder and I am grateful for the help we receive in this community. I am looking for an Automatic Fibo indicator for Options. The closest thing is the indicator in Post # 1. I don't know if it would be possible to modify the indicator code in Post # 1 https://usethinkscript.com/threads/auto-fib-fibonacci- levels-indicator-for-thinkorswim.14/, to use it in option charts, I have attached screenshoots of an SPX call option with the TOS Fibo tool and with the Auto Fibo Levels indicator, the problem is that the indicator takes the lowest price on the chart (even if I select only 1 day) and as seen in the screenshoot, the low that the indicator took was $0.90 which is from the previous day, being an intraday call option the lowest point should be zero as is plotted on the graph with the TOS tool. ( And also if it were possible to have the option to activate on/off the coefficient and separately the price and to be able to select separately whether the coefficient and/or the price is shown on the left or right, I ask about that option because if it had open 4 options contracts the space to see the bubbles with the coefficients and price would be very limited. In my search for a Fibo indicator for options I saw an indicator in Post #350 https://usethinkscript.com/threads/...vels-indicator-for-thinkorswim.14/post-127643 that had the coefficients with the same colors as the drawn lines that could help to better differentiate the levels. And if you could add the 70.5% and 90% levels to the indicator, again thank you very much for your valuable help.
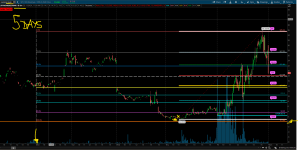
In the case of a 0 DTE option, this indicator should take anchor 1 (zero) starting at 9:30 am. And if you need the option to see the movement of the contract price in the week as shown in screenshoot 5, you can select the number of days.

[Edit: See Post 372 https://usethinkscript.com/threads/...vels-indicator-for-thinkorswim.14/post-137860 for final code for OPTIONS ONLY autofibs]

Here is a repost of a reply to your need of some adjustments.

Since I do not work with options, I was not able to test the code beyond what you posted. However, this hopefully fixes it so that the plots only use the last day's data.


Screenshot 2024-02-05 155045.png
Code:
# Auto Fib V1.4
# tomsk
# 11.19.2019

# Automatically draws fibonacci retracements using the highest price and lowest price
# from the current view and timeframe.
#
# Fibonacci retracements use horizontal lines to indicate areas of support or resistance
# at the key Fibonacci levels before it continues in the original direction. These levels
# are created by drawing a trendline between two extreme points and then dividing the
# vertical distance by the key Fibonacci ratios of: 23.6%, 38.2%, 50%, 61.8%, 78.6%, and 100%.

# CHANGE LOG
#
# V1.0 - 12.18.2018 - BenTen       - Initial release of Auto Fib, created by Ryan Hendricks
# V1.1 - 11.15.2019 - theelderwand - As script was difficult to read, made the following enhancements
#                                    Expands to right
#                                    Doesn't expand to left
#                                    Custom colors for Fibonacci bars (0.618 is GOLD color)
#                                    Custom line weights
#                                    Code is modularized so you can add extra plots as needed
# V1.2 - 11.15.2019 - tomsk        - Added an input selector for the colors of the label. You
#                                    can select from any of the colors listed - red, orange,
#                                    green, etc and bubbles for all the fib retracements will
#                                    utilize that color.
# V1.3 - 11.19.2019 - tomsk        - Modified the AddChartBubbles to be displayed on the right
#                                    side of the chart. Please ensure that you increase the
#                                    expansion area to that the bubbles have room to be displayed
#                                    Chart Settings > Time Axis > Expansion Area

# V1.4 - 20240203 - Sleepyz        - Modified to work for Options for only the last day. There the
#                                    low was defaulted to 0 as requested by the requestor. 2 fibs added


#hint Price: Price used in the alerts on crossing retracement lines. <b>(Default is Close)</b>

#hint coefficient_0: Retracement Line 0: Retracement from the highest high to the lowest low.<b>(Default is 0%)</b>
#hint Coefficient_1: Retracement Line 1: Retracement from the highest high to the lowest low.<b>(Default is 23.6%)</b>
#hint Coefficient_2: Retracement Line 2: Retracement from the highest high to the lowest low.<b>(Default is 38.2%)</b>
#hint Coefficient_3: Retracement Line 3: Retracement from the highest high to the lowest low.<b>(Default is 50%)</b>
#hint Coefficient_4: Retracement Line 4: Retracement from the highest high to the lowest low.<b>(Default is 61.8%)</b>
#hint Coefficient_5: Retracement Line 5: Retracement from the highest high to the lowest low.<b>(Default is 78.6%)</b>
#hint Coefficient_6: Retracement Line 6: Retracement from the highest high to the lowest low.<b>(Default is 100%)</b>

#wizard input: Price
#wizard text: Inputs: Price:
#wizard input: coefficient_0
#wizard text: coefficient_0:
#wizard input: Coefficient_1
#wizard text: Coefficient_1:
#wizard input: Coefficient_2
#wizard text: Coefficient_2:
#wizard input: Coefficient_3
#wizard text: Coefficient_3:
#wizard input: Coefficient_4
#wizard text: Coefficient_4:
#wizard input: Coefficient_5
#wizard text: Coefficient_5:
#wizard input: Coefficient_6
#wizard text: Coefficient_6:

input price = close;
input high = high;
input low = low;
input coefficient_0 = 0.000;
input coefficient_1 = .236;
input Coefficient_2 = .382;
input Coefficient_3 = .500;
input Coefficient_4 = .618;
input Coefficient_5 = .786;
input Coefficient_6 = 1.000;
input Coefficient_7 = .705;
input Coefficient_8 = .900;

input LabelColor = {default "MAGENTA", "CYAN", "PINK", "LIGHT_GRAY", "ORANGE", "RED", "GREEN", "GRAY", "WHITE"};
input n = 3;

def n1  = n + 1;

def lastdayhigh =
     if getday()>getlastday() then double.nan  
else if getday()==getlastday() then high
else if high> lastdayhigh[1] then high
else double.nan;

def lastdaylow  = CompoundValue(1,
     if getday()>getlastday() then double.nan
else if getday()==getlastday() then 0
else if getday() != getday()[1] then low
else if low < lastdaylow[1] then low
else lastdaylow[1], low);

def a = highestall(lastdayhigh);
def b = lowestall(lastdaylow);
def b1 = if b==0 and getday()==getlastday() then barnumber() else double.nan;
def barnumber = BarNumber();
def c = if high == a then barnumber else Double.NaN;
def d = if b!=0 and low == b then barnumber else if b==0 then b1 else Double.NaN;
rec highnumber = CompoundValue(1, if IsNaN(c) then highnumber[1] else c, c);
def highnumberall = HighestAll(highnumber);
rec lownumber = CompoundValue(1, if IsNaN(d) then lownumber[1] else d, d);
def lownumberall = LowestAll(lownumber);

def upward = highnumberall > lownumberall;
def downward = highnumberall < lownumberall;

def x = AbsValue(lownumberall - highnumberall );

def slope = (a - b) / x;
def slopelow = (b - a) / x;

def day = GetDay();
def month = GetMonth();
def year = GetYear();
def lastDay = GetLastDay();
def lastmonth = GetLastMonth();
def lastyear = GetLastYear();
def isToday = If(day == lastDay and month == lastmonth and year == lastyear, 1, 0);
def istodaybarnumber = HighestAll(if isToday then barnumber else Double.NaN);
def line = b + (slope * (barnumber - lownumber));
def linelow = a + (slopelow * (barnumber - highnumber));
def currentlinelow = if barnumber <= lownumberall then linelow else Double.NaN;
def currentline = if barnumber <= highnumberall then line else Double.NaN;

plot FibFan =  if  downward then currentlinelow else if upward then currentline else Double.NaN;
FibFan.SetStyle(Curve.SHORT_DASH);
FibFan.AssignValueColor(Color.RED);
FibFan.HideBubble();

def range =  a - b;

def value0 = range * coefficient_0;
def value1 = range * coefficient_1;
def value2 = range * Coefficient_2;
def value3 = range * Coefficient_3;
def value4 = range * Coefficient_4;
def value5 = range * Coefficient_5;
def value6 = range * Coefficient_6;
def value7 = range * Coefficient_7;
def value8 = range * Coefficient_8;

def condition1 = downward and barnumber >= highnumberall;
def condition2 = upward and barnumber >= lownumberall;

plot Retracement0 = if condition1 then HighestAll(b + value0) else if condition2 then HighestAll(a - value0) else Double.NaN;
plot Retracement1 = if condition1 then HighestAll(b + value1) else if condition2 then HighestAll(a - value1) else Double.NaN;
plot Retracement2 = if condition1 then HighestAll(b + value2) else if condition2 then HighestAll(a - value2) else Double.NaN;
plot Retracement3 = if condition1 then HighestAll(b + value3) else if condition2 then HighestAll(a - value3) else Double.NaN;
plot Retracement4 = if condition1 then HighestAll(b + value4) else if condition2 then HighestAll(a - value4) else Double.NaN;
plot Retracement5 = if condition1 then HighestAll(b + value5) else if condition2 then HighestAll(a - value5) else Double.NaN;
plot Retracement6 = if condition1 then HighestAll(b + value6) else if condition2 then HighestAll(a - value6) else Double.NaN;
plot Retracement7 = if condition1 then HighestAll(b + value7) else if condition2 then HighestAll(a - value7) else Double.NaN;
plot Retracement8 = if condition1 then HighestAll(b + value8) else if condition2 then HighestAll(a - value8) else Double.NaN;

#Retracement0.AssignValueColor(CreateColor(255, 255, 255));
Retracement0.SetLineWeight(4);
Retracement0.HideBubble();
AddChartBubble((downward and close[n1]) and IsNaN(close[n]), Retracement0, Concat( (coefficient_0 * 100), "% ") + astext(retracement0), retracement0.takevalueColor(), yes);
AddChartBubble((upward and close[n1]) and IsNaN(close[n]), Retracement0, Concat( (coefficient_0 * 100), "% ") + astext(retracement0), retracement0.takevalueColor(), yes);

#Retracement1.AssignValueColor(CreateColor(173, 216, 230));
Retracement1.SetLineWeight(2);
Retracement1.HideBubble();
AddChartBubble((downward and close[n1]) and IsNaN(close[n]), Retracement1, Concat( (coefficient_1 * 100), "% ") + astext(retracement1), retracement1.takevalueColor(), yes);
AddChartBubble((upward and close[n1]) and IsNaN(close[n]), Retracement1, Concat( (coefficient_1 * 100), "% ") + astext(retracement1), retracement1.takevalueColor(), yes);

#Retracement2.AssignValueColor(CreateColor(0, 197, 49));
Retracement2.SetLineWeight(2);
Retracement2.HideBubble();
AddChartBubble((downward and close[n1]) and IsNaN(close[n]), Retracement2, Concat( (Coefficient_2 * 100), "% ") + astext(retracement2), retracement2.takevalueColor(), yes);
AddChartBubble((upward and close[n1]) and IsNaN(close[n]), Retracement2, Concat( (Coefficient_2 * 100), "% ") + astext(retracement2), retracement2.takevalueColor(), yes);

#Retracement3.AssignValueColor(CreateColor(255, 64, 64));
Retracement3.SetLineWeight(3);
Retracement3.HideBubble();
AddChartBubble((downward and close[n1]) and IsNaN(close[n]), Retracement3, Concat( (Coefficient_3 * 100), "% ") + astext(retracement3), retracement3.takevalueColor(), yes);
AddChartBubble((upward and close[n1]) and IsNaN(close[n]), Retracement3, Concat( (Coefficient_3 * 100), "% ") + astext(retracement3), retracement3.takevalueColor(), yes);

#Retracement4.AssignValueColor(CreateColor(255, 215, 0));
Retracement4.SetLineWeight(5);
Retracement4.HideBubble();
AddChartBubble((downward and close[n1]) and IsNaN(close[n]), Retracement4, Concat( (Coefficient_4 * 100), "% ") + astext(retracement4), retracement4.takevalueColor(), yes);
AddChartBubble((upward and close[n1]) and IsNaN(close[n]), Retracement4, Concat( (Coefficient_4 * 100), "% ") + astext(retracement4), retracement4.takevalueColor(), yes);

#Retracement5.AssignValueColor(CreateColor(0, 255, 255));
Retracement5.SetLineWeight(2);
Retracement5.HideBubble();
AddChartBubble((downward and close[n1]) and IsNaN(close[n]), Retracement5, Concat( (Coefficient_5 * 100), "% ") + astext(retracement5), retracement5.takevalueColor(), yes);
AddChartBubble((upward and close[n1]) and IsNaN(close[n]), Retracement5, Concat( (Coefficient_5 * 100), "% ") + astext(retracement5), retracement5.takevalueColor(), yes);

#Retracement6.AssignValueColor(CreateColor(255, 255, 255));
Retracement6.SetLineWeight(4);
Retracement6.HideBubble();
AddChartBubble((downward and close[n1]) and IsNaN(close[n]), Retracement6, Concat( (Coefficient_6 * 100), "% ") + astext(retracement6), retracement6.takevalueColor(), yes);
AddChartBubble((upward and close[n1]) and IsNaN(close[n]), Retracement6, Concat( (Coefficient_6 * 100), "% ") + astext(retracement6), retracement6.takevalueColor(), yes);

#Retracement7.AssignValueColor(CreateColor(255, 255, 255));
Retracement7.SetLineWeight(4);
Retracement7.HideBubble();
AddChartBubble((downward and close[n1]) and IsNaN(close[n]), Retracement7, Concat( (Coefficient_7 * 100), "% ") + astext(retracement7), retracement7.takevalueColor(), yes);
AddChartBubble((upward and close[n1]) and IsNaN(close[n]), Retracement7, Concat( (Coefficient_7 * 100), "% ") + astext(retracement7), retracement7.takevalueColor(), yes);

#Retracement8.AssignValueColor(CreateColor(255, 255, 255));
Retracement8.SetLineWeight(4);
Retracement8.HideBubble();
AddChartBubble((downward and close[n1]) and IsNaN(close[n]), Retracement8, Concat( (Coefficient_8 * 100), "% ") + astext(retracement8), retracement8.takevalueColor(), yes);
AddChartBubble((upward and close[n1]) and IsNaN(close[n]), Retracement8, Concat( (Coefficient_8 * 100), "% ") + astext(retracement8), retracement8.takevalueColor(), yes);

Alert((price crosses below Retracement0) , "Price crosses below Retracement Line 0");
Alert((price crosses above Retracement0) , "Price crosses above Retracement Line 0");
Alert((price crosses below Retracement1) , "Price crosses below Retracement Line 1");
Alert((price crosses above Retracement1) , "Price crosses above Retracement Line 1");
Alert((price crosses below Retracement2) , "Price crosses below Retracement Line 2");
Alert((price crosses above Retracement2) , "Price crosses above Retracement Line 2");
Alert((price crosses below Retracement3) , "Price crosses below Retracement Line 3");
Alert((price crosses above Retracement3) , "Price crosses above Retracement Line 3");
Alert((price crosses below Retracement4) , "Price crosses below Retracement Line 4");
Alert((price crosses above Retracement4) , "Price crosses above Retracement Line 4");
Alert((price crosses below Retracement5) , "Price crosses below Retracement Line 5");
Alert((price crosses above Retracement5) , "Price crosses above Retracement Line 5");
Alert((price crosses below Retracement6) , "Price crosses below Retracement Line 6");
Alert((price crosses above Retracement6) , "Price crosses above Retracement Line 6");
# End Auto Fib v1.4
 
Last edited:
Good afternoon @SleepyZ, thanks for the modifications, now the indicator is plotting the levels correctly with the movement of the contract price on the current day. The colors in the bubbles that match the levels look great.
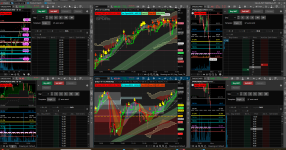
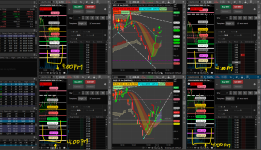
I attached a screenshoot with a grid of four option charts where I pointed out that the bubbles with the percentages and prices do not allow us to see the candles of the last 30 to 35 minutes. I don't know if it would be possible to add two more things to the indicator:
- Add a selector input to be able to select between 3 options:
1) the percentage and price together (the indicator already has it),
2) the percentage only option and
3) the price-only option.

- Add the bubblemover option.
Thank you very much @SleepyZ, for your help.
 

Attachments

  • Screenshot 2024-02-05 SPX_Four_Chart_Grid_with_Fibo_Indicator.png
    Screenshot 2024-02-05 SPX_Four_Chart_Grid_with_Fibo_Indicator.png
    446.7 KB · Views: 262
Good afternoon @SleepyZ, thanks for the modifications, now the indicator is plotting the levels correctly with the movement of the contract price on the current day. The colors in the bubbles that match the levels look great.
I attached a screenshoot with a grid of four option charts where I pointed out that the bubbles with the percentages and prices do not allow us to see the candles of the last 30 to 35 minutes. I don't know if it would be possible to add two more things to the indicator:
- Add a selector input to be able to select between 3 options:
1) the percentage and price together (the indicator already has it),
2) the percentage only option and
3) the price-only option.

- Add the bubblemover option.
Thank you very much @SleepyZ, for your help.

[Edit: See Post 372 https://usethinkscript.com/threads/...vels-indicator-for-thinkorswim.14/post-137860 for final code for OPTIONS ONLY autofibs]

A bubblemover was added. The image shows a -130 to move the bubbles to the left as an example.

It looks like you can also try to decrease you active traders to pick up some additional space to accomodate the bubbles.

Screenshot 2024-02-06 080332.png
Code:
# Auto Fib V1.4
# tomsk
# 11.19.2019

# Automatically draws fibonacci retracements using the highest price and lowest price
# from the current view and timeframe.
#
# Fibonacci retracements use horizontal lines to indicate areas of support or resistance
# at the key Fibonacci levels before it continues in the original direction. These levels
# are created by drawing a trendline between two extreme points and then dividing the
# vertical distance by the key Fibonacci ratios of: 23.6%, 38.2%, 50%, 61.8%, 78.6%, and 100%.

# CHANGE LOG
#
# V1.0 - 12.18.2018 - BenTen       - Initial release of Auto Fib, created by Ryan Hendricks
# V1.1 - 11.15.2019 - theelderwand - As script was difficult to read, made the following enhancements
#                                    Expands to right
#                                    Doesn't expand to left
#                                    Custom colors for Fibonacci bars (0.618 is GOLD color)
#                                    Custom line weights
#                                    Code is modularized so you can add extra plots as needed
# V1.2 - 11.15.2019 - tomsk        - Added an input selector for the colors of the label. You
#                                    can select from any of the colors listed - red, orange,
#                                    green, etc and bubbles for all the fib retracements will
#                                    utilize that color.
# V1.3 - 11.19.2019 - tomsk        - Modified the AddChartBubbles to be displayed on the right
#                                    side of the chart. Please ensure that you increase the
#                                    expansion area to that the bubbles have room to be displayed
#                                    Chart Settings > Time Axis > Expansion Area

# V1.4 - 20240203 - Sleepyz        - Modified to work for Options for only the last day. There the
#                                    low was defaulted to 0 as requested by the requestor. 2 fibs added


#hint Price: Price used in the alerts on crossing retracement lines. <b>(Default is Close)</b>

#hint coefficient_0: Retracement Line 0: Retracement from the highest high to the lowest low.<b>(Default is 0%)</b>
#hint Coefficient_1: Retracement Line 1: Retracement from the highest high to the lowest low.<b>(Default is 23.6%)</b>
#hint Coefficient_2: Retracement Line 2: Retracement from the highest high to the lowest low.<b>(Default is 38.2%)</b>
#hint Coefficient_3: Retracement Line 3: Retracement from the highest high to the lowest low.<b>(Default is 50%)</b>
#hint Coefficient_4: Retracement Line 4: Retracement from the highest high to the lowest low.<b>(Default is 61.8%)</b>
#hint Coefficient_5: Retracement Line 5: Retracement from the highest high to the lowest low.<b>(Default is 78.6%)</b>
#hint Coefficient_6: Retracement Line 6: Retracement from the highest high to the lowest low.<b>(Default is 100%)</b>

#wizard input: Price
#wizard text: Inputs: Price:
#wizard input: coefficient_0
#wizard text: coefficient_0:
#wizard input: Coefficient_1
#wizard text: Coefficient_1:
#wizard input: Coefficient_2
#wizard text: Coefficient_2:
#wizard input: Coefficient_3
#wizard text: Coefficient_3:
#wizard input: Coefficient_4
#wizard text: Coefficient_4:
#wizard input: Coefficient_5
#wizard text: Coefficient_5:
#wizard input: Coefficient_6
#wizard text: Coefficient_6:

input bubblemover = 1;
input price = close;
input high = high;
input low = low;
input coefficient_0 = 0.000;
input coefficient_1 = .236;
input Coefficient_2 = .382;
input Coefficient_3 = .500;
input Coefficient_4 = .618;
input Coefficient_5 = .786;
input Coefficient_6 = 1.000;
input Coefficient_7 = .705;
input Coefficient_8 = .900;

input LabelColor = {default "MAGENTA", "CYAN", "PINK", "LIGHT_GRAY", "ORANGE", "RED", "GREEN", "GRAY", "WHITE"};
input n = 3;

def n1  = n + 1;

def lastdayhigh =
     if GetDay() > GetLastDay() then Double.NaN  
else if GetDay() == GetLastDay() then high
else if high > lastdayhigh[1] then high
else Double.NaN;

def lastdaylow  = CompoundValue(1,
     if GetDay() > GetLastDay() then Double.NaN
else if GetDay() == GetLastDay() then 0
else if GetDay() != GetDay()[1] then low
else if low < lastdaylow[1] then low
else lastdaylow[1], low);

def a = HighestAll(lastdayhigh);
def b = LowestAll(lastdaylow);
def b1 = if b == 0 and GetDay() == GetLastDay() then BarNumber() else Double.NaN;
def barnumber = BarNumber();
def c = if high == a then barnumber else Double.NaN;
def d = if b != 0 and low == b then barnumber else if b == 0 then b1 else Double.NaN;
rec highnumber = CompoundValue(1, if IsNaN(c) then highnumber[1] else c, c);
def highnumberall = HighestAll(highnumber);
rec lownumber = CompoundValue(1, if IsNaN(d) then lownumber[1] else d, d);
def lownumberall = LowestAll(lownumber);

def upward = highnumberall > lownumberall;
def downward = highnumberall < lownumberall;

def x = AbsValue(lownumberall - highnumberall );

def slope = (a - b) / x;
def slopelow = (b - a) / x;

def day = GetDay();
def month = GetMonth();
def year = GetYear();
def lastDay = GetLastDay();
def lastmonth = GetLastMonth();
def lastyear = GetLastYear();
def isToday = If(day == lastDay and month == lastmonth and year == lastyear, 1, 0);
def istodaybarnumber = HighestAll(if isToday then barnumber else Double.NaN);
def line = b + (slope * (barnumber - lownumber));
def linelow = a + (slopelow * (barnumber - highnumber));
def currentlinelow = if barnumber <= lownumberall then linelow else Double.NaN;
def currentline = if barnumber <= highnumberall then line else Double.NaN;

plot FibFan =  if  downward then currentlinelow else if upward then currentline else Double.NaN;
FibFan.SetStyle(Curve.SHORT_DASH);
FibFan.AssignValueColor(Color.RED);
FibFan.HideBubble();

def range =  a - b;

def value0 = range * coefficient_0;
def value1 = range * coefficient_1;
def value2 = range * Coefficient_2;
def value3 = range * Coefficient_3;
def value4 = range * Coefficient_4;
def value5 = range * Coefficient_5;
def value6 = range * Coefficient_6;
def value7 = range * Coefficient_7;
def value8 = range * Coefficient_8;

def condition1 = downward and barnumber >= highnumberall;
def condition2 = upward and barnumber >= lownumberall;

plot Retracement0 = if condition1 then HighestAll(b + value0) else if condition2 then HighestAll(a - value0) else Double.NaN;
plot Retracement1 = if condition1 then HighestAll(b + value1) else if condition2 then HighestAll(a - value1) else Double.NaN;
plot Retracement2 = if condition1 then HighestAll(b + value2) else if condition2 then HighestAll(a - value2) else Double.NaN;
plot Retracement3 = if condition1 then HighestAll(b + value3) else if condition2 then HighestAll(a - value3) else Double.NaN;
plot Retracement4 = if condition1 then HighestAll(b + value4) else if condition2 then HighestAll(a - value4) else Double.NaN;
plot Retracement5 = if condition1 then HighestAll(b + value5) else if condition2 then HighestAll(a - value5) else Double.NaN;
plot Retracement6 = if condition1 then HighestAll(b + value6) else if condition2 then HighestAll(a - value6) else Double.NaN;
plot Retracement7 = if condition1 then HighestAll(b + value7) else if condition2 then HighestAll(a - value7) else Double.NaN;
plot Retracement8 = if condition1 then HighestAll(b + value8) else if condition2 then HighestAll(a - value8) else Double.NaN;

##############
def bm = bubblemover;
#Retracement0.AssignValueColor(CreateColor(255, 255, 255));
Retracement0.SetLineWeight(4);
Retracement0.HideBubble();
AddChartBubble((downward and close[bm + 1]) and IsNaN(close[bm]), Retracement0, Concat( (coefficient_0 * 100), "% ") + AsText(Retracement0), Retracement0.TakeValueColor(), yes);
AddChartBubble((upward and close[bm + 1]) and IsNaN(close[bm]), Retracement0, Concat( (coefficient_0 * 100), "% ") + AsText(Retracement0), Retracement0.TakeValueColor(), yes);

#Retracement1.AssignValueColor(CreateColor(173, 216, 230));
Retracement1.SetLineWeight(2);
Retracement1.HideBubble();
AddChartBubble((downward and close[bm + 1]) and IsNaN(close[bm]), Retracement1, Concat( (coefficient_1 * 100), "% ") + AsText(Retracement1), Retracement1.TakeValueColor(), yes);
AddChartBubble((upward and close[bm + 1]) and IsNaN(close[bm]), Retracement1, Concat( (coefficient_1 * 100), "% ") + AsText(Retracement1), Retracement1.TakeValueColor(), yes);

#Retracement2.AssignValueColor(CreateColor(0, 197, 49));
Retracement2.SetLineWeight(2);
Retracement2.HideBubble();
AddChartBubble((downward and close[bm + 1]) and IsNaN(close[bm]), Retracement2, Concat( (Coefficient_2 * 100), "% ") + AsText(Retracement2), Retracement2.TakeValueColor(), yes);
AddChartBubble((upward and close[bm + 1]) and IsNaN(close[bm]), Retracement2, Concat( (Coefficient_2 * 100), "% ") + AsText(Retracement2), Retracement2.TakeValueColor(), yes);

#Retracement3.AssignValueColor(CreateColor(255, 64, 64));
Retracement3.SetLineWeight(3);
Retracement3.HideBubble();
AddChartBubble((downward and close[bm + 1]) and IsNaN(close[bm]), Retracement3, Concat( (Coefficient_3 * 100), "% ") + AsText(Retracement3), Retracement3.TakeValueColor(), yes);
AddChartBubble((upward and close[bm + 1]) and IsNaN(close[bm]), Retracement3, Concat( (Coefficient_3 * 100), "% ") + AsText(Retracement3), Retracement3.TakeValueColor(), yes);

#Retracement4.AssignValueColor(CreateColor(255, 215, 0));
Retracement4.SetLineWeight(5);
Retracement4.HideBubble();
AddChartBubble((downward and close[bm + 1]) and IsNaN(close[bm]), Retracement4, Concat( (Coefficient_4 * 100), "% ") + AsText(Retracement4), Retracement4.TakeValueColor(), yes);
AddChartBubble((upward and close[bm + 1]) and IsNaN(close[bm]), Retracement4, Concat( (Coefficient_4 * 100), "% ") + AsText(Retracement4), Retracement4.TakeValueColor(), yes);

#Retracement5.AssignValueColor(CreateColor(0, 255, 255));
Retracement5.SetLineWeight(2);
Retracement5.HideBubble();
AddChartBubble((downward and close[bm + 1]) and IsNaN(close[bm]), Retracement5, Concat( (Coefficient_5 * 100), "% ") + AsText(Retracement5), Retracement5.TakeValueColor(), yes);
AddChartBubble((upward and close[bm + 1]) and IsNaN(close[bm]), Retracement5, Concat( (Coefficient_5 * 100), "% ") + AsText(Retracement5), Retracement5.TakeValueColor(), yes);

#Retracement6.AssignValueColor(CreateColor(255, 255, 255));
Retracement6.SetLineWeight(4);
Retracement6.HideBubble();
AddChartBubble((downward and close[bm + 1]) and IsNaN(close[bm]), Retracement6, Concat( (Coefficient_6 * 100), "% ") + AsText(Retracement6), Retracement6.TakeValueColor(), yes);
AddChartBubble((upward and close[bm + 1]) and IsNaN(close[bm]), Retracement6, Concat( (Coefficient_6 * 100), "% ") + AsText(Retracement6), Retracement6.TakeValueColor(), yes);

#Retracement7.AssignValueColor(CreateColor(255, 255, 255));
Retracement7.SetLineWeight(4);
Retracement7.HideBubble();
AddChartBubble((downward and close[bm + 1]) and IsNaN(close[bm]), Retracement7, Concat( (Coefficient_7 * 100), "% ") + AsText(Retracement7), Retracement7.TakeValueColor(), yes);
AddChartBubble((upward and close[bm + 1]) and IsNaN(close[bm]), Retracement7, Concat( (Coefficient_7 * 100), "% ") + AsText(Retracement7), Retracement7.TakeValueColor(), yes);

#Retracement8.AssignValueColor(CreateColor(255, 255, 255));
Retracement8.SetLineWeight(4);
Retracement8.HideBubble();
AddChartBubble((downward and close[bm + 1]) and IsNaN(close[bm]), Retracement8, Concat( (Coefficient_8 * 100), "% ") + AsText(Retracement8), Retracement8.TakeValueColor(), yes);
AddChartBubble((upward and close[bm + 1]) and IsNaN(close[bm]), Retracement8, Concat( (Coefficient_8 * 100), "% ") + AsText(Retracement8), Retracement8.TakeValueColor(), yes);

Alert((price crosses below Retracement0) , "Price crosses below Retracement Line 0");
Alert((price crosses above Retracement0) , "Price crosses above Retracement Line 0");
Alert((price crosses below Retracement1) , "Price crosses below Retracement Line 1");
Alert((price crosses above Retracement1) , "Price crosses above Retracement Line 1");
Alert((price crosses below Retracement2) , "Price crosses below Retracement Line 2");
Alert((price crosses above Retracement2) , "Price crosses above Retracement Line 2");
Alert((price crosses below Retracement3) , "Price crosses below Retracement Line 3");
Alert((price crosses above Retracement3) , "Price crosses above Retracement Line 3");
Alert((price crosses below Retracement4) , "Price crosses below Retracement Line 4");
Alert((price crosses above Retracement4) , "Price crosses above Retracement Line 4");
Alert((price crosses below Retracement5) , "Price crosses below Retracement Line 5");
Alert((price crosses above Retracement5) , "Price crosses above Retracement Line 5");
Alert((price crosses below Retracement6) , "Price crosses below Retracement Line 6");
Alert((price crosses above Retracement6) , "Price crosses above Retracement Line 6");
# End Auto Fib v1.4
 
Last edited:
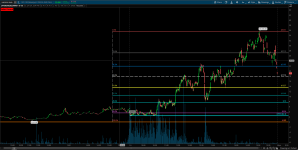
A bubblemover was added. The image shows a -130 to move the bubbles to the left as an example.

It looks like you can also try to decrease you active traders to pick up some additional space to accomodate the bubbles.
Good morning @SleepyZ, thank you for the adjusments. Today I open some spx contracts and the auto fibo indicator is not plotting the levels, I dont know what could be the issue with the indicator. Thank you
 

Attachments

  • Screenshot 2024-02-07 SPX_Call_Auto_Fibo_Indicator_No_Plotting_Levels.png
    Screenshot 2024-02-07 SPX_Call_Auto_Fibo_Indicator_No_Plotting_Levels.png
    79.7 KB · Views: 131
Good morning @SleepyZ, thank you for the adjusments. Today I open some spx contracts and the auto fibo indicator is not plotting the levels, I dont know what could be the issue with the indicator. Thank you

[Edit: See Post 372 https://usethinkscript.com/threads/...vels-indicator-for-thinkorswim.14/post-137860 for final code for OPTIONS ONLY autofibs]

It is working on my chart at this time. If it is not workiing on yours, check the settings of my chart in the following link or provide me a link to your chart.
https://tos.mx/kEnsbmJ

Screenshot 2024-02-07 091907.png
 
Last edited:
ahramper1 said:
Good morning @SleepyZ, thank you for the adjusments. Today I open some spx contracts and the auto fibo indicator is not plotting the levels, I dont know what could be the issue with the indicator. Thank you

[Edit: See Post 372 https://usethinkscript.com/threads/...vels-indicator-for-thinkorswim.14/post-137860 for final code for OPTIONS ONLY autofibs]

I think I might have the found and fixed the problem you were having.

I was able to test this in ONDemand. Apparantly, the lastdayhigh and related def a were not populating correctly. To fix this I decided to make this version only work with OPTIONS, rather than keeping aspects of the original code that were causing the problem. ONDemand was not actively moving the OPTION price bars, so I had to manually move then. So I an not sure this code will work in LIVE trading.

Screenshot 2024-02-07 135538.png
Code:
# Auto Fib V1.4 - FOR USE WITH OPTIONS ONLY
# tomsk
# 11.19.2019

# Automatically draws fibonacci retracements using the highest price and lowest price
# from the current view and timeframe.
#
# Fibonacci retracements use horizontal lines to indicate areas of support or resistance
# at the key Fibonacci levels before it continues in the original direction. These levels
# are created by drawing a trendline between two extreme points and then dividing the
# vertical distance by the key Fibonacci ratios of: 23.6%, 38.2%, 50%, 61.8%, 78.6%, and 100%.

# CHANGE LOG
#
# V1.0 - 12.18.2018 - BenTen       - Initial release of Auto Fib, created by Ryan Hendricks
# V1.1 - 11.15.2019 - theelderwand - As script was difficult to read, made the following enhancements
#                                    Expands to right
#                                    Doesn't expand to left
#                                    Custom colors for Fibonacci bars (0.618 is GOLD color)
#                                    Custom line weights
#                                    Code is modularized so you can add extra plots as needed
# V1.2 - 11.15.2019 - tomsk        - Added an input selector for the colors of the label. You
#                                    can select from any of the colors listed - red, orange,
#                                    green, etc and bubbles for all the fib retracements will
#                                    utilize that color.
# V1.3 - 11.19.2019 - tomsk        - Modified the AddChartBubbles to be displayed on the right
#                                    side of the chart. Please ensure that you increase the
#                                    expansion area to that the bubbles have room to be displayed
#                                    Chart Settings > Time Axis > Expansion Area

# V1.4 - 20240203 - Sleepyz        - Modified to work specifically for Options for only the last #                                    day.      
#                                    low was defaulted to 0 as requested by the requestor.
#                                    2 fibs added


#hint Price: Price used in the alerts on crossing retracement lines. <b>(Default is Close)</b>

#hint coefficient_0: Retracement Line 0: Retracement from the highest high to the lowest low.<b>(Default is 0%)</b>
#hint Coefficient_1: Retracement Line 1: Retracement from the highest high to the lowest low.<b>(Default is 23.6%)</b>
#hint Coefficient_2: Retracement Line 2: Retracement from the highest high to the lowest low.<b>(Default is 38.2%)</b>
#hint Coefficient_3: Retracement Line 3: Retracement from the highest high to the lowest low.<b>(Default is 50%)</b>
#hint Coefficient_4: Retracement Line 4: Retracement from the highest high to the lowest low.<b>(Default is 61.8%)</b>
#hint Coefficient_5: Retracement Line 5: Retracement from the highest high to the lowest low.<b>(Default is 78.6%)</b>
#hint Coefficient_6: Retracement Line 6: Retracement from the highest high to the lowest low.<b>(Default is 100%)</b>

#wizard input: Price
#wizard text: Inputs: Price:
#wizard input: coefficient_0
#wizard text: coefficient_0:
#wizard input: Coefficient_1
#wizard text: Coefficient_1:
#wizard input: Coefficient_2
#wizard text: Coefficient_2:
#wizard input: Coefficient_3
#wizard text: Coefficient_3:
#wizard input: Coefficient_4
#wizard text: Coefficient_4:
#wizard input: Coefficient_5
#wizard text: Coefficient_5:
#wizard input: Coefficient_6
#wizard text: Coefficient_6:

input bubblemover = 1;
input price = close;
input high = high;
input low = low;
input coefficient_0 = 0.000;
input coefficient_1 = .236;
input Coefficient_2 = .382;
input Coefficient_3 = .500;
input Coefficient_4 = .618;
input Coefficient_5 = .786;
input Coefficient_6 = 1.000;
input Coefficient_7 = .705;
input Coefficient_8 = .900;

input LabelColor = {default "MAGENTA", "CYAN", "PINK", "LIGHT_GRAY", "ORANGE", "RED", "GREEN", "GRAY", "WHITE"};
input n = 3;

def n1  = n + 1;

def lastdayhigh = compoundvalue(1,
     if GetDay() > GetLastDay() then Double.NaN
else if GetDay() == GetLastDay() then high
else if high > lastdayhigh[1] then high
else lastdayhigh[1], double.nan);


def lastdaylow  = CompoundValue(1,
     if GetDay() > GetLastDay() then Double.NaN
else if GetDay() == GetLastDay() then 0
else if low < lastdaylow[1] then low
else lastdaylow[1], double.nan);

def a = lastdayhigh;
#addchartBubble(getday()==getlastday(), high, high + "\n" +a);

def b = lastdaylow;
def b1 = if b == 0 and GetDay() == GetLastDay() then BarNumber() else Double.NaN;
def barnumber = BarNumber();
def c = if high == a then barnumber else Double.NaN;
def d = if b != 0 and low == b then barnumber else if b == 0 then b1 else Double.NaN;
rec highnumber = CompoundValue(1, if IsNaN(c) then highnumber[1] else c, c);
def highnumberall = HighestAll(highnumber);
rec lownumber = CompoundValue(1, if IsNaN(d) then lownumber[1] else d, d);
def lownumberall = LowestAll(lownumber);

def upward = highnumberall > lownumberall;
def downward = highnumberall < lownumberall;

def x = AbsValue(lownumberall - highnumberall );

def slope = (a - b) / x;
def slopelow = (b - a) / x;

def day = GetDay();
def month = GetMonth();
def year = GetYear();
def lastDay = GetLastDay();
def lastmonth = GetLastMonth();
def lastyear = GetLastYear();
def isToday = If(day == lastDay and month == lastmonth and year == lastyear, 1, 0);
def istodaybarnumber = HighestAll(if isToday then barnumber else Double.NaN);
def line = b + (slope * (barnumber - lownumber));
def linelow = a + (slopelow * (barnumber - highnumber));
def currentlinelow = if barnumber <= lownumberall then linelow else Double.NaN;
def currentline = if barnumber <= highnumberall then line else Double.NaN;

plot FibFan =  if  downward then currentlinelow else if upward then currentline else Double.NaN;
FibFan.SetStyle(Curve.SHORT_DASH);
FibFan.AssignValueColor(Color.RED);
FibFan.HideBubble();

def range =  a - b;

def value0 = range * coefficient_0;
def value1 = range * coefficient_1;
def value2 = range * Coefficient_2;
def value3 = range * Coefficient_3;
def value4 = range * Coefficient_4;
def value5 = range * Coefficient_5;
def value6 = range * Coefficient_6;
def value7 = range * Coefficient_7;
def value8 = range * Coefficient_8;

def condition1 = downward and barnumber >= highnumberall;
def condition2 = upward and barnumber >= lownumberall;

plot Retracement0 = if condition1 then HighestAll(b + value0) else if condition2 then HighestAll(a - value0) else Double.NaN;
plot Retracement1 = if condition1 then HighestAll(b + value1) else if condition2 then HighestAll(a - value1) else Double.NaN;
plot Retracement2 = if condition1 then HighestAll(b + value2) else if condition2 then HighestAll(a - value2) else Double.NaN;
plot Retracement3 = if condition1 then HighestAll(b + value3) else if condition2 then HighestAll(a - value3) else Double.NaN;
plot Retracement4 = if condition1 then HighestAll(b + value4) else if condition2 then HighestAll(a - value4) else Double.NaN;
plot Retracement5 = if condition1 then HighestAll(b + value5) else if condition2 then HighestAll(a - value5) else Double.NaN;
plot Retracement6 = if condition1 then HighestAll(b + value6) else if condition2 then HighestAll(a - value6) else Double.NaN;
plot Retracement7 = if condition1 then HighestAll(b + value7) else if condition2 then HighestAll(a - value7) else Double.NaN;
plot Retracement8 = if condition1 then HighestAll(b + value8) else if condition2 then HighestAll(a - value8) else Double.NaN;

##############
def bm = bubblemover;
#Retracement0.AssignValueColor(CreateColor(255, 255, 255));
Retracement0.SetLineWeight(4);
Retracement0.HideBubble();
AddChartBubble((downward and close[bm + 1]) and IsNaN(close[bm]), Retracement0, Concat( (coefficient_0 * 100), "% ") + AsText(Retracement0), Retracement0.TakeValueColor(), yes);
AddChartBubble((upward and close[bm + 1]) and IsNaN(close[bm]), Retracement0, Concat( (coefficient_0 * 100), "% ") + AsText(Retracement0), Retracement0.TakeValueColor(), yes);

#Retracement1.AssignValueColor(CreateColor(173, 216, 230));
Retracement1.SetLineWeight(2);
Retracement1.HideBubble();
AddChartBubble((downward and close[bm + 1]) and IsNaN(close[bm]), Retracement1, Concat( (coefficient_1 * 100), "% ") + AsText(Retracement1), Retracement1.TakeValueColor(), yes);
AddChartBubble((upward and close[bm + 1]) and IsNaN(close[bm]), Retracement1, Concat( (coefficient_1 * 100), "% ") + AsText(Retracement1), Retracement1.TakeValueColor(), yes);

#Retracement2.AssignValueColor(CreateColor(0, 197, 49));
Retracement2.SetLineWeight(2);
Retracement2.HideBubble();
AddChartBubble((downward and close[bm + 1]) and IsNaN(close[bm]), Retracement2, Concat( (Coefficient_2 * 100), "% ") + AsText(Retracement2), Retracement2.TakeValueColor(), yes);
AddChartBubble((upward and close[bm + 1]) and IsNaN(close[bm]), Retracement2, Concat( (Coefficient_2 * 100), "% ") + AsText(Retracement2), Retracement2.TakeValueColor(), yes);

#Retracement3.AssignValueColor(CreateColor(255, 64, 64));
Retracement3.SetLineWeight(3);
Retracement3.HideBubble();
AddChartBubble((downward and close[bm + 1]) and IsNaN(close[bm]), Retracement3, Concat( (Coefficient_3 * 100), "% ") + AsText(Retracement3), Retracement3.TakeValueColor(), yes);
AddChartBubble((upward and close[bm + 1]) and IsNaN(close[bm]), Retracement3, Concat( (Coefficient_3 * 100), "% ") + AsText(Retracement3), Retracement3.TakeValueColor(), yes);

#Retracement4.AssignValueColor(CreateColor(255, 215, 0));
Retracement4.SetLineWeight(5);
Retracement4.HideBubble();
AddChartBubble((downward and close[bm + 1]) and IsNaN(close[bm]), Retracement4, Concat( (Coefficient_4 * 100), "% ") + AsText(Retracement4), Retracement4.TakeValueColor(), yes);
AddChartBubble((upward and close[bm + 1]) and IsNaN(close[bm]), Retracement4, Concat( (Coefficient_4 * 100), "% ") + AsText(Retracement4), Retracement4.TakeValueColor(), yes);

#Retracement5.AssignValueColor(CreateColor(0, 255, 255));
Retracement5.SetLineWeight(2);
Retracement5.HideBubble();
AddChartBubble((downward and close[bm + 1]) and IsNaN(close[bm]), Retracement5, Concat( (Coefficient_5 * 100), "% ") + AsText(Retracement5), Retracement5.TakeValueColor(), yes);
AddChartBubble((upward and close[bm + 1]) and IsNaN(close[bm]), Retracement5, Concat( (Coefficient_5 * 100), "% ") + AsText(Retracement5), Retracement5.TakeValueColor(), yes);

#Retracement6.AssignValueColor(CreateColor(255, 255, 255));
Retracement6.SetLineWeight(4);
Retracement6.HideBubble();
AddChartBubble((downward and close[bm + 1]) and IsNaN(close[bm]), Retracement6, Concat( (Coefficient_6 * 100), "% ") + AsText(Retracement6), Retracement6.TakeValueColor(), yes);
AddChartBubble((upward and close[bm + 1]) and IsNaN(close[bm]), Retracement6, Concat( (Coefficient_6 * 100), "% ") + AsText(Retracement6), Retracement6.TakeValueColor(), yes);

#Retracement7.AssignValueColor(CreateColor(255, 255, 255));
Retracement7.SetLineWeight(4);
Retracement7.HideBubble();
AddChartBubble((downward and close[bm + 1]) and IsNaN(close[bm]), Retracement7, Concat( (Coefficient_7 * 100), "% ") + AsText(Retracement7), Retracement7.TakeValueColor(), yes);
AddChartBubble((upward and close[bm + 1]) and IsNaN(close[bm]), Retracement7, Concat( (Coefficient_7 * 100), "% ") + AsText(Retracement7), Retracement7.TakeValueColor(), yes);

#Retracement8.AssignValueColor(CreateColor(255, 255, 255));
Retracement8.SetLineWeight(4);
Retracement8.HideBubble();
AddChartBubble((downward and close[bm + 1]) and IsNaN(close[bm]), Retracement8, Concat( (Coefficient_8 * 100), "% ") + AsText(Retracement8), Retracement8.TakeValueColor(), yes);
AddChartBubble((upward and close[bm + 1]) and IsNaN(close[bm]), Retracement8, Concat( (Coefficient_8 * 100), "% ") + AsText(Retracement8), Retracement8.TakeValueColor(), yes);

Alert((price crosses below Retracement0) , "Price crosses below Retracement Line 0");
Alert((price crosses above Retracement0) , "Price crosses above Retracement Line 0");
Alert((price crosses below Retracement1) , "Price crosses below Retracement Line 1");
Alert((price crosses above Retracement1) , "Price crosses above Retracement Line 1");
Alert((price crosses below Retracement2) , "Price crosses below Retracement Line 2");
Alert((price crosses above Retracement2) , "Price crosses above Retracement Line 2");
Alert((price crosses below Retracement3) , "Price crosses below Retracement Line 3");
Alert((price crosses above Retracement3) , "Price crosses above Retracement Line 3");
Alert((price crosses below Retracement4) , "Price crosses below Retracement Line 4");
Alert((price crosses above Retracement4) , "Price crosses above Retracement Line 4");
Alert((price crosses below Retracement5) , "Price crosses below Retracement Line 5");
Alert((price crosses above Retracement5) , "Price crosses above Retracement Line 5");
Alert((price crosses below Retracement6) , "Price crosses below Retracement Line 6");
Alert((price crosses above Retracement6) , "Price crosses above Retracement Line 6");
# End Auto Fib v1.4
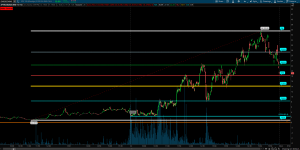
 
Last edited:
Good morning @SleepyZ, thank you for the adjusments. Today I open some spx contracts and the auto fibo indicator is not plotting the levels, I dont know what could be the issue with the indicator. Thank you
Good afternoon @SleepyZ after I send the message in the morning the indicator plotted the levels on the charts. Thank you for the modifications.
 
I think I might have the found and fixed the problem you were having.

I was able to test this in ONDemand. Apparantly, the lastdayhigh and related def a were not populating correctly. To fix this I decided to make this version only work with OPTIONS, rather than keeping aspects of the original code that were causing the problem. ONDemand was not actively moving the OPTION price bars, so I had to manually move then. So I an bit sure this code will work in LIVE trading.
Good afternoon @SleepyZ, I'm going to test the new indicator with the modifications.

Today when I started having issues with the indicator I tried to see if the indicator could plot fibo levels in other stock options contracts (call or put) like TSLA, and if the problem was only with the SPX contracts.
I attached screenshoots with a 3 days 1 minute chart for TSLA Call 192.5, and the indicator does what was the original requirement, of just plotting the fibo levels of the current day's contract, (like the SPX 0DTE intraday contracts), but today I saw If you wanted to know (for example TSLA Call 192.5) how the price of the contract moved in the previous days through the fibo levels and do an analysis, that is not possible because the indicator only plots the levels of the current day. I was wondering if another function could be added to the indicator so that it could show the fibo levels for each day of the previous days of the chart timeframe (Scrennshoot 2), and the option that the bubbles with the percentage and price would only be shown for the current day . Thank you very much @SllepyZ.
 

Attachments

  • Screenshot 2024-02-07 TSLA 4_Days_Chart.png
    Screenshot 2024-02-07 TSLA 4_Days_Chart.png
    116.1 KB · Views: 144
  • Screenshot 2024-02-07 TSLA_3days_1minute_Chart_with_Fibo_Levels.png
    Screenshot 2024-02-07 TSLA_3days_1minute_Chart_with_Fibo_Levels.png
    178.8 KB · Views: 144
Last edited:
I think I might have the found and fixed the problem you were having.

I was able to test this in ONDemand. Apparantly, the lastdayhigh and related def a were not populating correctly. To fix this I decided to make this version only work with OPTIONS, rather than keeping aspects of the original code that were causing the problem. ONDemand was not actively moving the OPTION price bars, so I had to manually move then. So I an not sure this code will work in LIVE trading.
Hi @SleepyZ, with respect to the indicator the first high of the day in the options contracts, anchor 2 (0%) is the opening price of the contract (call or put), each new day at 9:30 am that the market opens, each strike has an initial price, and that initial price is our first high of the auto fibo indicator for options.
Anchor 1 (100%) will always be $0.0 and the first anchor 2 (0%) whatever the opening price of the contract to operate. I hope that my explanation of the first high of the day has been as clear as possible, thank you very much @SleepyZ.

[Edit: See Post 372 https://usethinkscript.com/threads/...vels-indicator-for-thinkorswim.14/post-137860 for final code for OPTIONS ONLY autofibs]

So I have reworked the script to give you the option to display the last day or all day's fibs.
You can move the bubbles on the lastday but the others are fixed.
I was not able to test this on Options, but it seems to work on stocks that I could test.

The image shows the same script on the left with showtodayonly== yes and the right with it == no

Screenshot 2024-02-08 090609.png
Code:
#AutoFib for OPTIONS only

input ShowTodayOnly = no;
input showbubbles   = yes;
input bubblemover   = 1; #Hint n: Number of Bars to shift bubble horizontally

def ORH1 = if showtodayonly and getday()!=getlastday() then double.nan else if getday()!=getday()[1] then high else orh1[1];
def ORL1 = if showtodayonly and getday()!=getlastday() then double.nan  else if getday()!=getday()[1] then 0 else orl1[1];#low(period = period)[displace];

plot orh=orh1;
ORH.SetPaintingStrategy(PaintingStrategy.HORIZONTAL);
ORH.SetLineWeight(2);

plot orl =orl1;
ORL.SetPaintingStrategy(PaintingStrategy.HORIZONTAL);
ORL.SetLineWeight(2);


input F1 = 236;
input F2 = 382;
input F3 = 500;
input F4 = 618;
input F5 = 705;
input F6 = 786;
input F7 = 900;

def rHi =  ORH;
def rLo =  ORL;

def range  = absValue(rhi - rlo);
plot FF1   = rhi - (range * F1 *.001);
plot FF2   = rhi - (range * F2 *.001);
plot FF3   = rhi - (range * F3 *.001);
plot FF4   = rhi - (range * F4 *.001);
plot FF5   = rhi - (range * F5 *.001);
plot FF6   = rhi - (range * F6 *.001);
plot FF7   = rhi - (range * F7 *.001);


def h = high(period = AggregationPeriod.DAY);
def l = low(period = AggregationPeriod.DAY);


FF1.SetPaintingStrategy(PaintingStrategy.HORIZONTAL);
FF1.SetLineWeight(1);

FF2.SetPaintingStrategy(PaintingStrategy.HORIZONTAL);
FF2.SetLineWeight(1);

FF3.SetPaintingStrategy(PaintingStrategy.HORIZONTAL);
FF3.SetLineWeight(1);

FF4.SetPaintingStrategy(PaintingStrategy.HORIZONTAL);
FF4.SetLineWeight(1);

FF5.SetPaintingStrategy(PaintingStrategy.HORIZONTAL);
FF5.SetLineWeight(1);

FF6.SetPaintingStrategy(PaintingStrategy.HORIZONTAL);
FF6.SetLineWeight(1);

FF7.SetPaintingStrategy(PaintingStrategy.HORIZONTAL);
FF7.SetLineWeight(1);


def   b           = bubblemover;
def   b1          = b + 1;

#Bubbles for the lastday which can be moved by the bubblemover
AddChartBubble(IsNaN(close[b]) and !IsNaN(close[b1]), FF1[b1], F1 + "/" + astext(ff1[b1]), FF1.Takevaluecolor());
AddChartBubble(IsNaN(close[b]) and !IsNaN(close[b1]), FF2[b1], F2 + "/" + astext(ff2[b1]), FF2.Takevaluecolor());
AddChartBubble(IsNaN(close[b]) and !IsNaN(close[b1]), FF3[b1], F3 + "/" + astext(ff3[b1]), FF3.Takevaluecolor());
AddChartBubble(IsNaN(close[b]) and !IsNaN(close[b1]), FF4[b1], F4 + "/" + astext(ff4[b1]), FF4.Takevaluecolor());
AddChartBubble(IsNaN(close[b]) and !IsNaN(close[b1]), FF5[b1], F5 + "/" + astext(ff5[b1]), FF5.Takevaluecolor());
AddChartBubble(IsNaN(close[b]) and !IsNaN(close[b1]), FF6[b1], F6 + "/" + astext(ff6[b1]), FF6.Takevaluecolor());
AddChartBubble(IsNaN(close[b]) and !IsNaN(close[b1]), FF7[b1], F7 + "/" + astext(ff7[b1]), FF7.Takevaluecolor());
AddChartBubble(IsNaN(close[b]) and !IsNaN(close[b1]), orh[b1], 0 + "/" + astext(orh[b1]), orh.Takevaluecolor());
AddChartBubble(IsNaN(close[b]) and !IsNaN(close[b1]), orl[b1], 100 + "/" + astext(orl[b1]), orl.Takevaluecolor());

#Bubbles for days other than the last day when showtodayonly == no ehich cannot be moved
AddChartBubble((ff1) != ff1[-1], FF1, F1 + "/" + astext(ff1), FF1.Takevaluecolor());
AddChartBubble((ff2) != ff2[-1], FF2, F2 + "/" + astext(ff2), FF2.Takevaluecolor());
AddChartBubble((ff3) != ff3[-1], FF3, F3 + "/" + astext(ff3), FF3.Takevaluecolor());
AddChartBubble((ff4) != ff4[-1], FF4, F4 + "/" + astext(ff4), FF4.Takevaluecolor());
AddChartBubble((ff5) != ff5[-1], FF5, F5 + "/" + astext(ff5), FF5.Takevaluecolor());
AddChartBubble((ff6) != ff6[-1], FF6, F6 + "/" + astext(ff6), FF6.Takevaluecolor());
AddChartBubble((ff7) != ff7[-1], FF7, F7 + "/" + astext(ff7), FF7.Takevaluecolor());
AddChartBubble((orh) != orh[-1], orh, 0 + "/" + astext(orh), orh.Takevaluecolor());
AddChartBubble((orl) != orl[-1], orl, 100 + "/" + astext(orl), orl.Takevaluecolor());

;
 
Last edited:
So I have reworked the script to give you the option to display the last day or all day's fibs.
You can move the bubbles on the lastday but the others are fixed.
I was not able to test this on Options, but it seems to work on stocks that I could test.

The image shows the same script on the left with showtodayonly== yes and the right with it == no
Hi @SleepyZ, Thanks for the new code. I attached a screenshoot with some notes, the new indicator is plotting the anchor 2 (0%) taking the open price (initial high at 9:30am) of each day as the high, the indicator should follow the price and if the price of the contract increase above the open price (for example Tu, Wed, Thur) take that new price as the new high (anchor 2 [0%]) each day.
 

Attachments

  • Screenshot 2024-02-08 SPX_Call_5000_3Days_1Minute_New_Auto_Fibo_multiple_days.png
    Screenshot 2024-02-08 SPX_Call_5000_3Days_1Minute_New_Auto_Fibo_multiple_days.png
    214.9 KB · Views: 148
Hi @SleepyZ, Thanks for the new code. I attached a screenshoot with some notes, the new indicator is plotting the anchor 2 (0%) taking the open price (initial high at 9:30am) of each day as the high, the indicator should follow the price and if the price of the contract increase above the open price (for example Tu, Wed, Thur) take that new price as the new high (anchor 2 [0%]) each day.

This should do what you last requested.

Screenshot 2024-02-08 142116.png


Code:
#AutoFib for OPTIONS only

input ShowTodayOnly = no;
input showlastbubbles = yes;
input showpriorbubbles = no;
input bubblemover = 8; #Hint n: Number of Bars to shift bubble horizontally
input showlabel_618 = yes;

def hi =high(period=aggregationPeriod.DAY);
def ORH1 = if ShowTodayOnly and GetDay() != GetLastDay() then Double.NaN else if GetDay() != GetDay()[1] then hi else if hi > ORH1[1] then hi else ORH1[1];
def ORL1 = if ShowTodayOnly and GetDay() != GetLastDay() then Double.NaN else if GetDay() != GetDay()[1] then 0 else ORL1[1];#low(period = period)[displace];

plot orh = ORH1;
orh.SetPaintingStrategy(PaintingStrategy.HORIZONTAL);
orh.SetLineWeight(2);

plot orl = ORL1;
orl.SetPaintingStrategy(PaintingStrategy.HORIZONTAL);
orl.SetLineWeight(2);


input F1 = 236;
input F2 = 382;
input F3 = 500;
input F4 = 618;
input F5 = 705;
input F6 = 786;
input F7 = 900;

def rHi = orh;
def rLo = orl;

def range = AbsValue(rHi - rLo);
plot FF1 = rHi - (range * F1 * .001);
plot FF2 = rHi - (range * F2 * .001);
plot FF3 = rHi - (range * F3 * .001);
plot FF4 = rHi - (range * F4 * .001);
plot FF5 = rHi - (range * F5 * .001);
plot FF6 = rHi - (range * F6 * .001);
plot FF7 = rHi - (range * F7 * .001);

###################
addlabel(showlabel_618 and close crosses ff4 within 2 bars, "Close Crossed 618 within last 2 bars", color.light_red);
###################

def h = high(period = AggregationPeriod.DAY);
def l = low(period = AggregationPeriod.DAY);


FF1.SetPaintingStrategy(PaintingStrategy.HORIZONTAL);
FF1.SetLineWeight(1);

FF2.SetPaintingStrategy(PaintingStrategy.HORIZONTAL);
FF2.SetLineWeight(1);

FF3.SetPaintingStrategy(PaintingStrategy.HORIZONTAL);
FF3.SetLineWeight(1);

FF4.SetPaintingStrategy(PaintingStrategy.HORIZONTAL);
FF4.SetLineWeight(1);

FF5.SetPaintingStrategy(PaintingStrategy.HORIZONTAL);
FF5.SetLineWeight(1);

FF6.SetPaintingStrategy(PaintingStrategy.HORIZONTAL);
FF6.SetLineWeight(1);

FF7.SetPaintingStrategy(PaintingStrategy.HORIZONTAL);
FF7.SetLineWeight(1);


def b = bubblemover;
def b1 = b + 1;

#Bubbles for the lastday which can be moved by the bubblemover
AddChartBubble(showlastbubbles and IsNaN(close[b]) and !IsNaN(close[b1]), FF1[b1], F1 + "/" + AsText(FF1[b1]), FF1.TakeValueColor());
AddChartBubble(showlastbubbles and IsNaN(close[b]) and !IsNaN(close[b1]), FF2[b1], F2 + "/" + AsText(FF2[b1]), FF2.TakeValueColor());
AddChartBubble(showlastbubbles and IsNaN(close[b]) and !IsNaN(close[b1]), FF3[b1], F3 + "/" + AsText(FF3[b1]), FF3.TakeValueColor());
AddChartBubble(showlastbubbles and IsNaN(close[b]) and !IsNaN(close[b1]), FF4[b1], F4 + "/" + AsText(FF4[b1]), FF4.TakeValueColor());
AddChartBubble(showlastbubbles and IsNaN(close[b]) and !IsNaN(close[b1]), FF5[b1], F5 + "/" + AsText(FF5[b1]), FF5.TakeValueColor());
AddChartBubble(showlastbubbles and IsNaN(close[b]) and !IsNaN(close[b1]), FF6[b1], F6 + "/" + AsText(FF6[b1]), FF6.TakeValueColor());
AddChartBubble(showlastbubbles and IsNaN(close[b]) and !IsNaN(close[b1]), FF7[b1], F7 + "/" + AsText(FF7[b1]), FF7.TakeValueColor());
AddChartBubble(showlastbubbles and IsNaN(close[b]) and !IsNaN(close[b1]), orh[b1], 0 + "/" + AsText(orh[b1]), orh.TakeValueColor());
AddChartBubble(showlastbubbles and IsNaN(close[b]) and !IsNaN(close[b1]), orl[b1], 100 + "/" + AsText(orl[b1]), orl.TakeValueColor());

#Bubbles for days other than the last day when showtodayonly == no ehich cannot be moved
AddChartBubble(if !showpriorbubbles or GetDay() >= GetLastDay() then Double.NaN else GetDay() != GetDay()[-1], FF1, F1 + "/" + AsText(FF1), FF1.TakeValueColor());
AddChartBubble(if !showpriorbubbles or GetDay() >= GetLastDay() then Double.NaN else GetDay() != GetDay()[-1], FF2, F2 + "/" + AsText(FF2), FF2.TakeValueColor());
AddChartBubble(if !showpriorbubbles or GetDay() >= GetLastDay() then Double.NaN else GetDay() != GetDay()[-1], FF3, F3 + "/" + AsText(FF3), FF3.TakeValueColor());
AddChartBubble(if !showpriorbubbles or GetDay() >= GetLastDay() then Double.NaN else GetDay() != GetDay()[-1], FF4, F4 + "/" + AsText(FF4), FF4.TakeValueColor());
AddChartBubble(if !showpriorbubbles or GetDay() >= GetLastDay() then Double.NaN else GetDay() != GetDay()[-1], FF5, F5 + "/" + AsText(FF5), FF5.TakeValueColor());
AddChartBubble(if !showpriorbubbles or GetDay() >= GetLastDay() then Double.NaN else GetDay() != GetDay()[-1], FF6, F6 + "/" + AsText(FF6), FF6.TakeValueColor());
AddChartBubble(if !showpriorbubbles or GetDay() >= GetLastDay() then Double.NaN else GetDay() != GetDay()[-1], FF7, F7 + "/" + AsText(FF7), FF7.TakeValueColor());
AddChartBubble(if !showpriorbubbles or GetDay() >= GetLastDay() then Double.NaN else GetDay() != GetDay()[-1] , orh, orh + "/" + AsText(orh), orh.TakeValueColor());
AddChartBubble(if !showpriorbubbles or GetDay() >= GetLastDay() then Double.NaN else GetDay() != GetDay()[-1] , orl, orl + "/" + AsText(orl), orl.TakeValueColor());
 
Last edited:
This should do what you last requested.
Good afternoon @SleepyZ, thank you for the modifications, I think I explained myself wrong. I have attached 2 screenshoots, one with the new indicator with the latest modifications (where I put some notes). What I would like is for the new fibo options indicator to plot the levels like the original indicator (screenshot 2) for each day of the timeframe chart, because the new indicator seems to follow the price and it's not that I was looking for it, I just wanted straight plots of every fibo level of every day. And I wanted to tell you that when I select No bubbles, they continue to show, again thank you very much for making this indicator. The purpose of this indicator is to see how the price of a contract pulls back to the area between 61.8% to 78.6%, there is a probability of buying at a discount waiting for the price to rise again.

Just one idea or another improvement that I thought of, is if it were possible to add a label to the indicator that would show us when the price reaches 61.8 (it would be like an alert) and that we could select whatever the discount level would be, the default would be 61.8% and that could be changed to any level such as 50% or 78.6% or 90%.
 

Attachments

  • Screenshot 2024-02-08 SPX_Call_5000_New_Fibo_Indicator_with_levels_for_each_day.png
    Screenshot 2024-02-08 SPX_Call_5000_New_Fibo_Indicator_with_levels_for_each_day.png
    174.1 KB · Views: 131
  • Screenshot 2024-02-08 SPX_Call_5000_3Days_1Minute_First_Fibo_indicator.png
    Screenshot 2024-02-08 SPX_Call_5000_3Days_1Minute_First_Fibo_indicator.png
    152.7 KB · Views: 133
Good afternoon @SleepyZ, thank you for the modifications, I think I explained myself wrong. I have attached 2 screenshoots, one with the new indicator with the latest modifications (where I put some notes). What I would like is for the new fibo options indicator to plot the levels like the original indicator (screenshot 2) for each day of the timeframe chart, because the new indicator seems to follow the price and it's not that I was looking for it, I just wanted straight plots of every fibo level of every day. And I wanted to tell you that when I select No bubbles, they continue to show, again thank you very much for making this indicator. The purpose of this indicator is to see how the price of a contract pulls back to the area between 61.8% to 78.6%, there is a probability of buying at a discount waiting for the price to rise again.

Just one idea or another improvement that I thought of, is if it were possible to add a label to the indicator that would show us when the price reaches 61.8 (it would be like an alert) and that we could select whatever the discount level would be, the default would be 61.8% and that could be changed to any level such as 50% or 78.6% or 90%.

I have added show bubble input control and the 618 label in post 372.

Code:
###################
addlabel(showlabel_618 and close crosses ff4 within 2 bars, "Close Crossed 618 within last 2 bars", color.light_red);
###################
 
Last edited:
Good afternoon @SleepyZ, thank you for the modifications, I think I explained myself wrong. I have attached 2 screenshoots, one with the new indicator with the latest modifications (where I put some notes). What I would like is for the new fibo options indicator to plot the levels like the original indicator (screenshot 2) for each day of the timeframe chart, because the new indicator seems to follow the price and it's not that I was looking for it, I just wanted straight plots of every fibo level of every day. And I wanted to tell you that when I select No bubbles, they continue to show, again thank you very much for making this indicator. The purpose of this indicator is to see how the price of a contract pulls back to the area between 61.8% to 78.6%, there is a probability of buying at a discount waiting for the price to rise again.

Just one idea or another improvement that I thought of, is if it were possible to add a label to the indicator that would show us when the price reaches 61.8 (it would be like an alert) and that we could select whatever the discount level would be, the default would be 61.8% and that could be changed to any level such as 50% or 78.6% or 90%.

Since you are using on RTHrs I can use the daily high to create a straight line at the high as requested. Changed the code in above post 372
 
Since you are using on RTHrs I can use the daily high to create a straight line at the high as requested. Changed the code in above post 372
Hi @SleepyZ, thank you very much for the new indicator and the modifications you have made, it looks great. I have been testing it in different options contracts and everything shows that it is fine, the only thing I have not been able to verify has been the label at level 61.8, I imagine because the market is closed, I have attached a screenshoot where I point out that only on the current day of the contract the level bubbles are repeated about 9 times in each level, I imagine that something in the code is repeating that information several times.
I am going to start testing the new indicator in the open market and check if it plots the levels correctly, and also to know if the label/alert appears if the contract price retraces to the 61.8% level.
While testing the new indicator I had an idea and I wanted to ask you if in the future after testing the indicator, if it were possible to create a scan of the indicator where there would be, for example, a watchlist of call or put contracts of different assets (let's say today TSLA call 195, AMD call 175, META call 475, SPX call 5000) if a scan of the fibo indicator could show/alert us when the prices of each of the contracts on the watchlist would depreciate and reach the 61.8% level, as I said, it is an idea. Thank you very much again @SleepyZ.
 

Attachments

  • Screenshot 2024-02-08 New_Auto_Fibo_Options_Indicator.png
    Screenshot 2024-02-08 New_Auto_Fibo_Options_Indicator.png
    162 KB · Views: 132
Hi @SleepyZ, thank you very much for the new indicator and the modifications you have made, it looks great. I have been testing it in different options contracts and everything shows that it is fine, the only thing I have not been able to verify has been the label at level 61.8, I imagine because the market is closed, I have attached a screenshoot where I point out that only on the current day of the contract the level bubbles are repeated about 9 times in each level, I imagine that something in the code is repeating that information several times.
I am going to start testing the new indicator in the open market and check if it plots the levels correctly, and also to know if the label/alert appears if the contract price retraces to the 61.8% level.
While testing the new indicator I had an idea and I wanted to ask you if in the future after testing the indicator, if it were possible to create a scan of the indicator where there would be, for example, a watchlist of call or put contracts of different assets (let's say today TSLA call 195, AMD call 175, META call 475, SPX call 5000) if a scan of the fibo indicator could show/alert us when the prices of each of the contracts on the watchlist would depreciate and reach the 61.8% level, as I said, it is an idea. Thank you very much again @SleepyZ.

The bubbles are fixed in the above. The [b ] was missing from isnan(close) portion of lastday bubbles.

The following is some options for plot scan. I ran it on a Day basis. The image is an example of 1 stock. As with Options, I do not use the scanner, so I may be of little help.

Screenshot 2024-02-09 055114.png
Code:
#AutoFib for OPTIONS only

input ShowTodayOnly = yes;
input showlastbubbles = yes;
input showpriorbubbles = no;
input bubblemover = 8; #Hint n: Number of Bars to shift bubble horizontally
input showlabel_618 = yes;

def hi =high;
def ORH1 = if ShowTodayOnly and GetDay() != GetLastDay() then Double.NaN else if GetDay() != GetDay()[1] then hi else if hi > ORH1[1] then hi else ORH1[1];
def ORL1 = if ShowTodayOnly and GetDay() != GetLastDay() then Double.NaN else if GetDay() != GetDay()[1] then 0 else ORL1[1];#low(period = period)[displace];

def orh = ORH1;
def orl = ORL1;


input F1 = 236;
input F2 = 382;
input F3 = 500;
input F4 = 618;
input F5 = 705;
input F6 = 786;
input F7 = 900;

def rHi = orh;
def rLo = orl;

def range = AbsValue(rHi - rLo);
def FF4 = rHi - (range * F4 * .001);
def FF5 = rHi - (range * F5 * .001);

plot scan = between(close,ff5,ff4);#close crosses ff4 within 2 bars;
 
The bubbles are fixed in the above. The [b ] was missing from isnan(close) portion of lastday bubbles.

The following is some options for plot scan. I ran it on a Day basis. The image is an example of 1 stock. As with Options, I do not use the scanner, so I may be of little help.
The bubbles are fixed in the above. The [b ] was missing from isnan(close) portion of lastday bubbles.

The following is some options for plot scan. I ran it on a Day basis. The image is an example of 1 stock. As with Options, I do not use the scanner, so I may be of little help.
Good afternoon @SleepyZ, Thank you very much for the last modification to the indicator, this plotted the levels very well and the bubbles from the last day are no longer repeated. I was attentive to the alert label at level 61.8, I saw it appear but I still have to continue doing tests regarding the label that gives the alert.
Another improvement that I thought could be added to the indicator is an optimal input level selector, let's say 1) 61.8%, 2) 70.5% 3) 78.6% 4) 90%, then if we select, for example, the optimal input level at 70.5 % only there when the price of the contract depreciates and reaches that level would the label/signal appear (since the label that you already added to the indicator would be directly related to the option that we take from the optimal input level selector).
Yesterday I couldn't test the code for the indicator scan, today I copied the code into a watchlist and I only got the NaN message, maybe it's because the market is closed, I'm going to try on demand to see what it shows me. And I also wanted to ask you who else in the programming community could help me with a scan code for the indicator if this were possible, again thank you very much @SleepyZ.

This adds an input level to allow you to choose which level to print a label of close crossing the level. It is defaulted to 618.

Code:
#AutoFib for OPTIONS only

input ShowTodayOnly = no;
input showlastbubbles = yes;
input showpriorbubbles = no;
input bubblemover = 8; #Hint n: Number of Bars to shift bubble horizontally
input showlabels = yes;

def hi = high(period = AggregationPeriod.DAY);
def ORH1 = if ShowTodayOnly and GetDay() != GetLastDay() then Double.NaN else if GetDay() != GetDay()[1] then hi else if hi > ORH1[1] then hi else ORH1[1];
def ORL1 = if ShowTodayOnly and GetDay() != GetLastDay() then Double.NaN else if GetDay() != GetDay()[1] then 0 else ORL1[1];#low(period = period)[displace];

plot orh = ORH1;
orh.SetPaintingStrategy(PaintingStrategy.HORIZONTAL);
orh.SetLineWeight(2);

plot orl = ORL1;
orl.SetPaintingStrategy(PaintingStrategy.HORIZONTAL);
orl.SetLineWeight(2);


input F1 = 236;
input F2 = 382;
input F3 = 500;
input F4 = 618;
input F5 = 705;
input F6 = 786;
input F7 = 900;

def rHi = orh;
def rLo = orl;

def range = AbsValue(rHi - rLo);
plot FF1 = rHi - (range * F1 * .001);
plot FF2 = rHi - (range * F2 * .001);
plot FF3 = rHi - (range * F3 * .001);
plot FF4 = rHi - (range * F4 * .001);
plot FF5 = rHi - (range * F5 * .001);
plot FF6 = rHi - (range * F6 * .001);
plot FF7 = rHi - (range * F7 * .001);

###################

input level = {"236", "382", "500", default "618", "705", "786", "900"};
AddLabel(showlabels and level == level."236" and close crosses FF1 within 2 bars, "Close Crossed 236 within last 2 bars", Color.LIGHT_RED);
AddLabel(showlabels and level == level."382" and close crosses FF2 within 2 bars, "Close Crossed 382 within last 2 bars", Color.LIGHT_RED);
AddLabel(showlabels and level == level."500" and close crosses FF3 within 2 bars, "Close Crossed 500 within last 2 bars", Color.LIGHT_RED);
AddLabel(showlabels and level == level."618" and close crosses FF4 within 2 bars, "Close Crossed 618 within last 2 bars", Color.LIGHT_RED);
AddLabel(showlabels and level == level."705" and close crosses FF5 within 2 bars, "Close Crossed 705 within last 2 bars", Color.LIGHT_RED);
AddLabel(showlabels and level == level."786" and close crosses FF6 within 2 bars, "Close Crossed 786 within last 2 bars", Color.LIGHT_RED);
AddLabel(showlabels and level == level."900" and close crosses FF7 within 2 bars, "Close Crossed 900 within last 2 bars", Color.LIGHT_RED);

###################

def h = high(period = AggregationPeriod.DAY);
def l = low(period = AggregationPeriod.DAY);


FF1.SetPaintingStrategy(PaintingStrategy.HORIZONTAL);
FF1.SetLineWeight(1);

FF2.SetPaintingStrategy(PaintingStrategy.HORIZONTAL);
FF2.SetLineWeight(1);

FF3.SetPaintingStrategy(PaintingStrategy.HORIZONTAL);
FF3.SetLineWeight(1);

FF4.SetPaintingStrategy(PaintingStrategy.HORIZONTAL);
FF4.SetLineWeight(1);

FF5.SetPaintingStrategy(PaintingStrategy.HORIZONTAL);
FF5.SetLineWeight(1);

FF6.SetPaintingStrategy(PaintingStrategy.HORIZONTAL);
FF6.SetLineWeight(1);

FF7.SetPaintingStrategy(PaintingStrategy.HORIZONTAL);
FF7.SetLineWeight(1);


def b = bubblemover;
def b1 = b + 1;

#Bubbles for the lastday which can be moved by the bubblemover
AddChartBubble(showlastbubbles and IsNaN(close[b]) and !IsNaN(close[b1]), FF1[b1], F1 + "/" + AsText(FF1[b1]), FF1.TakeValueColor());
AddChartBubble(showlastbubbles and IsNaN(close[b]) and !IsNaN(close[b1]), FF2[b1], F2 + "/" + AsText(FF2[b1]), FF2.TakeValueColor());
AddChartBubble(showlastbubbles and IsNaN(close[b]) and !IsNaN(close[b1]), FF3[b1], F3 + "/" + AsText(FF3[b1]), FF3.TakeValueColor());
AddChartBubble(showlastbubbles and IsNaN(close[b]) and !IsNaN(close[b1]), FF4[b1], F4 + "/" + AsText(FF4[b1]), FF4.TakeValueColor());
AddChartBubble(showlastbubbles and IsNaN(close[b]) and !IsNaN(close[b1]), FF5[b1], F5 + "/" + AsText(FF5[b1]), FF5.TakeValueColor());
AddChartBubble(showlastbubbles and IsNaN(close[b]) and !IsNaN(close[b1]), FF6[b1], F6 + "/" + AsText(FF6[b1]), FF6.TakeValueColor());
AddChartBubble(showlastbubbles and IsNaN(close[b]) and !IsNaN(close[b1]), FF7[b1], F7 + "/" + AsText(FF7[b1]), FF7.TakeValueColor());
AddChartBubble(showlastbubbles and IsNaN(close[b]) and !IsNaN(close[b1]), orh[b1], 0 + "/" + AsText(orh[b1]), orh.TakeValueColor());
AddChartBubble(showlastbubbles and IsNaN(close[b]) and !IsNaN(close[b1]), orl[b1], 100 + "/" + AsText(orl[b1]), orl.TakeValueColor());

#Bubbles for days other than the last day when showtodayonly == no ehich cannot be moved
AddChartBubble(if !showpriorbubbles or GetDay() >= GetLastDay() then Double.NaN else GetDay() != GetDay()[-1], FF1, F1 + "/" + AsText(FF1), FF1.TakeValueColor());
AddChartBubble(if !showpriorbubbles or GetDay() >= GetLastDay() then Double.NaN else GetDay() != GetDay()[-1], FF2, F2 + "/" + AsText(FF2), FF2.TakeValueColor());
AddChartBubble(if !showpriorbubbles or GetDay() >= GetLastDay() then Double.NaN else GetDay() != GetDay()[-1], FF3, F3 + "/" + AsText(FF3), FF3.TakeValueColor());
AddChartBubble(if !showpriorbubbles or GetDay() >= GetLastDay() then Double.NaN else GetDay() != GetDay()[-1], FF4, F4 + "/" + AsText(FF4), FF4.TakeValueColor());
AddChartBubble(if !showpriorbubbles or GetDay() >= GetLastDay() then Double.NaN else GetDay() != GetDay()[-1], FF5, F5 + "/" + AsText(FF5), FF5.TakeValueColor());
AddChartBubble(if !showpriorbubbles or GetDay() >= GetLastDay() then Double.NaN else GetDay() != GetDay()[-1], FF6, F6 + "/" + AsText(FF6), FF6.TakeValueColor());
AddChartBubble(if !showpriorbubbles or GetDay() >= GetLastDay() then Double.NaN else GetDay() != GetDay()[-1], FF7, F7 + "/" + AsText(FF7), FF7.TakeValueColor());
AddChartBubble(if !showpriorbubbles or GetDay() >= GetLastDay() then Double.NaN else GetDay() != GetDay()[-1] , orh, orh + "/" + AsText(orh), orh.TakeValueColor());
AddChartBubble(if !showpriorbubbles or GetDay() >= GetLastDay() then Double.NaN else GetDay() != GetDay()[-1] , orl, orl + "/" + AsText(orl), orl.TakeValueColor());

#
 

Join useThinkScript to post your question to a community of 21,000+ developers and traders.

Similar threads

Not the exact question you're looking for?

Start a new thread and receive assistance from our community.

87k+ Posts
198 Online
Create Post

Similar threads

Similar threads

The Market Trading Game Changer

Join 2,500+ subscribers inside the useThinkScript VIP Membership Club
  • Exclusive indicators
  • Proven strategies & setups
  • Private Discord community
  • ‘Buy The Dip’ signal alerts
  • Exclusive members-only content
  • Add-ons and resources
  • 1 full year of unlimited support

Frequently Asked Questions

What is useThinkScript?

useThinkScript is the #1 community of stock market investors using indicators and other tools to power their trading strategies. Traders of all skill levels use our forums to learn about scripting and indicators, help each other, and discover new ways to gain an edge in the markets.

How do I get started?

We get it. Our forum can be intimidating, if not overwhelming. With thousands of topics, tens of thousands of posts, our community has created an incredibly deep knowledge base for stock traders. No one can ever exhaust every resource provided on our site.

If you are new, or just looking for guidance, here are some helpful links to get you started.

What are the benefits of VIP Membership?
VIP members get exclusive access to these proven and tested premium indicators: Buy the Dip, Advanced Market Moves 2.0, Take Profit, and Volatility Trading Range. In addition, VIP members get access to over 50 VIP-only custom indicators, add-ons, and strategies, private VIP-only forums, private Discord channel to discuss trades and strategies in real-time, customer support, trade alerts, and much more. Learn all about VIP membership here.
How can I access the premium indicators?
To access the premium indicators, which are plug and play ready, sign up for VIP membership here.
Back
Top