# Auto Fib V1.4 - FOR USE WITH OPTIONS ONLY
# tomsk
# 11.19.2019
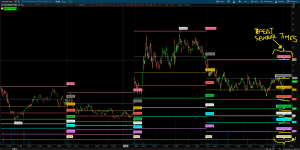
# Automatically draws fibonacci retracements using the highest price and lowest price
# from the current view and timeframe.
#
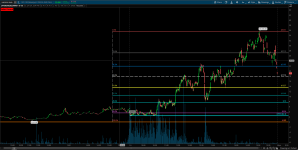
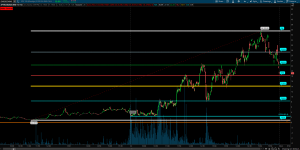
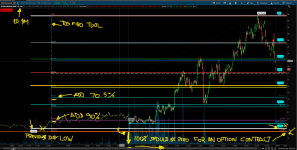
# Fibonacci retracements use horizontal lines to indicate areas of support or resistance
# at the key Fibonacci levels before it continues in the original direction. These levels
# are created by drawing a trendline between two extreme points and then dividing the
# vertical distance by the key Fibonacci ratios of: 23.6%, 38.2%, 50%, 61.8%, 78.6%, and 100%.
# CHANGE LOG
#
# V1.0 - 12.18.2018 - BenTen - Initial release of Auto Fib, created by Ryan Hendricks
# V1.1 - 11.15.2019 - theelderwand - As script was difficult to read, made the following enhancements
# Expands to right
# Doesn't expand to left
# Custom colors for Fibonacci bars (0.618 is GOLD color)
# Custom line weights
# Code is modularized so you can add extra plots as needed
# V1.2 - 11.15.2019 - tomsk - Added an input selector for the colors of the label. You
# can select from any of the colors listed - red, orange,
# green, etc and bubbles for all the fib retracements will
# utilize that color.
# V1.3 - 11.19.2019 - tomsk - Modified the AddChartBubbles to be displayed on the right
# side of the chart. Please ensure that you increase the
# expansion area to that the bubbles have room to be displayed
# Chart Settings > Time Axis > Expansion Area
# V1.4 - 20240203 - Sleepyz - Modified to work specifically for Options for only the last # day.
# low was defaulted to 0 as requested by the requestor.
# 2 fibs added
#hint Price: Price used in the alerts on crossing retracement lines. <b>(Default is Close)</b>
#hint coefficient_0: Retracement Line 0: Retracement from the highest high to the lowest low.<b>(Default is 0%)</b>
#hint Coefficient_1: Retracement Line 1: Retracement from the highest high to the lowest low.<b>(Default is 23.6%)</b>
#hint Coefficient_2: Retracement Line 2: Retracement from the highest high to the lowest low.<b>(Default is 38.2%)</b>
#hint Coefficient_3: Retracement Line 3: Retracement from the highest high to the lowest low.<b>(Default is 50%)</b>
#hint Coefficient_4: Retracement Line 4: Retracement from the highest high to the lowest low.<b>(Default is 61.8%)</b>
#hint Coefficient_5: Retracement Line 5: Retracement from the highest high to the lowest low.<b>(Default is 78.6%)</b>
#hint Coefficient_6: Retracement Line 6: Retracement from the highest high to the lowest low.<b>(Default is 100%)</b>
#wizard input: Price
#wizard text: Inputs: Price:
#wizard input: coefficient_0
#wizard text: coefficient_0:
#wizard input: Coefficient_1
#wizard text: Coefficient_1:
#wizard input: Coefficient_2
#wizard text: Coefficient_2:
#wizard input: Coefficient_3
#wizard text: Coefficient_3:
#wizard input: Coefficient_4
#wizard text: Coefficient_4:
#wizard input: Coefficient_5
#wizard text: Coefficient_5:
#wizard input: Coefficient_6
#wizard text: Coefficient_6:
input bubblemover = 1;
input price = close;
input high = high;
input low = low;
input coefficient_0 = 0.000;
input coefficient_1 = .236;
input Coefficient_2 = .382;
input Coefficient_3 = .500;
input Coefficient_4 = .618;
input Coefficient_5 = .786;
input Coefficient_6 = 1.000;
input Coefficient_7 = .705;
input Coefficient_8 = .900;
input LabelColor = {default "MAGENTA", "CYAN", "PINK", "LIGHT_GRAY", "ORANGE", "RED", "GREEN", "GRAY", "WHITE"};
input n = 3;
def n1 = n + 1;
def lastdayhigh = compoundvalue(1,
if GetDay() > GetLastDay() then Double.NaN
else if GetDay() == GetLastDay() then high
else if high > lastdayhigh[1] then high
else lastdayhigh[1], double.nan);
def lastdaylow = CompoundValue(1,
if GetDay() > GetLastDay() then Double.NaN
else if GetDay() == GetLastDay() then 0
else if low < lastdaylow[1] then low
else lastdaylow[1], double.nan);
def a = lastdayhigh;
#addchartBubble(getday()==getlastday(), high, high + "\n" +a);
def b = lastdaylow;
def b1 = if b == 0 and GetDay() == GetLastDay() then BarNumber() else Double.NaN;
def barnumber = BarNumber();
def c = if high == a then barnumber else Double.NaN;
def d = if b != 0 and low == b then barnumber else if b == 0 then b1 else Double.NaN;
rec highnumber = CompoundValue(1, if IsNaN(c) then highnumber[1] else c, c);
def highnumberall = HighestAll(highnumber);
rec lownumber = CompoundValue(1, if IsNaN(d) then lownumber[1] else d, d);
def lownumberall = LowestAll(lownumber);
def upward = highnumberall > lownumberall;
def downward = highnumberall < lownumberall;
def x = AbsValue(lownumberall - highnumberall );
def slope = (a - b) / x;
def slopelow = (b - a) / x;
def day = GetDay();
def month = GetMonth();
def year = GetYear();
def lastDay = GetLastDay();
def lastmonth = GetLastMonth();
def lastyear = GetLastYear();
def isToday = If(day == lastDay and month == lastmonth and year == lastyear, 1, 0);
def istodaybarnumber = HighestAll(if isToday then barnumber else Double.NaN);
def line = b + (slope * (barnumber - lownumber));
def linelow = a + (slopelow * (barnumber - highnumber));
def currentlinelow = if barnumber <= lownumberall then linelow else Double.NaN;
def currentline = if barnumber <= highnumberall then line else Double.NaN;
plot FibFan = if downward then currentlinelow else if upward then currentline else Double.NaN;
FibFan.SetStyle(Curve.SHORT_DASH);
FibFan.AssignValueColor(Color.RED);
FibFan.HideBubble();
def range = a - b;
def value0 = range * coefficient_0;
def value1 = range * coefficient_1;
def value2 = range * Coefficient_2;
def value3 = range * Coefficient_3;
def value4 = range * Coefficient_4;
def value5 = range * Coefficient_5;
def value6 = range * Coefficient_6;
def value7 = range * Coefficient_7;
def value8 = range * Coefficient_8;
def condition1 = downward and barnumber >= highnumberall;
def condition2 = upward and barnumber >= lownumberall;
plot Retracement0 = if condition1 then HighestAll(b + value0) else if condition2 then HighestAll(a - value0) else Double.NaN;
plot Retracement1 = if condition1 then HighestAll(b + value1) else if condition2 then HighestAll(a - value1) else Double.NaN;
plot Retracement2 = if condition1 then HighestAll(b + value2) else if condition2 then HighestAll(a - value2) else Double.NaN;
plot Retracement3 = if condition1 then HighestAll(b + value3) else if condition2 then HighestAll(a - value3) else Double.NaN;
plot Retracement4 = if condition1 then HighestAll(b + value4) else if condition2 then HighestAll(a - value4) else Double.NaN;
plot Retracement5 = if condition1 then HighestAll(b + value5) else if condition2 then HighestAll(a - value5) else Double.NaN;
plot Retracement6 = if condition1 then HighestAll(b + value6) else if condition2 then HighestAll(a - value6) else Double.NaN;
plot Retracement7 = if condition1 then HighestAll(b + value7) else if condition2 then HighestAll(a - value7) else Double.NaN;
plot Retracement8 = if condition1 then HighestAll(b + value8) else if condition2 then HighestAll(a - value8) else Double.NaN;
##############
def bm = bubblemover;
#Retracement0.AssignValueColor(CreateColor(255, 255, 255));
Retracement0.SetLineWeight(4);
Retracement0.HideBubble();
AddChartBubble((downward and close[bm + 1]) and IsNaN(close[bm]), Retracement0, Concat( (coefficient_0 * 100), "% ") + AsText(Retracement0), Retracement0.TakeValueColor(), yes);
AddChartBubble((upward and close[bm + 1]) and IsNaN(close[bm]), Retracement0, Concat( (coefficient_0 * 100), "% ") + AsText(Retracement0), Retracement0.TakeValueColor(), yes);
#Retracement1.AssignValueColor(CreateColor(173, 216, 230));
Retracement1.SetLineWeight(2);
Retracement1.HideBubble();
AddChartBubble((downward and close[bm + 1]) and IsNaN(close[bm]), Retracement1, Concat( (coefficient_1 * 100), "% ") + AsText(Retracement1), Retracement1.TakeValueColor(), yes);
AddChartBubble((upward and close[bm + 1]) and IsNaN(close[bm]), Retracement1, Concat( (coefficient_1 * 100), "% ") + AsText(Retracement1), Retracement1.TakeValueColor(), yes);
#Retracement2.AssignValueColor(CreateColor(0, 197, 49));
Retracement2.SetLineWeight(2);
Retracement2.HideBubble();
AddChartBubble((downward and close[bm + 1]) and IsNaN(close[bm]), Retracement2, Concat( (Coefficient_2 * 100), "% ") + AsText(Retracement2), Retracement2.TakeValueColor(), yes);
AddChartBubble((upward and close[bm + 1]) and IsNaN(close[bm]), Retracement2, Concat( (Coefficient_2 * 100), "% ") + AsText(Retracement2), Retracement2.TakeValueColor(), yes);
#Retracement3.AssignValueColor(CreateColor(255, 64, 64));
Retracement3.SetLineWeight(3);
Retracement3.HideBubble();
AddChartBubble((downward and close[bm + 1]) and IsNaN(close[bm]), Retracement3, Concat( (Coefficient_3 * 100), "% ") + AsText(Retracement3), Retracement3.TakeValueColor(), yes);
AddChartBubble((upward and close[bm + 1]) and IsNaN(close[bm]), Retracement3, Concat( (Coefficient_3 * 100), "% ") + AsText(Retracement3), Retracement3.TakeValueColor(), yes);
#Retracement4.AssignValueColor(CreateColor(255, 215, 0));
Retracement4.SetLineWeight(5);
Retracement4.HideBubble();
AddChartBubble((downward and close[bm + 1]) and IsNaN(close[bm]), Retracement4, Concat( (Coefficient_4 * 100), "% ") + AsText(Retracement4), Retracement4.TakeValueColor(), yes);
AddChartBubble((upward and close[bm + 1]) and IsNaN(close[bm]), Retracement4, Concat( (Coefficient_4 * 100), "% ") + AsText(Retracement4), Retracement4.TakeValueColor(), yes);
#Retracement5.AssignValueColor(CreateColor(0, 255, 255));
Retracement5.SetLineWeight(2);
Retracement5.HideBubble();
AddChartBubble((downward and close[bm + 1]) and IsNaN(close[bm]), Retracement5, Concat( (Coefficient_5 * 100), "% ") + AsText(Retracement5), Retracement5.TakeValueColor(), yes);
AddChartBubble((upward and close[bm + 1]) and IsNaN(close[bm]), Retracement5, Concat( (Coefficient_5 * 100), "% ") + AsText(Retracement5), Retracement5.TakeValueColor(), yes);
#Retracement6.AssignValueColor(CreateColor(255, 255, 255));
Retracement6.SetLineWeight(4);
Retracement6.HideBubble();
AddChartBubble((downward and close[bm + 1]) and IsNaN(close[bm]), Retracement6, Concat( (Coefficient_6 * 100), "% ") + AsText(Retracement6), Retracement6.TakeValueColor(), yes);
AddChartBubble((upward and close[bm + 1]) and IsNaN(close[bm]), Retracement6, Concat( (Coefficient_6 * 100), "% ") + AsText(Retracement6), Retracement6.TakeValueColor(), yes);
#Retracement7.AssignValueColor(CreateColor(255, 255, 255));
Retracement7.SetLineWeight(4);
Retracement7.HideBubble();
AddChartBubble((downward and close[bm + 1]) and IsNaN(close[bm]), Retracement7, Concat( (Coefficient_7 * 100), "% ") + AsText(Retracement7), Retracement7.TakeValueColor(), yes);
AddChartBubble((upward and close[bm + 1]) and IsNaN(close[bm]), Retracement7, Concat( (Coefficient_7 * 100), "% ") + AsText(Retracement7), Retracement7.TakeValueColor(), yes);
#Retracement8.AssignValueColor(CreateColor(255, 255, 255));
Retracement8.SetLineWeight(4);
Retracement8.HideBubble();
AddChartBubble((downward and close[bm + 1]) and IsNaN(close[bm]), Retracement8, Concat( (Coefficient_8 * 100), "% ") + AsText(Retracement8), Retracement8.TakeValueColor(), yes);
AddChartBubble((upward and close[bm + 1]) and IsNaN(close[bm]), Retracement8, Concat( (Coefficient_8 * 100), "% ") + AsText(Retracement8), Retracement8.TakeValueColor(), yes);
Alert((price crosses below Retracement0) , "Price crosses below Retracement Line 0");
Alert((price crosses above Retracement0) , "Price crosses above Retracement Line 0");
Alert((price crosses below Retracement1) , "Price crosses below Retracement Line 1");
Alert((price crosses above Retracement1) , "Price crosses above Retracement Line 1");
Alert((price crosses below Retracement2) , "Price crosses below Retracement Line 2");
Alert((price crosses above Retracement2) , "Price crosses above Retracement Line 2");
Alert((price crosses below Retracement3) , "Price crosses below Retracement Line 3");
Alert((price crosses above Retracement3) , "Price crosses above Retracement Line 3");
Alert((price crosses below Retracement4) , "Price crosses below Retracement Line 4");
Alert((price crosses above Retracement4) , "Price crosses above Retracement Line 4");
Alert((price crosses below Retracement5) , "Price crosses below Retracement Line 5");
Alert((price crosses above Retracement5) , "Price crosses above Retracement Line 5");
Alert((price crosses below Retracement6) , "Price crosses below Retracement Line 6");
Alert((price crosses above Retracement6) , "Price crosses above Retracement Line 6");
# End Auto Fib v1.4