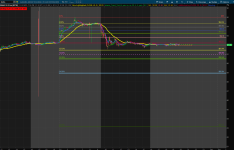
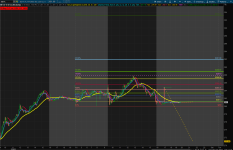
Can anyone help me change the chart bubbles to appear bars in the future?
I tried to add it like this but think I am missing something.
# plots a bubble x bars after last bar
input bars_in_future = 10;
def bif = bars_in_future;
addchartBubble(LabelsOn and F_236, F_0236,"23.6%",color.plum,bif);
here is the script.
#Automatic Fibonacci Long Levels
#based on Mobius's Fractal Pivot Strategy
#developed by Chewie76 on 8/27/2021
# User Inputs
input n = 20;
input FractalEnergyLength = 8;
input FractalEnergyThreshold = .68;
input AtrMult = .70;
input nATR = 4;
input AvgType = AverageType.HULL;
input LabelsOn = yes;
input AlertsOn = yes;
# Variables
def o = open;
def h = high;
def l = low;
def c = close;
def bar = BarNumber();
def TS = TickSize();
def nan = double.nan;
def ATR = Round((MovingAverage(AvgType, TrueRange(h, c, l), nATR)) / TS, 0) * TS;
def risk = if Between(c, 0, 1500)
then ATR
else if Between(c, 1500, 3500)
then 2
else if Between(c, 3500, 5500)
then 4
else 6;
def FE = Log(Sum((Max(h, c[1]) - Min(l, c[1])), FractalEnergyLength) /
(Highest(h, FractalEnergyLength) - Lowest(l, FractalEnergyLength)))
/ Log(FractalEnergyLength);
# Parent Aggregation Pivot High
# Pivot High Variables
def p_hh = fold i = 1 to n + 1
with p = 1
while p
do h > GetValue(h, -1);
def p_PivotH = if (bar > n and
h == Highest(h, n) and
p_hh)
then h
else NaN;
def p_PHValue = if !IsNaN(p_PivotH)
then p_PivotH
else p_PHValue[1];
def p_PHBar = if !IsNaN(p_PivotH)
then bar
else nan;
# Pivot High and Pivot High Exit Variables
# Pivot High Variables
def hh = fold ii = 1 to n + 1
with pp = 1
while pp
do h > GetValue(h, -1);
def PivotH = if (bar > n and
h == Highest(h, n) and
hh)
then h
else Double.NaN;
def PHValue = if !IsNaN(PivotH)
then PivotH
else PHValue[1];
def PHBar = if !IsNaN(PivotH)
then bar
else nan;
# Pivot High Exit Variables
def PHExit = if (bar > n and
h == Highest(h, n) and
hh)
then if l[1] < l
then l[1]
else fold r = 0 to 20
with a = NaN
while IsNaN(a)
do if GetValue(l[1], r) < l
then GetValue(l[1], r)
else NaN
else Double.NaN;
def PHExitValue = if !IsNaN(PHExit)
then PHExit
else PHExitValue[1];
def PHExitBar = if (bar > n and
h == Highest(h, n) and
hh)
then if l[1] < l
then bar - 1
else fold d = 0 to 20
with y = NaN
while IsNaN
")
do if GetValue(l[1], d) < l
then GetValue(bar - 1, d)
else NaN
else NaN;
# Pivot Low and Pivot Low Entry Variables
# Parent Pivot Low Variables
def p_ll = fold j = 1 to n + 1
with q = 1
while q
do l < GetValue(l, -1);
def p_PivotL = if (bar > n and
l == Lowest(l, n) and
p_ll)
then l
else NaN;
def p_PLValue = if !IsNaN(p_PivotL)
then p_PivotL
else p_PLValue[1];
def p_PLBar = if !IsNaN(p_PivotL)
then bar
else nan;
# Pivot Low Variables
def ll = fold jj = 1 to n + 1
with qq = 1
while qq
do l < GetValue(l, -1);
def PivotL = if (bar > n and
l == Lowest(l, n) and
ll)
then l
else NaN;
def PLValue = if !IsNaN(PivotL)
then PivotL
else PLValue[1];
def PLBar = if !IsNaN(PivotL)
then bar
else nan;
# Pivot Low Entry Variables
def PLEntry = if (bar > n and
l == Lowest(l, n) and
ll)
then if h[1] > h
then h[1]
else fold t = 0 to 20
with w = NaN
while IsNaN(w)
do if GetValue(h[1], t) > h
then GetValue(h[1], t)
else NaN
else NaN;
def PLEntryValue = if !IsNaN(PLEntry)
then PLEntry
else PLEntryValue[1];
def PLEntryBar = if (bar > n and
l == Lowest(l, n) and
ll)
then if h[1] > h
then bar - 1
else fold u = 0 to 20
with z = NaN
while IsNaN(z)
do if GetValue(h[1], u) > h
then GetValue(bar - 1, u)
else NaN
else NaN;
# Plots
plot F_100 = if bar >= HighestAll(PLBar)
then HighestAll(if isNaN(c[-1])
then PLValue
else nan)
else nan;
F_100.SetDefaultColor(Color.dark_red);
F_100.SetLineWeight(2);
def F_0100 =(if isNaN(F_100[1]) then F_100 else Double.NaN);
addchartBubble(LabelsOn and F_100, F_0100,"100%",color.dark_red);
plot F_786 = if bar >= HighestAll(PLEntryBar)
then HighestAll(if isNaN(c[-1])
then PLEntryValue
else nan)
else nan;
F_786.SetDefaultColor(Color.light_red);
F_786.SetLineWeight(2);
def F_0786 =(if isNaN(F_786[1]) then F_786 else Double.NaN);
addchartBubble(LabelsOn and F_786, F_0786,"78.6%",color.light_red);
plot priceLine = HighestAll(if IsNaN(c[-1])
then c
else Double.NaN);
priceLine.SetStyle(Curve.SHORT_DASH);
priceLine.SetLineWeight(1);
priceLine.SetDefaultColor(Color.CYAN);
plot UpArrow = if c crosses above F_786 and FE > .5
then l
else Double.NaN;
UpArrow.SetPaintingStrategy(PaintingStrategy.ARROW_UP);
UpArrow.SetLineWeight(5);
UpArrow.SetDefaultColor(Color.GREEN);
#Fib levels
# plots a bubble x bars after last bar
input bars_in_future = 10;
def bif = bars_in_future;
plot F_0 = (F_786-F_100) * 4.673 + F_100;
F_0.setdefaultcolor(color.red);
F_0.setlineweight(2);
def F_00 =(if isNaN(F_0[1]) then F_0 else Double.NaN);
addchartBubble(LabelsOn and F_0, F_00,"0%: " + asDollars(F_00),color.red,bif);
plot F_124 = (F_0 - F_100)/1.14155+ F_100;
F_124.setdefaultcolor(color.dark_orange);
F_124.setlineweight(2);
def F_0124 =(if isNaN(F_124[1]) then F_124 else Double.NaN);
plot F_236 = (F_0 - F_100)/1.3089+ F_100;
F_236.setdefaultcolor(color.plum);
F_236.setlineweight(2);
def F_0236 = (if isNaN(F_236[1]) then F_236 else Double.NaN);
addchartBubble(LabelsOn and F_236, F_0236,"23.6%",color.plum,bif);
plot F_382 = (F_0 - F_100)/1.618+ F_100;
F_382.setdefaultcolor(color.cyan);
F_382.setlineweight(2);
def F_0382 =(if isNaN(F_382[1]) then F_382 else Double.NaN);
addchartBubble(LabelsOn and F_382, F_0382,"38.2%",color.cyan);
plot F_50 = (F_0 - F_100)/2 + F_100;
F_50.setdefaultcolor(color.green);
F_50.setlineweight(2);
def F_050 =(if isNaN(F_50[1]) then F_50 else Double.NaN);
plot F_618 = (F_0 - F_100)/2.618+ F_100;
F_618.setdefaultcolor(color.yellow);
F_618.setlineweight(2);
def F_0618 =(if isNaN(F_618[1]) then F_618 else Double.NaN);
addchartBubble(LabelsOn and F_618, F_0618,"61.8%",color.yellow);
plot F_886 = (F_786 - F_100)/1.88+ F_100;
F_886.setdefaultcolor(color.violet);
F_886.setlineweight(2);
def F_0886 =(if isNaN(F_886[1]) then F_886 else Double.NaN);
plot FE_272 = (F_0 - F_100)*1.272 + F_100;
FE_272.setdefaultcolor(color.yellow);
FE_272.SetStyle(Curve.LONG_DASH);
FE_272.setlineweight(2);
def F_0272 =(if isNaN(FE_272[1]) then FE_272 else Double.NaN);
plot FE_50 = (F_0 - F_100)*1.5 + F_100;
FE_50.setdefaultcolor(color.GREEN);
FE_50.SetStyle(Curve.LONG_DASH);
FE_50.setlineweight(2);
def FE_050 =(if isNaN(FE_50[1]) then FE_50 else Double.NaN);
# Alerts
Alert(AlertsOn and UpArrow, " ", Alert.Bar, Sound.ding);