34-EMA Wave and GRaB Candles Indicator for ThinkorSwim

BenTen

Administrative
Staff member
Staff
VIP
Lifetime
Raghee Horner is the Managing Director at Simpler Trading and one of the things that she's known for is her 34-EMA Wave and GRaB Candles. I got the chance to test out the GRaB candles indicator on ThinkorSwim and it works really well. Raghee was kind enough to make her indicators public so I'm re-posting it here for you guys to check it out.

The EMA GRaB indicator produced a wave consists of:
  • The high of 34 period exponential moving average
  • The low of 34 period exponential moving average
  • The close of 34 period exponential moving average
The 34-EMA GRaB indicator helps to identify the following:
  • Uptrend market (green)
  • Downtrend market (red)
  • Sideways market (blue)
A trend reflects organized sentiment and momentum in the market. In an upward trend characterized by higher highs and higher lows, green candles should dominate, indicating bullish momentum. Conversely, in a downtrend with lower lows and lower highs, red candles should prevail, signaling bearish sentiment. When the market is in consolidation, blue GRaB candles are prevalent, suggesting a period of indecision and equilibrium between buyers and sellers. Quick shifts between green, red, and blue candles indicate increased volatility and congestion, requiring traders to exercise caution and adapt their strategies accordingly.

0iUs3uq.png


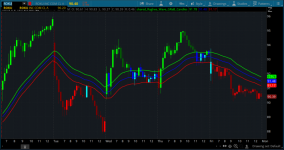
When using this to trade, you want to avoid trading when there are a lot of blue candles. When the candlesticks are just moving up and down between the wave, that means the stock is moving sideways. You don't want to trade in a choppy market.

thinkScript Code

Rich (BB code):
# 3 color GRaB candles for ThinkorSwim
# Copyright 2014 Simpler Options
# Modified for 6 Color Light/Hollow and Solid/Dark Green, Red and Blue Colored Candles for ThinkorSwim by Robert Kling

declare upper;
declare once_per_bar;

plot ema1 = ExpAverage (high, 34);
plot ema2 = ExpAverage (close, 34);
plot ema3 = ExpAverage (low, 34);
ema1.SetDefaultColor(Color.GREEN);
ema1.SetLineWeight(2);
ema2.SetDefaultColor(Color.BLUE);
ema2.SetLineWeight(2);
ema3.SetDefaultColor(Color.RED);
ema3.SetLineWeight(2);

AssignPriceColor(if close > ema1 and open < close then Color.GREEN
  else if close > ema1 and open >= close then Color.DARK_GREEN
  else if close < ema3 and open < close then Color.RED
  else if close < ema3 and open >= close then Color.DARK_RED
  else if open < close then Color.CYAN
  else if open >= close then Color.BLUE
  else Color.BLUE);

Shareable Link

https://tos.mx/qOne4N

Credit:
 

Attachments

  • 0iUs3uq.png
    0iUs3uq.png
    297.9 KB · Views: 358
Last edited by a moderator:

New Indicator: Buy the Dip

Check out our Buy the Dip indicator and see how it can help you find profitable swing trading ideas. Scanner, watchlist columns, and add-ons are included.

Download the indicator

@RocketShip There is no holy grail. This thing definitely has potential though. I don’t use it as my main trading strategy. However, it helps to determine the intraday trend and support / resistance.

 
Last edited:
@Tom4235 I use a variety of different indicators, but the 34 ema is definitely top on my list.

 
Last edited:
Some indicators change color only after the close of the candle. This can be too long to wait if you're using 3000+ tick candles. Other indicators turn sooner and may flash back and forth for a bit within that single candle until the inflection point is truly crossed. What makes the difference?

I tested this indicator in onDemand and the candles did not change colors until well after any decent entry had passed. Is anyone using this with 5-10 minute candles and does it change only after the entire candle has printed?

The HACOLT indicator, for example, is one that does not wait until the candle has completely printed before it kicks out a signal. Of course, this means there will be times when it flashed and then reverses, but those are rare.
what's the hacolt indicator script?
 
Code:
TD Ameritrade IP Company, Inc. (c) 2012-2019
#

declare lower;

input temaLength = 55;
input emaLength = 60;
input candleSizeFactor = 1.1;

assert(candleSizeFactor >= 0, "'candle size factor' must not be negative: " + candleSizeFactor);

def haOpen = CompoundValue(1, (haOpen[1] + ohlc4[1]) / 2, ohlc4);
def haClose = (haOpen + Max(high, haOpen) + Min(low, haOpen) + ohlc4) / 4;
def temaHaClose = TEMA(haClose, temaLength);
def zeroLagHaClose = 2 * temaHaClose - TEMA(temaHaClose, temaLength);
def temaTypPrice = TEMA(hl2, temaLength);
def zeroLagTypPrice = 2 * temaTypPrice - TEMA(temaTypPrice, temaLength);
def shortCandle = BodyHeight() < (high - low) * candleSizeFactor;

def keepGreen = haClose >= haOpen or haClose[1] >= haOpen[1] or close >= haClose or high > high[1] or low > low[1] or zeroLagTypPrice >= zeroLagHaClose;
def keepGreenAll = keepGreen or (keepGreen[1] and (close >= open or close >= close[1]));
def holdLong = shortCandle and high >= low[1];
def utr = keepGreenAll or (keepGreenAll[1] and holdLong);

def keepRed = haClose < haOpen or haClose[1] < haOpen[1] or zeroLagTypPrice < zeroLagHaClose;
def keepRedAll = keepRed or (keepRed[1] and (close < open or close < close[1]));
def holdShort = shortCandle and low <= high[1];
def dtr = keepRedAll or (keepRedAll[1] and holdShort);

def upw = !dtr and dtr[1] and utr;
def dnw = !utr and utr[1] and dtr;
def upwSave = if upw or dnw then upw else upwSave[1];
def buy = upw or (!dnw and upwSave);
def longTermSell = close < ExpAverage(close, emaLength);
def neutral = buy or (if longTermSell then no else neutral[1]);

plot HACOLT = if buy then 100 else if neutral then 50 else 0;
HACOLT.DefineColor("Up", Color.UPTICK);
HACOLT.DefineColor("Neutral", Color.GRAY);
HACOLT.DefineColor("Down", Color.DOWNTICK);
HACOLT.AssignValueColor(if HACOLT == 100 then HACOLT.Color("Up") else if HACOLT == 50 then HACOLT.Color("Neutral") else HACOLT.Color("Down"));
 
Hi @Monopod, try commenting out #declare once_per_bar; in the script and see if you notice any improvements in the refresh. this script should be pretty close to real time.
 
@Monopod Take a look at the 34-ema code above. In that script there is a line: declare once_per_bar; Add # in front of it. :)
 
Hello,

I would like this script to use a Hull moving average instead of an EMA, can anyone help with that? It might not be possible for all I know, because of the way the Hull mov avg is calculated.

Thanks in advance!
 
Last edited by a moderator:
Hello,

I would like this script to use a Hull moving average instead of an EMA, can anyone help with that? It might not be possible for all I know, because of the way the Hull mov avg is calculated.

Thanks in advance!

@dolomick Here's your modified study that uses a Hull Moving Average.

Code:
# 3 color GRaB candles for ThinkorSwim
# Copyright 2014 Simpler Options
# Modified for 6 Color Light/Hollow and Solid/Dark Green, Red and Blue Colored Candles for ThinkorSwim by Robert Kling

declare upper;
declare once_per_bar;

plot ema1 = HullMovingAvg (high, 34);
plot ema2 = HullMovingAvg (close, 34);
plot ema3 = HullMovingAvg (low, 34);
ema1.SetDefaultColor(Color.GREEN);
ema1.SetLineWeight(2);
ema2.SetDefaultColor(Color.BLUE);
ema2.SetLineWeight(2);
ema3.SetDefaultColor(Color.RED);
ema3.SetLineWeight(2);

AssignPriceColor(if close > ema1 and open < close then Color.GREEN
else if close > ema1 and open >= close then Color.DARK_GREEN
else if close < ema3 and open < close then Color.RED
else if close < ema3 and open >= close then Color.DARK_RED
else if open < close then Color.CYAN
else if open >= close then Color.BLUE
else Color.BLUE);
 
@dolomick Just made the ema into hma to avoid any possible confusion.

Code:
# 3 color GRaB candles for ThinkorSwim
# Copyright 2014 Simpler Options
# Modified for 6 Color Light/Hollow and Solid/Dark Green, Red and Blue Colored Candles for ThinkorSwim by Robert Kling
# Modified to HullMovingAvg by Horsrider 11/20/219

declare upper;
declare once_per_bar;

plot hma1 = hullMovingAvg (high, 34);
plot hma2 = hullMovingAvg (close, 34);
plot hma3 = hullMovingAvg (low, 34);
hma1.SetDefaultColor(Color.GREEN);
hma1.SetLineWeight(2);
hma2.SetDefaultColor(Color.BLUE);
hma2.SetLineWeight(2);
hma3.SetDefaultColor(Color.RED);
hma3.SetLineWeight(2);

AssignPriceColor(if close > hma1 and open < close then Color.GREEN
  else if close > hma1 and open >= close then Color.DARK_GREEN
  else if close < hma3 and open < close then Color.RED
  else if close < hma3 and open >= close then Color.DARK_RED
  else if open < close then Color.CYAN
  else if open >= close then Color.BLUE
  else Color.BLUE);
 
Real simple edit I made here to be used for weekly charts. 6.8 bars vs 34 to accocmodate for scale change and I changed to the line weight and styles slightly to aid visibility.

Code:
# 3 color GRaB candles for ThinkorSwim   (weekly variation)
# Copyright 2014 Simpler Options
# Modified for 6 Color Light/Hollow and Solid/Dark Green, Red and Blue Colored Candles for ThinkorSwim by Robert Kling

declare upper;
declare once_per_bar;

plot ema1 = ExpAverage (high, 6.8);
plot ema2 = ExpAverage (close, 6.8);
plot ema3 = ExpAverage (low, 6.8);
ema1.SetDefaultColor(Color.GREEN);
ema1.SetLineWeight(1);
ema2.SetDefaultColor(Color.BLUE);
ema2.SetStyle(Curve.SHORT_DASH);
ema2.SetLineWeight(1);
ema3.SetDefaultColor(Color.RED);
ema3.SetLineWeight(1);

AssignPriceColor(if close > ema1 and open < close then Color.GREEN
  else if close > ema1 and open >= close then Color.DARK_GREEN
  else if close < ema3 and open < close then Color.RED
  else if close < ema3 and open >= close then Color.DARK_RED
  else if open < close then Color.CYAN
  else if open >= close then Color.BLUE
  else Color.BLUE);
 

Volatility Trading Range

VTR is a momentum indicator that shows if a stock is overbought or oversold based on its Weekly and Monthly average volatility trading range.

Download the indicator

Similar threads

Not the exact question you're looking for?

Start a new thread and receive assistance from our community.

87k+ Posts
403 Online
Create Post

Similar threads

Similar threads

The Market Trading Game Changer

Join 2,500+ subscribers inside the useThinkScript VIP Membership Club
  • Exclusive indicators
  • Proven strategies & setups
  • Private Discord community
  • ‘Buy The Dip’ signal alerts
  • Exclusive members-only content
  • Add-ons and resources
  • 1 full year of unlimited support

Frequently Asked Questions

What is useThinkScript?

useThinkScript is the #1 community of stock market investors using indicators and other tools to power their trading strategies. Traders of all skill levels use our forums to learn about scripting and indicators, help each other, and discover new ways to gain an edge in the markets.

How do I get started?

We get it. Our forum can be intimidating, if not overwhelming. With thousands of topics, tens of thousands of posts, our community has created an incredibly deep knowledge base for stock traders. No one can ever exhaust every resource provided on our site.

If you are new, or just looking for guidance, here are some helpful links to get you started.

What are the benefits of VIP Membership?
VIP members get exclusive access to these proven and tested premium indicators: Buy the Dip, Advanced Market Moves 2.0, Take Profit, and Volatility Trading Range. In addition, VIP members get access to over 50 VIP-only custom indicators, add-ons, and strategies, private VIP-only forums, private Discord channel to discuss trades and strategies in real-time, customer support, trade alerts, and much more. Learn all about VIP membership here.
How can I access the premium indicators?
To access the premium indicators, which are plug and play ready, sign up for VIP membership here.
Back
Top