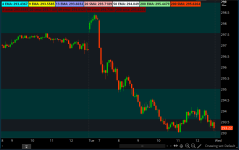
Display Moving Average (EMA or SMA) as Labels in ThinkorSwim

BenTen

Administrative
Staff member
Staff
VIP
Lifetime
This indicator will help you display the following exponential moving average (EMA) and simple moving average (SMA) as labels on your chart.
  • 9, 49, and 99 EMA
  • 20 and 200 SMA
One of our users @Raundx modified it to the following:
  • 4, 9 13, 50, and 200 EMA
  • 20 and 200 SMA
I will include both versions down below and let you pick which one you want to use.

OR9Bf3D.png


Original labels

Code:
#
# SM_MovingAverageLabels
#
# version 1.0
#

#Default moving average values:
#EXPO 9 OHLC
#SIMP 20 OHLC
#EXPO 49 OHLC
#EXPO 99 OHLC
#SIMP 200 OHLC

input MA_1_length = 9; #exponential
input MA_2_length = 20; #simple
input MA_3_length = 49; #exponential
input MA_4_length = 99; #exponential
input MA_5_length = 200; #simple

input MA_1_closeType = ohlc4;
input MA_2_closeType = ohlc4;
input MA_3_closeType = ohlc4;
input MA_4_closeType = ohlc4;
input MA_5_closeType = ohlc4;

def MA_1_avg = ExpAverage(MA_1_closeType, MA_1_length);
def MA_2_avg = Average(MA_2_closeType, MA_2_length);
def MA_3_avg = ExpAverage(MA_3_closeType, MA_3_length);
def MA_4_avg = ExpAverage(MA_4_closeType, MA_4_length);
def MA_5_avg = Average(MA_5_closeType, MA_5_length);

def currentPrice = close;

def MA_1_above = if currentPrice > MA_1_avg then 1 else 0;
def MA_1_below = if currentPrice <= MA_1_avg then 1 else 0;
AddLabel(MA_1_above, MA_1_length + " ema: " + MA_1_avg, COLOR.DARK_GREEN);
AddLabel(MA_1_below, MA_1_length + " ema: " + MA_1_avg, COLOR.DARK_RED);

def MA_2_above = if currentPrice > MA_2_avg then 1 else 0;
def MA_2_below = if currentPrice <= MA_2_avg then 1 else 0;
AddLabel(MA_2_above, MA_2_length + " sma: " + MA_2_avg, COLOR.DARK_GREEN);
AddLabel(MA_2_below, MA_2_length + " sma: " + MA_2_avg, COLOR.DARK_RED);

def MA_3_above = if currentPrice > MA_3_avg then 1 else 0;
def MA_3_below = if currentPrice <= MA_3_avg then 1 else 0;
AddLabel(MA_3_above, MA_3_length + " ema: " + MA_3_avg, COLOR.DARK_GREEN);
AddLabel(MA_3_below, MA_3_length + " ema: " + MA_3_avg, COLOR.DARK_RED);

def MA_4_above = if currentPrice > MA_4_avg then 1 else 0;
def MA_4_below = if currentPrice <= MA_4_avg then 1 else 0;
AddLabel(MA_4_above, MA_4_length + " ema: " + MA_4_avg, COLOR.DARK_GREEN);
AddLabel(MA_4_below, MA_4_length + " ema: " + MA_4_avg, COLOR.DARK_RED);

def MA_5_above = if currentPrice > MA_5_avg then 1 else 0;
def MA_5_below = if currentPrice <= MA_5_avg then 1 else 0;
AddLabel(MA_4_above, MA_5_length + " sma: " + MA_5_avg, COLOR.DARK_GREEN);
AddLabel(MA_4_below, MA_5_length + " sma: " + MA_5_avg, COLOR.DARK_RED);

Modified labels

Code:
#
# SM_MovingAverageLabels
#
# version 1.0
#

#Default moving average values:
#EXPO 4 OHLC
#EXPO 9 OHLC
#EXPO 13 OHLC
#SIMP 20 OHLC
#EXPO 50 OHLC
#EXPO 200 OHLC
#SIMP 200 OHLC

input MA_1_length = 4; #exponential
input MA_2_length = 9; #exponential
input MA_3_length = 13; #exponential
input MA_4_length = 20; #simple
input MA_5_length = 50; #exponential
input MA_6_length = 200; #exponential
input MA_7_length = 200; #simple


input MA_1_closeType = ohlc4;
input MA_2_closeType = ohlc4;
input MA_3_closeType = ohlc4;
input MA_4_closeType = ohlc4;
input MA_5_closeType = ohlc4;
input MA_6_closeType = ohlc4;
input MA_7_closeType = ohlc4;

def MA_1_avg = ExpAverage(MA_1_closeType, MA_1_length);
def MA_2_avg = ExpAverage(MA_2_closeType, MA_2_length);
def MA_3_avg = ExpAverage(MA_3_closeType, MA_3_length);
def MA_4_avg = Average(MA_4_closeType, MA_4_length);
def MA_5_avg = ExpAverage(MA_5_closeType, MA_5_length);
def MA_6_avg = ExpAverage(MA_6_closeType, MA_6_length);
def MA_7_avg = Average(MA_7_closeType, MA_7_length);

def currentPrice = close;

def MA_1_above = if currentPrice > MA_1_avg then 1 else 0;
def MA_1_below = if currentPrice <= MA_1_avg then 1 else 0;
AddLabel(MA_1_above, MA_1_length + " EMA: " + MA_1_avg, COLOR. CYAN);
AddLabel(MA_1_below, MA_1_length + " EMA: " + MA_1_avg, COLOR. CYAN);

def MA_2_above = if currentPrice > MA_2_avg then 1 else 0;
def MA_2_below = if currentPrice <= MA_2_avg then 1 else 0;
AddLabel(MA_2_above, MA_2_length + " EMA: " + MA_2_avg, COLOR. YELLOW);
AddLabel(MA_2_below, MA_2_length + " EMA: " + MA_2_avg, COLOR. YELLOW);

def MA_3_above = if currentPrice > MA_3_avg then 1 else 0;
def MA_3_below = if currentPrice <= MA_3_avg then 1 else 0;
AddLabel(MA_3_above, MA_3_length + " EMA: " + MA_3_avg, COLOR. VIOLET);
AddLabel(MA_3_below, MA_3_length + " EMA: " + MA_3_avg, COLOR. VIOLET);

def MA_4_above = if currentPrice > MA_4_avg then 1 else 0;
def MA_4_below = if currentPrice <= MA_4_avg then 1 else 0;
AddLabel(MA_4_above, MA_4_length + " SMA: " + MA_4_avg, COLOR. PINK);
AddLabel(MA_4_below, MA_4_length + " SMA: " + MA_4_avg, COLOR. PINK);

def MA_5_above = if currentPrice > MA_5_avg then 1 else 0;
def MA_5_below = if currentPrice <= MA_5_avg then 1 else 0;
AddLabel(MA_5_above, MA_5_length + " EMA: " + MA_5_avg, COLOR.WHITE);
AddLabel(MA_5_below, MA_5_length + " EMA: " + MA_5_avg, COLOR.WHITE);

def MA_6_above = if currentPrice > MA_6_avg then 1 else 0;
def MA_6_below = if currentPrice <= MA_6_avg then 1 else 0;
AddLabel(MA_6_above, MA_6_length + " EMA: " + MA_6_avg, COLOR.LIGHT_GREEN);
AddLabel(MA_6_below, MA_6_length + " EMA: " + MA_6_avg, COLOR.LIGHT_GREEN);

def MA_7_above = if currentPrice > MA_7_avg then 1 else 0;
def MA_7_below = if currentPrice <= MA_7_avg then 1 else 0;
AddLabel(MA_7_above, MA_7_length + " SMA: " + MA_7_avg, COLOR.LIGHT_RED);
AddLabel(MA_7_below, MA_7_length + " SMA: " + MA_7_avg, COLOR.LIGHT_RED);

Credit:
 

Attachments

  • OR9Bf3D.png
    OR9Bf3D.png
    73.2 KB · Views: 488

Join useThinkScript to post your question to a community of 21,000+ developers and traders.

For some reason this is displaying the moving averages with 3 decimal points instead of 2. Is there any code I can insert to just get 2 decimals? Or perhaps it is a setting in my thinkorswim?

For example : 20EMA- 20.506

I would like it to read 20.50

Thanks in advance.
 
@islandcowgirl I only have a minute. Try the below. This is for learning.
3Nw9hjp.png

This should be tried where ever MA_1... is located. Try one thing at a time.
Change the "ohlc4" to "close".
Change "MA_1_length); to "MA_1_length, 2)"
Lastly, put a ", 2 " Before and/or after "color.cyan" )
Sorry, on mobile.
 
I was looking for thinkscript that displays a label that shows buy/sell depending on the slope of 200SMA. Basically a rising sma would be a buy and declining sma would be a sell. also, do not want to include whether price is above/below just solely based on the rising/decline sma. Thanks!!
 
I would like to put a label on a chart. For example, I would like to put the name "EMA 5,10,30" but not have any calculations associated with the name. Just a plain name only.

I tried:
AddLabel ("EMA 5, 10, 30");
AddLabel Color.Yellow;

What would be the proper script for just a plain chart label? Thanks.
 
not sure if you can do it with out data but try AddLabel(yes, "EMA 5,10,30", color.YELLOW);
 
Last edited:
How do you put a label on the chart using user defined inputs. I tried the following:

input length1 = 10;
input length2 = 20;
input length3 = 30;
Input MA = EMA

AddLabel(yes, MA, lenght1, lenght2, lenght3, Color.Yellow);

I would like the label to read: EMA, 10,20,30
 
When I typed in the above script the Input MA = EMA line and the above script are highlighted in red. It says invalid statement for the Input MA = EMA line.
 
I changed Input MA = EMA to
Input MA = "EMA";
This change clears the red highlighting and the label reads "10EMA 10"

The goal is to create a label script with different input lengths that can be adjusted with different numbers and the new input numbers would automatically show up on the chart label.
 
I am looking for a label to display when price brakes either above or below the simple moving average line. (Specifically the 10 period)
 
Does anyone know of a way to have a bubble appear on-hover over a MA line that says which MA line it is?

For instance, if I hover the mouse over the 50MA, I want a bubble to appear nearby saying which MA it is.

I know it should be easy enough to set the MA lines to colors that you can remember, but my brain just doesn't work that way, and I simply can't remember them. I have to continually go into "Edit studies" to confirm and look up which line is which.
 
@rovo You can plot a bubble on a line, but it has to be fixed; thinkscript doesnt control the platform, so it isnt possible to have it appear/disappear based on the mouse position.
Here is a method you can use to plot a bubble on a moving average -
Code:
#this input moves the bubble along the sma, currently 30 bars to the left
input bubble_offset = 30;
input show_bubble = yes;

plot sma = average(close,50);

def x = !isnan(close[-bubble_offset]) and isnan(close[-bubble_offset-1]);
AddChartBubble(show_bubble and x, sma, "50 SMA", sma.takevaluecolor(), no);

Thinkscript code could be compared to a paintbrush - It colors the charts according to the math the coder puts into it, whether it is right or wrong.
 
First is I somehow put C|P boxes all over my chart, which I assume are OI calls and puts but I cant understand how to use them or even to take them off. Second is I'd like to have a tag or dialogue box for each SMA line. The colors are great for distinguishing between the lines but I'd really like to see them labeled 9D, 21D etc. I tried googling. Thank you for reading.

MUChzSU.png
 

Similar threads

Not the exact question you're looking for?

Start a new thread and receive assistance from our community.

87k+ Posts
287 Online
Create Post

Similar threads

Similar threads

The Market Trading Game Changer

Join 2,500+ subscribers inside the useThinkScript VIP Membership Club
  • Exclusive indicators
  • Proven strategies & setups
  • Private Discord community
  • ‘Buy The Dip’ signal alerts
  • Exclusive members-only content
  • Add-ons and resources
  • 1 full year of unlimited support

Frequently Asked Questions

What is useThinkScript?

useThinkScript is the #1 community of stock market investors using indicators and other tools to power their trading strategies. Traders of all skill levels use our forums to learn about scripting and indicators, help each other, and discover new ways to gain an edge in the markets.

How do I get started?

We get it. Our forum can be intimidating, if not overwhelming. With thousands of topics, tens of thousands of posts, our community has created an incredibly deep knowledge base for stock traders. No one can ever exhaust every resource provided on our site.

If you are new, or just looking for guidance, here are some helpful links to get you started.

What are the benefits of VIP Membership?
VIP members get exclusive access to these proven and tested premium indicators: Buy the Dip, Advanced Market Moves 2.0, Take Profit, and Volatility Trading Range. In addition, VIP members get access to over 50 VIP-only custom indicators, add-ons, and strategies, private VIP-only forums, private Discord channel to discuss trades and strategies in real-time, customer support, trade alerts, and much more. Learn all about VIP membership here.
How can I access the premium indicators?
To access the premium indicators, which are plug and play ready, sign up for VIP membership here.
Back
Top