This indicator will help you display the following exponential moving average (EMA) and simple moving average (SMA) as labels on your chart.

Credit:
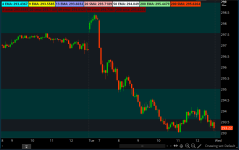
- 9, 49, and 99 EMA
- 20 and 200 SMA
- 4, 9 13, 50, and 200 EMA
- 20 and 200 SMA
Original labels
Code:
#
# SM_MovingAverageLabels
#
# version 1.0
#

#Default moving average values:
#EXPO 9 OHLC
#SIMP 20 OHLC
#EXPO 49 OHLC
#EXPO 99 OHLC
#SIMP 200 OHLC

input MA_1_length = 9; #exponential
input MA_2_length = 20; #simple
input MA_3_length = 49; #exponential
input MA_4_length = 99; #exponential
input MA_5_length = 200; #simple

input MA_1_closeType = ohlc4;
input MA_2_closeType = ohlc4;
input MA_3_closeType = ohlc4;
input MA_4_closeType = ohlc4;
input MA_5_closeType = ohlc4;

def MA_1_avg = ExpAverage(MA_1_closeType, MA_1_length);
def MA_2_avg = Average(MA_2_closeType, MA_2_length);
def MA_3_avg = ExpAverage(MA_3_closeType, MA_3_length);
def MA_4_avg = ExpAverage(MA_4_closeType, MA_4_length);
def MA_5_avg = Average(MA_5_closeType, MA_5_length);

def currentPrice = close;

def MA_1_above = if currentPrice > MA_1_avg then 1 else 0;
def MA_1_below = if currentPrice <= MA_1_avg then 1 else 0;
AddLabel(MA_1_above, MA_1_length + " ema: " + MA_1_avg, COLOR.DARK_GREEN);
AddLabel(MA_1_below, MA_1_length + " ema: " + MA_1_avg, COLOR.DARK_RED);

def MA_2_above = if currentPrice > MA_2_avg then 1 else 0;
def MA_2_below = if currentPrice <= MA_2_avg then 1 else 0;
AddLabel(MA_2_above, MA_2_length + " sma: " + MA_2_avg, COLOR.DARK_GREEN);
AddLabel(MA_2_below, MA_2_length + " sma: " + MA_2_avg, COLOR.DARK_RED);

def MA_3_above = if currentPrice > MA_3_avg then 1 else 0;
def MA_3_below = if currentPrice <= MA_3_avg then 1 else 0;
AddLabel(MA_3_above, MA_3_length + " ema: " + MA_3_avg, COLOR.DARK_GREEN);
AddLabel(MA_3_below, MA_3_length + " ema: " + MA_3_avg, COLOR.DARK_RED);

def MA_4_above = if currentPrice > MA_4_avg then 1 else 0;
def MA_4_below = if currentPrice <= MA_4_avg then 1 else 0;
AddLabel(MA_4_above, MA_4_length + " ema: " + MA_4_avg, COLOR.DARK_GREEN);
AddLabel(MA_4_below, MA_4_length + " ema: " + MA_4_avg, COLOR.DARK_RED);

def MA_5_above = if currentPrice > MA_5_avg then 1 else 0;
def MA_5_below = if currentPrice <= MA_5_avg then 1 else 0;
AddLabel(MA_4_above, MA_5_length + " sma: " + MA_5_avg, COLOR.DARK_GREEN);
AddLabel(MA_4_below, MA_5_length + " sma: " + MA_5_avg, COLOR.DARK_RED);
Modified labels
Code:
#
# SM_MovingAverageLabels
#
# version 1.0
#

#Default moving average values:
#EXPO 4 OHLC
#EXPO 9 OHLC
#EXPO 13 OHLC
#SIMP 20 OHLC
#EXPO 50 OHLC
#EXPO 200 OHLC
#SIMP 200 OHLC

input MA_1_length = 4; #exponential
input MA_2_length = 9; #exponential
input MA_3_length = 13; #exponential
input MA_4_length = 20; #simple
input MA_5_length = 50; #exponential
input MA_6_length = 200; #exponential
input MA_7_length = 200; #simple


input MA_1_closeType = ohlc4;
input MA_2_closeType = ohlc4;
input MA_3_closeType = ohlc4;
input MA_4_closeType = ohlc4;
input MA_5_closeType = ohlc4;
input MA_6_closeType = ohlc4;
input MA_7_closeType = ohlc4;

def MA_1_avg = ExpAverage(MA_1_closeType, MA_1_length);
def MA_2_avg = ExpAverage(MA_2_closeType, MA_2_length);
def MA_3_avg = ExpAverage(MA_3_closeType, MA_3_length);
def MA_4_avg = Average(MA_4_closeType, MA_4_length);
def MA_5_avg = ExpAverage(MA_5_closeType, MA_5_length);
def MA_6_avg = ExpAverage(MA_6_closeType, MA_6_length);
def MA_7_avg = Average(MA_7_closeType, MA_7_length);

def currentPrice = close;

def MA_1_above = if currentPrice > MA_1_avg then 1 else 0;
def MA_1_below = if currentPrice <= MA_1_avg then 1 else 0;
AddLabel(MA_1_above, MA_1_length + " EMA: " + MA_1_avg, COLOR. CYAN);
AddLabel(MA_1_below, MA_1_length + " EMA: " + MA_1_avg, COLOR. CYAN);

def MA_2_above = if currentPrice > MA_2_avg then 1 else 0;
def MA_2_below = if currentPrice <= MA_2_avg then 1 else 0;
AddLabel(MA_2_above, MA_2_length + " EMA: " + MA_2_avg, COLOR. YELLOW);
AddLabel(MA_2_below, MA_2_length + " EMA: " + MA_2_avg, COLOR. YELLOW);

def MA_3_above = if currentPrice > MA_3_avg then 1 else 0;
def MA_3_below = if currentPrice <= MA_3_avg then 1 else 0;
AddLabel(MA_3_above, MA_3_length + " EMA: " + MA_3_avg, COLOR. VIOLET);
AddLabel(MA_3_below, MA_3_length + " EMA: " + MA_3_avg, COLOR. VIOLET);

def MA_4_above = if currentPrice > MA_4_avg then 1 else 0;
def MA_4_below = if currentPrice <= MA_4_avg then 1 else 0;
AddLabel(MA_4_above, MA_4_length + " SMA: " + MA_4_avg, COLOR. PINK);
AddLabel(MA_4_below, MA_4_length + " SMA: " + MA_4_avg, COLOR. PINK);

def MA_5_above = if currentPrice > MA_5_avg then 1 else 0;
def MA_5_below = if currentPrice <= MA_5_avg then 1 else 0;
AddLabel(MA_5_above, MA_5_length + " EMA: " + MA_5_avg, COLOR.WHITE);
AddLabel(MA_5_below, MA_5_length + " EMA: " + MA_5_avg, COLOR.WHITE);

def MA_6_above = if currentPrice > MA_6_avg then 1 else 0;
def MA_6_below = if currentPrice <= MA_6_avg then 1 else 0;
AddLabel(MA_6_above, MA_6_length + " EMA: " + MA_6_avg, COLOR.LIGHT_GREEN);
AddLabel(MA_6_below, MA_6_length + " EMA: " + MA_6_avg, COLOR.LIGHT_GREEN);

def MA_7_above = if currentPrice > MA_7_avg then 1 else 0;
def MA_7_below = if currentPrice <= MA_7_avg then 1 else 0;
AddLabel(MA_7_above, MA_7_length + " SMA: " + MA_7_avg, COLOR.LIGHT_RED);
AddLabel(MA_7_below, MA_7_length + " SMA: " + MA_7_avg, COLOR.LIGHT_RED);
Credit: