

Williams AD Indicator with Moving Average Crossover for ThinkorSwim

tomsk

Well-known member
VIP
mod note:
Use this indicator combo if you want to stop guessing trend direction and eliminate fake breakouts.

The price channel found here:
https://usethinkscript.com/threads/larry-williams-pro-go-indicator-for-thinkorswim.4377/
along with the code below provides an institutional participation detector, confirming if real institutional money is backing the move or if retail is in charge of this trend.


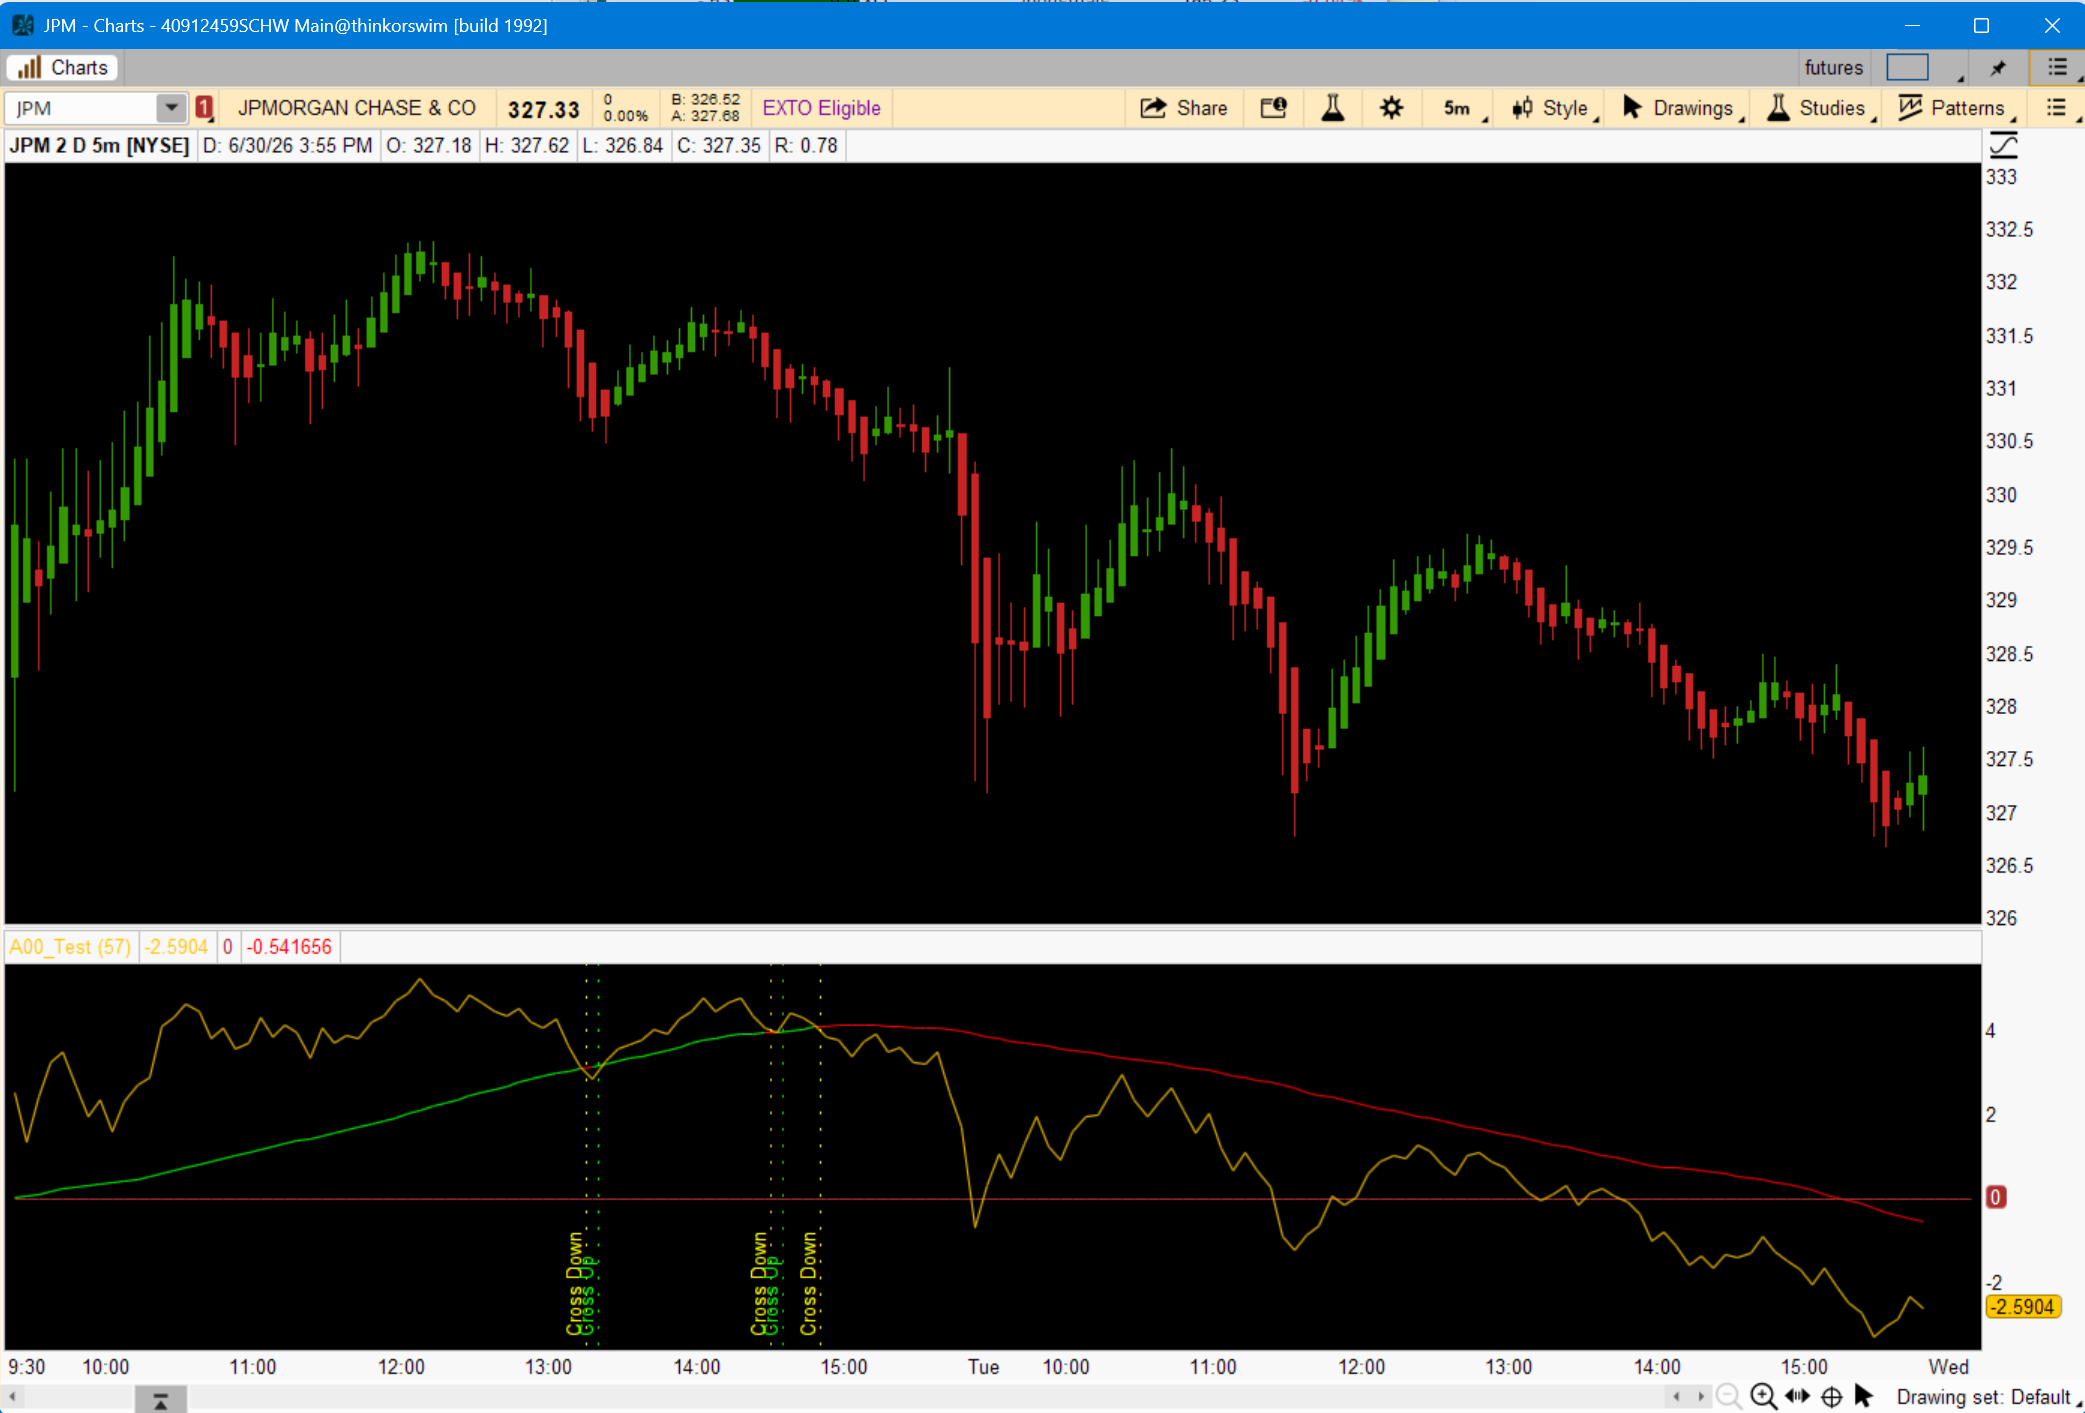
I have cobbled up a simple version of the Williams AD based on the ThinkorSwim standard Williams AD study
Added a simple moving average of the 57 period, as well as added vertical lines that signify whenever a cross up or cross down occurred
Note that the simple moving average line is color coded depending on whether it is above or below the calculated Williams AD line
p5qA73D.png

Jake Bernstein's Moving Average Channel strategy (or WAD as you say)
Here are the details:

Set-Up
Upper Indicators
  • Use HLOC price bars
  • Use daily bars but other periods should work
  • 10-period simple moving average of high (red line)
  • 8-period simple moving average of low (green line)
Lower Indicators
  • Williams Accumulation/Distribution (WAD)
  • 57-period simple moving average of Williams AD

Buy Triggers
You have three options (choices) for buying:

Option One
  • Two consecutive bars above the top of the channel (red line)
  • AND Williams AD above its 57-SMA
  • BUY
  • Risk or Stop-Loss is 2x width of the channel (2x distance between green and red lines)
Option Two
  • Wait for 5 consecutive price bars above the red line
  • BUY on the 5th bar
  • Profit target should be the distance between the highest price bar and lowest price bar
Option Three
  • Wait for price to drop into the channel or below the green line before buying
  • This is more conservative but risky because you could miss lots of profit

Here's the code

Code:
# Williams AD
# tomsk
# 11.26.2019

declare lower;

input MAlength = 57;

plot WAD = AccumDistBuyPr();
plot ZeroLine = 0;
WAD.SetDefaultColor(Color.Orange);
ZeroLine.SetDefaultColor(GetColor(5));

plot SMA = Average(WAD, MAlength) ;
SMA.SetDefaultColor(Color.Orange);
SMA.AssignValueColor(if WAD > SMA then Color.Green else Color.Red);

AddVerticalLine(WAD crosses above SMA, "Cross Up", Color.Green, Curve.Points);
AddVerticalLine(WAD crosses below SMA, "Cross Down", Color.Yellow, Curve.Points);
# End Williams AD
 
Last edited by a moderator:

Join useThinkScript to post your question to a community of 21,000+ developers and traders.

Some notes from ThinkScript Lounge August 1, 2018:
14:30 Mobius: Scan for WilliamsAd is

AccumDistBuyPR() crosses above 0

14:30 Mobius: or below 0 or > 0 or < 0 whatever floats your boat
14:31 Mobius: if you use crosses it'd be best for it to be a dynamic watchlist scan
14:32 KC_Mama: Thank you everyone! I think I can do it now.
14:33 Mobius: lol it was just provided for you what's to do
14:34 KC_Mama: LOL!
14:34 Mobius: WillimsAD is the same code as AccumDistBuyPr() in TOS The WilliamsAD just references that code
14:36 Nube: Drats, now I gotta check to see if we can pass arguments to AccumDistBuyPr()
14:37 Nube: But also nice to know.
14:37 Mobius: What won't make sense to you is that when you get a signal from the scanner it's looking at the TotalSum of bars in a fixed range that may of may not match your charts range.
 
Last edited by a moderator:
First, thank everyone in this community for sharing. You have differently increased my knowledge and lessen the learning curve. I took my first dive in writing code tonight to set up a scan to catch stock when the WAD crosses an EMA. If someone can take a look at the code and let me know if I am in the ballpark or outside still in the parking lot.

Code:
def data = reference WIlliamsAD()."WAD";
def ema = ExpAverage(close,14);
def crossingAbove = ema[1] < data[1] and ema > data;
def crossingBelow = ema[1] > data[1] and ema < data;
# scan for crossing above
#plot scan = crossingAbove;
# scan for crossing below
plot scan = crossingBelow;
 
Last edited by a moderator:
The 57 for the SMA period likely comes from Jake Bernstein's WAD moving average strategy. It seems to be a decent strategy.
 
Last edited by a moderator:
The 57 MA works nicely on the 1m and 5m timeframes. I noticed that crossovers on the 1m chart can be nice scalping opportunities and on the 5m pullback to ADMA work nicely when the market is trending.
 
Here is a version of WAD with 2 MA's with color. I find them to be useful. WAD 2MAs

Code:
# Williams AD with 2MAs

declare lower;

input MAlength = 21;
input MAlength2 = 200;

plot WAD = AccumDistBuyPr();
WAD.SetDefaultColor(Color.ORANGE);

plot SMA = Average(WAD, MAlength) ;
SMA.SetDefaultColor(Color.ORANGE);

SMA.SetLineWeight(1);
SMA.AssignValueColor(if SMA < WAD then Color.Light_GREEN else Color.Dark_Red);

WAD.SetLineWeight(2);
WAD.AssignValueColor(if WAD > SMA then Color.GREEN else Color.Light_RED);

plot SMA2 = Average(WAD, MAlength2);
SMA2.SetLineWeight(2);
SMA2.AssignValueColor(if SMA2 < WAD then Color.Light_GREEN else Color.Dark_Red);

plot ZeroLine = 0;
ZeroLine.SetDefaultColor(GetColor(5));

# End Williams AD
 
Last edited by a moderator:

Similar threads

Not the exact question you're looking for?

Start a new thread and receive assistance from our community.

87k+ Posts
1637 Online
Create Post

Similar threads

Similar threads

The Market Trading Game Changer

Join 2,500+ subscribers inside the useThinkScript VIP Membership Club
  • Exclusive indicators
  • Proven strategies & setups
  • Private Discord community
  • ‘Buy The Dip’ signal alerts
  • Exclusive members-only content
  • Add-ons and resources
  • 1 full year of unlimited support

Frequently Asked Questions

What is useThinkScript?

useThinkScript is the #1 community of stock market investors using indicators and other tools to power their trading strategies. Traders of all skill levels use our forums to learn about scripting and indicators, help each other, and discover new ways to gain an edge in the markets.

How do I get started?

We get it. Our forum can be intimidating, if not overwhelming. With thousands of topics, tens of thousands of posts, our community has created an incredibly deep knowledge base for stock traders. No one can ever exhaust every resource provided on our site.

If you are new, or just looking for guidance, here are some helpful links to get you started.

What are the benefits of VIP Membership?
VIP members get exclusive access to these proven and tested premium indicators: Buy the Dip, Advanced Market Moves 2.0, Take Profit, and Volatility Trading Range. In addition, VIP members get access to over 50 VIP-only custom indicators, add-ons, and strategies, private VIP-only forums, private Discord channel to discuss trades and strategies in real-time, customer support, trade alerts, and much more. Learn all about VIP membership here.
How can I access the premium indicators?
To access the premium indicators, which are plug and play ready, sign up for VIP membership here.
Back
Top
