

mod note:
Use this indicator combo if you want to stop guessing trend direction and eliminate fake breakouts.
The price channel found here:
https://usethinkscript.com/threads/larry-williams-pro-go-indicator-for-thinkorswim.4377/
along with the code below provides an institutional participation detector, confirming if real institutional money is backing the move or if retail is in charge of this trend.
I have cobbled up a simple version of the Williams AD based on the ThinkorSwim standard Williams AD study
Added a simple moving average of the 57 period, as well as added vertical lines that signify whenever a cross up or cross down occurred
Note that the simple moving average line is color coded depending on whether it is above or below the calculated Williams AD line
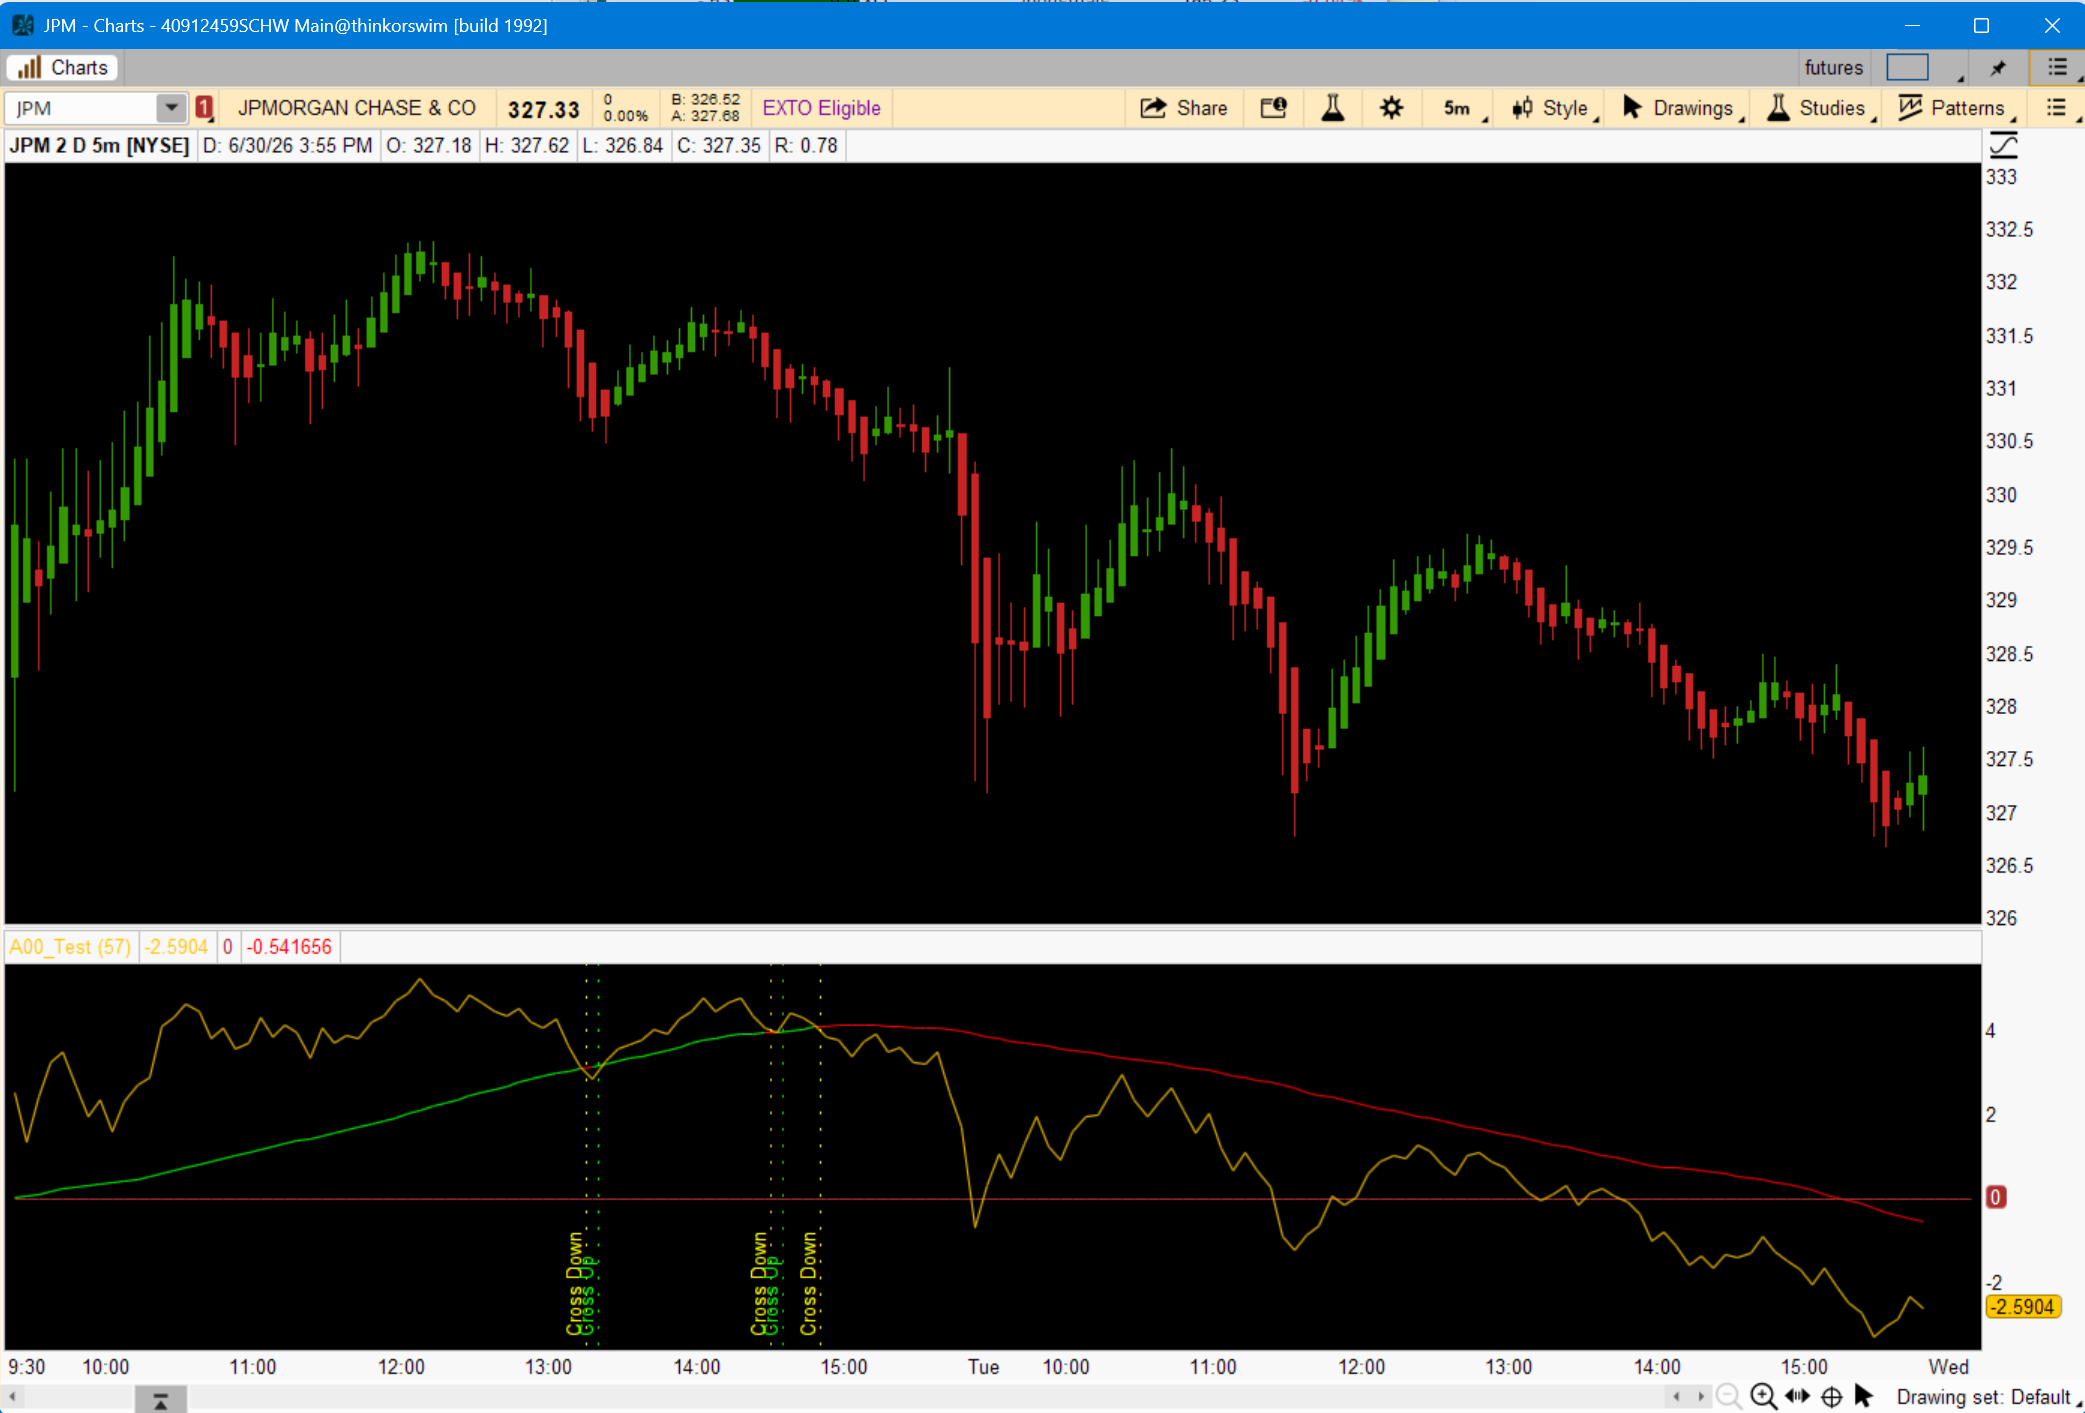
Jake Bernstein's Moving Average Channel strategy (or WAD as you say)
Here are the details:
Set-Up
Upper Indicators
Buy Triggers
You have three options (choices) for buying:
Option One
Here's the code
Use this indicator combo if you want to stop guessing trend direction and eliminate fake breakouts.
The price channel found here:
https://usethinkscript.com/threads/larry-williams-pro-go-indicator-for-thinkorswim.4377/
along with the code below provides an institutional participation detector, confirming if real institutional money is backing the move or if retail is in charge of this trend.
I have cobbled up a simple version of the Williams AD based on the ThinkorSwim standard Williams AD study
Added a simple moving average of the 57 period, as well as added vertical lines that signify whenever a cross up or cross down occurred
Note that the simple moving average line is color coded depending on whether it is above or below the calculated Williams AD line
Jake Bernstein's Moving Average Channel strategy (or WAD as you say)
Here are the details:
Set-Up
Upper Indicators
- Use HLOC price bars
- Use daily bars but other periods should work
- 10-period simple moving average of high (red line)
- 8-period simple moving average of low (green line)
- Williams Accumulation/Distribution (WAD)
- 57-period simple moving average of Williams AD
Buy Triggers
You have three options (choices) for buying:
Option One
- Two consecutive bars above the top of the channel (red line)
- AND Williams AD above its 57-SMA
- BUY
- Risk or Stop-Loss is 2x width of the channel (2x distance between green and red lines)
- Wait for 5 consecutive price bars above the red line
- BUY on the 5th bar
- Profit target should be the distance between the highest price bar and lowest price bar
- Wait for price to drop into the channel or below the green line before buying
- This is more conservative but risky because you could miss lots of profit
Here's the code
Code:
# Williams AD
# tomsk
# 11.26.2019

declare lower;

input MAlength = 57;

plot WAD = AccumDistBuyPr();
plot ZeroLine = 0;
WAD.SetDefaultColor(Color.Orange);
ZeroLine.SetDefaultColor(GetColor(5));

plot SMA = Average(WAD, MAlength) ;
SMA.SetDefaultColor(Color.Orange);
SMA.AssignValueColor(if WAD > SMA then Color.Green else Color.Red);

AddVerticalLine(WAD crosses above SMA, "Cross Up", Color.Green, Curve.Points);
AddVerticalLine(WAD crosses below SMA, "Cross Down", Color.Yellow, Curve.Points);
# End Williams AD
Last edited by a moderator:


