You are using an out of date browser. It may not display this or other websites correctly.
You should upgrade or use an alternative browser.
You should upgrade or use an alternative browser.
Williams’ VIX Fix Indicator for ThinkorSwim
- Thread starter BenTen
- Start date
-
- Tags
- volatility
Join useThinkScript to post your question to a community of 21,000+ developers and traders.
@diazlaz @blakecmathis @Trading51
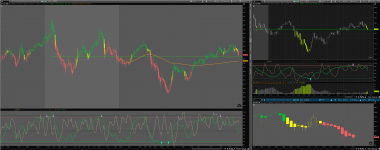
This was already done in ToS. I have had it for some time. Buy and sell in same study. I added the color bars for those that like them. I will not be using that part.
This was already done in ToS. I have had it for some time. Buy and sell in same study. I added the color bars for those that like them. I will not be using that part.
Code:
# Inverse CM_Williams_Vix_Fix Study
# by Jaime Pinto
# Aug/25/2016
# Candle Colors added by Horserider 11/8/2019

declare lower;

input pd = 22; # title="LookBack Period Standard Deviation High")
input bbl = 20; # title="Bolinger Band Length")
input mult = 2.0; #   , minval=1, maxval=5, title="Bollinger Band Standard Devaition Up")
input lookBack = 50; # title="Look Back Period Percentile High")
input ph = .85; # title="Highest Percentile - 0.90=90%, 0.95=95%, 0.99=99%")
#input pl = 1.01; # title="Lowest Percentile - 1.10=90%, 1.05=95%, 1.01=99%")
def hp = no; # title="Show High Range - Based on Percentile and LookBack Period?")
def sd = no; # title="Show Standard Deviation Line?")


def WVF_buy = (Highest(close, pd) - low) / (Highest(close, pd)) * 100;

plot Inv_WVF_buy =  -WVF_buy;
Inv_WVF_buy.SetPaintingStrategy(PaintingStrategy.HISTOGRAM);
Inv_WVF_buy.SetLineWeight(3);

def WVF_sell = (Lowest(close, pd) - high) / (Lowest(close, pd)) * 100;

plot Inv_WVF_sell = -WVF_sell;
Inv_WVF_sell.SetPaintingStrategy(PaintingStrategy.HISTOGRAM);
Inv_WVF_sell.SetLineWeight(3);

def sDev_buy = mult * StDev(WVF_buy, bbl);
def MidLine_buy = Average(WVF_buy, bbl);

def sDev_sell = mult * StDev(WVF_sell, bbl);
def MidLine_sell = Average(WVF_sell, bbl);

def UpperBand = MidLine_buy + sDev_buy;
def LowerBand = MidLine_sell - sDev_sell;
plot UB = if sd then UpperBand else Double.NaN;
plot LB = if sd then LowerBand else Double.NaN;
UB.SetDefaultColor(Color.DARK_GREEN);
LB.SetDefaultColor(Color.DARK_RED);

def rangeHigh = (Highest(WVF_buy, lookBack)) * ph;
plot rH = if hp then rangeHigh else Double.NaN;
rH.SetDefaultColor(Color.DARK_GREEN);

def rangeLow = (Lowest(WVF_sell, lookBack)) * ph;
plot rL = if hp then rangeLow else Double.NaN;
rL.SetDefaultColor(Color.DARK_RED);

def buy = WVF_buy >= UpperBand or  WVF_buy >= rangeHigh;
def sell = WVF_sell <= LowerBand or  WVF_sell <= rangeLow;

Inv_WVF_buy.AssignValueColor(if buy then Color.RED else Color.GRAY);
Inv_WVF_sell.AssignValueColor(if sell then Color.GREEN else Color.GRAY);

plot BULL = if buy[1] + buy[2] + buy[3] >= 3 and buy == 0 then -WVF_buy else Double.NaN;
BULL.SetPaintingStrategy(PaintingStrategy.ARROW_UP);
BULL.AssignValueColor(Color.WHITE);
BULL.SetLineWeight(2);

plot BEAR = if sell[1] + sell[2] + sell[3] >= 3 and sell == 0 then -WVF_sell else Double.NaN;
BEAR.SetPaintingStrategy(PaintingStrategy.ARROW_DOWN);
BEAR.AssignValueColor(Color.YELLOW);
BEAR.SetLineWeight(2);

plot zeroLine = 0;
zeroLine.SetDefaultColor(Color.GRAY);

input colorCandles = yes; #hint Color Candles

AssignPriceColor(if buy then Color.RED else if sell then Color.GREEN else Color.GRAY);blakecmathis
Well-known member
I think BT's asking what conditions you want exactly? have you not decided yet?I prefer to use it intraday on a single chart and would like to get alerts once conditions are triggered
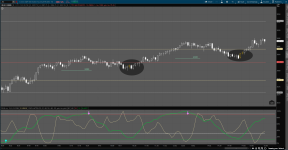
I was thinking about the static amount bit, the problem is that the scale is different for every stock/fund. One thing I noticed is that you wont see the reversal hint until the VF tops out and starts coming back down. Just going up to "overbought" doesnt mean it wont go up more. Eyeballing the move above or below the average though, doesn't look too terribly helpfulPerhaps a screenshot is in order -basically 2 possible alerts, one is when the WVF crosses above/below the mean and another is a possible cross above/below a user-defined static amount (refer to the horizontal line in the screenshot as an example).
Here is the alert code for above or below average:
Alert(WVF crosses above mean, "VixFIX crosses above average", Alert.Bar, Sound.Ring);
Alert(WVF crosses below mean, "VixFIX crosses below average", Alert.Bar, Sound.Ring);
the crosses are more designed for alert purposes rather than actionable entry/exit signals - I was thinking setting a drawing alert could be used in lieu of code but that doesn't seem to be an option for lower panes -thanks for the mean cross code though -any other ideas to the user-defined threshold code is welcome
Here's a percentile version I threw together. I was thinking you could use it as a scan. Just scan for R is greater than 90, etc to find the stocks that are schizing out. You will need to adjust the number of bars to the current aggregation youre on. I think theres a way to do it automatically kind of like getaggregationperiod, but I don't remember off the top of my head.
Code:
#Dilbert_VixFix
# V1.0  - 052816 - Dilbert - 1st code cut
# VixFix is a pretty close approximation to the standard VIX or implied volatility.  It can be used on intraday chart aggregations, and on symbols that do not have options.  When VixFIX spikes high it provides some pretty good buy signals.
input OverSold = .1;  # .1 good for SPY 1 day 1 minute chart
input OverBought = .01;  # .01 good for SPY 1 day 1 minute chart
input LengthVF = 22;
input LengthMA = 20;
input percentilelength = 252;
declare lower;
def C = close;
def L = low;
def VixFix = (Highest (C, LengthVF) - L) / (Highest (C, LengthVF)) * 100;
def agg= getaggregationPeriod();
#VixFix.AssignValueColor(Color.GREEN);
#plot OS = OverSold;
#OS.AssignValueColor(Color.CYAN);
#plot OB = OverBought;
#OB.AssignValueColor(Color.CYAN);
Alert(VixFix crosses above OverSold, "VixFIX crosses above OverSold", Alert.Bar, Sound.Ring);
#Alert(VixFix > OverSold, "VixFIX > OverSold", Alert.TICK, Sound.Ring);

plot range = round((vixfix/highest(vixfix,percentilelength)) * 100,0);a label showing/saying what?@wtf_dude would it possible to add a label to the code?
Yessir. I also threw in color function inputs so that you can set high and low threshold to change the label color. The default colors are that if the vf is higher than 70% = green and if its below 30% its red. Just based those off of the common goals for option selling.@wtf_dude I meant the range value
Code:
#Dilbert_VixFix
# V1.0  - 052816 - Dilbert - 1st code cut
# VixFix is a pretty close approximation to the standard VIX or implied volatility.  It can be used on intraday chart aggregations, and on symbols that do not have options.  When VixFIX spikes high it provides some pretty good buy signals.
input OverSold = .1;  # .1 good for SPY 1 day 1 minute chart
input OverBought = .01;  # .01 good for SPY 1 day 1 minute chart
input LengthVF = 22;
input LengthMA = 20;
input percentilelength = 252;
input avg_length= 5;
declare lower;
def C = close;
def L = low;
def VixFix = (Highest (C, LengthVF) - L) / (Highest (C, LengthVF)) * 100;
def agg= getaggregationPeriod();
#VixFix.AssignValueColor(Color.GREEN);
#plot OS = OverSold;
#OS.AssignValueColor(Color.CYAN);
#plot OB = OverBought;
#OB.AssignValueColor(Color.CYAN);
Alert(VixFix crosses above OverSold, "VixFIX crosses above OverSold", Alert.Bar, Sound.Ring);
#Alert(VixFix > OverSold, "VixFIX > OverSold", Alert.TICK, Sound.Ring);

plot range = round((vixfix/highest(vixfix,percentilelength)) * 100,0);
plot avg = simplemovingavg(range,avg_length);
avg.setdefaultcolor(color.magenta);


# BollingerBands code

#input ShowBollingerBands = No;
#input displace = 0;
#input BBlength = 20;
#input Num_Dev_Dn = -2.0;
#input Num_Dev_up = 2.0;
#input averageType = AverageType.Simple;

#def sDev = stdev(data = VixFix[-displace], length = BBlength);
#def MidLine = MovingAverage(averageType, data = VixFix[-displace], length = BBlength);

#def LowerBand = MidLine + num_Dev_Dn * sDev;
#def UpperBand = MidLine + num_Dev_Up * sDev;
#plot LB = if ShowBollingerBands then LowerBand else Double.NaN;
#plot UB = if ShowBollingerBands then UpperBand else Double.NaN;
#LB.SetDefaultColor(GetColor(0));
#UB.SetDefaultColor(GetColor(5));


#VixFix.AssignValueColor(if VixFix > UpperBand then Color.Green else Color.Red);

input corrLength = 20;
def correlationWith = ImpVolatility();

def CorrelationIV = correlation(VixFix, correlationWith, corrLength);
#CorrelationIV.SetDefaultColor(color.light_gray);
addlabel(yes, "Correlation w IV: "+ correlationIV,color.light_gray);

input high_VF = 70;
input low_VF = 30;

addlabel(yes, "VixFix: "+ aspercent(range/100),if range>=high_vf then color.green else if range<= low_vf then color.downtick else color.light_gray);@diazlaz thanks for posting! how do you interpret this? Once the green bar occurs, there's a continuing trend? and once a grey bar follows the yellow one, the trend is now over = a bottom? Would appreciate some help, thanks!
Do you think you could upload the code for your trend indicator that you were working on? Is it possible for you to update your code to show colored circles instead of bar coloring?
Also the version that you had ported had some other filter criteria that changed the bar colors based on confirmation or something, that had a more stringent filter... does your code have this? thanks for the great work.
Last edited:
Similar threads
-
-
-
Bill Williams Green, Squat, Fade, Fake Bars and Zone Bars for ThinkorSwim
- Started by henry1224
- Replies: 30
-
-
Not the exact question you're looking for?
Start a new thread and receive assistance from our community.
87k+
Posts
745
Online
Similar threads
-
-
-
Bill Williams Green, Squat, Fade, Fake Bars and Zone Bars for ThinkorSwim
- Started by henry1224
- Replies: 30
-
-
Similar threads
-
-
-
Bill Williams Green, Squat, Fade, Fake Bars and Zone Bars for ThinkorSwim
- Started by henry1224
- Replies: 30
-
-
The Market Trading Game Changer
Join 2,500+ subscribers inside the useThinkScript VIP Membership Club
- Exclusive indicators
- Proven strategies & setups
- Private Discord community
- ‘Buy The Dip’ signal alerts
- Exclusive members-only content
- Add-ons and resources
- 1 full year of unlimited support
Frequently Asked Questions
What is useThinkScript?
useThinkScript is the #1 community of stock market investors using indicators and other tools to power their trading strategies. Traders of all skill levels use our forums to learn about scripting and indicators, help each other, and discover new ways to gain an edge in the markets.
How do I get started?
We get it. Our forum can be intimidating, if not overwhelming. With thousands of topics, tens of thousands of posts, our community has created an incredibly deep knowledge base for stock traders. No one can ever exhaust every resource provided on our site.
If you are new, or just looking for guidance, here are some helpful links to get you started.
- The most viewed thread:
https://usethinkscript.com/threads/repainting-trend-reversal-for-thinkorswim.183/ - Our most popular indicator:
https://usethinkscript.com/threads/buy-the-dip-indicator-for-thinkorswim.3553/ - Answers to frequently asked questions:
https://usethinkscript.com/threads/answers-to-commonly-asked-questions.6006/
What are the benefits of VIP Membership?
VIP members get exclusive access to these proven and tested premium indicators: Buy the Dip, Advanced Market Moves 2.0, Take Profit, and Volatility Trading Range. In addition, VIP members get access to over 50 VIP-only custom indicators, add-ons, and strategies, private VIP-only forums, private Discord channel to discuss trades and strategies in real-time, customer support, trade alerts, and much more. Learn all about VIP membership here.
How can I access the premium indicators?
To access the premium indicators, which are plug and play ready, sign up for VIP membership here.


