VWAP Volume Breakout Indicator for ThinkorSwim

BenTen

Administrative
Staff member
Staff
VIP
Lifetime
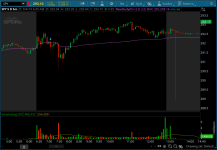
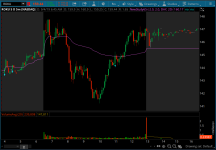
This breakout indicator identifies bullish and bearish trend when a candle crosses VWAP with abnormal volume. The way it defines high volume breakout is by using the Volume Average indicator with the length of 20 simple moving average. You can adjust this settings to your liking once you have the indicator added.

You will see a buy or sell signal when the breakout is detected.

ZMcN6hl.png

yfPBKbb.png


thinkScript Code

Code:
# VWAP Breakout Above Average Volume
# Assembled by BenTen at useThinkScript.com

# You are free to use this code for personal use, and make derivative works from it.
# You are NOT GRANTED permission to use this code (or derivative works) for commercial
# purposes which includes and is not limited to selling, reselling, or packaging with
# other commercial indicators. Headers and attribution in this code should remain as provided,
# and any derivative works should extend the existing headers.

# Start VWAP
input numDevDn = -2.0;
input numDevUp = 2.0;
input timeFrame = {default DAY, WEEK, MONTH};

def cap = getAggregationPeriod();
def errorInAggregation =
    timeFrame == timeFrame.DAY and cap >= AggregationPeriod.WEEK or
    timeFrame == timeFrame.WEEK and cap >= AggregationPeriod.MONTH;
assert(!errorInAggregation, "timeFrame should be not less than current chart aggregation period");

def yyyyMmDd = getYyyyMmDd();
def periodIndx;
switch (timeFrame) {
case DAY:
    periodIndx = yyyyMmDd;
case WEEK:
    periodIndx = Floor((daysFromDate(first(yyyyMmDd)) + getDayOfWeek(first(yyyyMmDd))) / 7);
case MONTH:
    periodIndx = roundDown(yyyyMmDd / 100, 0);
}
def isPeriodRolled = compoundValue(1, periodIndx != periodIndx[1], yes);

def volumeSum;
def volumeVwapSum;
def volumeVwap2Sum;

if (isPeriodRolled) {
    volumeSum = volume;
    volumeVwapSum = volume * vwap;
    volumeVwap2Sum = volume * Sqr(vwap);
} else {
    volumeSum = compoundValue(1, volumeSum[1] + volume, volume);
    volumeVwapSum = compoundValue(1, volumeVwapSum[1] + volume * vwap, volume * vwap);
    volumeVwap2Sum = compoundValue(1, volumeVwap2Sum[1] + volume * Sqr(vwap), volume * Sqr(vwap));
}
def price = volumeVwapSum / volumeSum;
def deviation = Sqrt(Max(volumeVwap2Sum / volumeSum - Sqr(price), 0));

plot VWAP = price;
#plot UpperBand = price + numDevUp * deviation;
#plot LowerBand = price + numDevDn * deviation;

VWAP.setDefaultColor(getColor(0));

# Start Volume
input length = 20;
def Vol = volume;
def VolAvg = Average(volume, length);

def above_volume = Vol > VolAvg;
def bullish_vwap = close crosses above VWAP;

plot bull = above_volume and bullish_vwap;
bull.AssignValueColor(Color.CYAN);
bull.SetPaintingStrategy(PaintingStrategy.BOOLEAN_ARROW_UP);

def bearish_vwap = close crosses below VWAP;
plot bear = above_volume and bearish_vwap;
bear.AssignValueColor(Color.CYAN);
bear.SetPaintingStrategy(PaintingStrategy.BOOLEAN_ARROW_DOWN);

Shareable Link

https://tos.mx/cK8isN
 

Attachments

  • ZMcN6hl.png
    ZMcN6hl.png
    90.7 KB · Views: 330
  • yfPBKbb.png
    yfPBKbb.png
    83.8 KB · Views: 337
Last edited:
Hey Ben thanks for scripting this, do you think adding the below code to your existing code, will alert me when that blue arrow shows up for Buy/Sell. Thank You
# End Study
# Added Alerts 2020-03-11
Alert(Vol crosses above VolAvg and close crosses above VWAP, text = "Buy", sound = Sound.Bell, "alert type" = Alert.BAR);
Alert(close crosses below VWAP, text = "Sell", sound = sound.Bell, "alert type" = Alert.BAR );
 
@mohitdas This should do it:

Code:
# Alerts
Alert(bull, " ", Alert.Bar, Sound.Chimes);
Alert(bear, " ", Alert.Bar, Sound.Bell);
 
@Brad This indicator does not produce any late signals. If anything, it's the issue with the alert or the alert may be going off before the candle is closed for confirmation.
 
You can build a scanner first, then save it as a watchlist and get alerted for new changes within that watchlist.

8UqiNgd.png


Regarding the second question, answer is no.
 
Thank you so much Mr Ben. One last question and i hope I am not annoying with this. In the screenshot below, is it possible to have the alert as function of the study instead of a fixed number?

CiVgsby.png
 
Last edited by a moderator:
@BenTen - thanks for creating this - this is awesome. I am trying to set up a scanner (and ultimately an alert) for when these conditions are true. I was able to set up the scanner and receive results (have configured: 1 BAR AND ("BULL = True" OR "Bear = true")), but when I look at the chart, it is not what I expect, since I would expect the blue arrows to be within the timeframe I configure on my filter (in this case 5 min). My end result that I am trying to get is a scanner that ONLY shows me the results for stocks that meat the condition within 5 minutes of present time. Hope that makes sense.
 
@vmseller Did you select the correct timeframe? Do you have pre-market enabled on your chart? If not, you would have to disable extended hours for your scanner as well.
 

Join useThinkScript to post your question to a community of 21,000+ developers and traders.

Similar threads

Not the exact question you're looking for?

Start a new thread and receive assistance from our community.

87k+ Posts
522 Online
Create Post

Similar threads

Similar threads

The Market Trading Game Changer

Join 2,500+ subscribers inside the useThinkScript VIP Membership Club
  • Exclusive indicators
  • Proven strategies & setups
  • Private Discord community
  • ‘Buy The Dip’ signal alerts
  • Exclusive members-only content
  • Add-ons and resources
  • 1 full year of unlimited support

Frequently Asked Questions

What is useThinkScript?

useThinkScript is the #1 community of stock market investors using indicators and other tools to power their trading strategies. Traders of all skill levels use our forums to learn about scripting and indicators, help each other, and discover new ways to gain an edge in the markets.

How do I get started?

We get it. Our forum can be intimidating, if not overwhelming. With thousands of topics, tens of thousands of posts, our community has created an incredibly deep knowledge base for stock traders. No one can ever exhaust every resource provided on our site.

If you are new, or just looking for guidance, here are some helpful links to get you started.

What are the benefits of VIP Membership?
VIP members get exclusive access to these proven and tested premium indicators: Buy the Dip, Advanced Market Moves 2.0, Take Profit, and Volatility Trading Range. In addition, VIP members get access to over 50 VIP-only custom indicators, add-ons, and strategies, private VIP-only forums, private Discord channel to discuss trades and strategies in real-time, customer support, trade alerts, and much more. Learn all about VIP membership here.
How can I access the premium indicators?
To access the premium indicators, which are plug and play ready, sign up for VIP membership here.
Back
Top