
germanburrito
Active member
In honor of GME going to 300 I'm sharing a script that uses the RSI instead of price for the VWAP. I use it on the today 5 minute graph if anyone knows how to set it up daily, weekly or monthly it would be great.

Code:
declare lower;

input length = 14;
input price = close;
input averageType = AverageType.simple;
input ratio = 2.236;
DefineGlobalColor("RisingMA", color.uptick);
DefineGlobalColor("FallingMA", color.downtick);

def NetChgAvg = MovingAverage(averageType, price - price[1], length);
def TotChgAvg = MovingAverage(averageType, AbsValue(price - price[1]), length);
def ChgRatio = if TotChgAvg != 0 then NetChgAvg / TotChgAvg else 0;

def RSI = 50 * (ChgRatio + 1);


def o = (RSI + RSI[1]) / 2;

def h = Max(RSI, RSI[1]);

def l = Min(RSI, RSI[1]);

def c = RSI;

def hl2 = (h+l)/2;
AddChart(high = h, low = l, open = o, close = c, type = ChartType.CANDLE, Color.WHITE);
input charttype = ChartType.CANDLE;


def Data = BarNumber();
input Number_Of_Bar = 1;

def bar =  Data >= Number_Of_Bar;
def pv = if bar then pv[1] + hl2 * volume else 0;
def cumvolume = if bar then cumvolume[1] + volume else 0;
plot vw = pv / cumvolume;
def bars = Data - Number_Of_Bar;
def sample = if bar then sample[1] + Sqr(hl2 - vw) else 0;
def var = sample / bars;
def dev = Sqrt(var);

plot dev1 =  vw + (dev * ratio);
plot dev2 = vw - (dev * ratio);

vw.setdefaultColor(color.yellow);
dev1.SetDefaultColor(Color.White);
dev2.SetDefaultColor(Color.White);


dev1.Setlineweight(2);
dev2.Setlineweight(2);


vw.SetLineWeight(3);
#vw.AssignValueColor(if rsi > vw
                           #then color.light_GREEN
                           #else color.light_RED);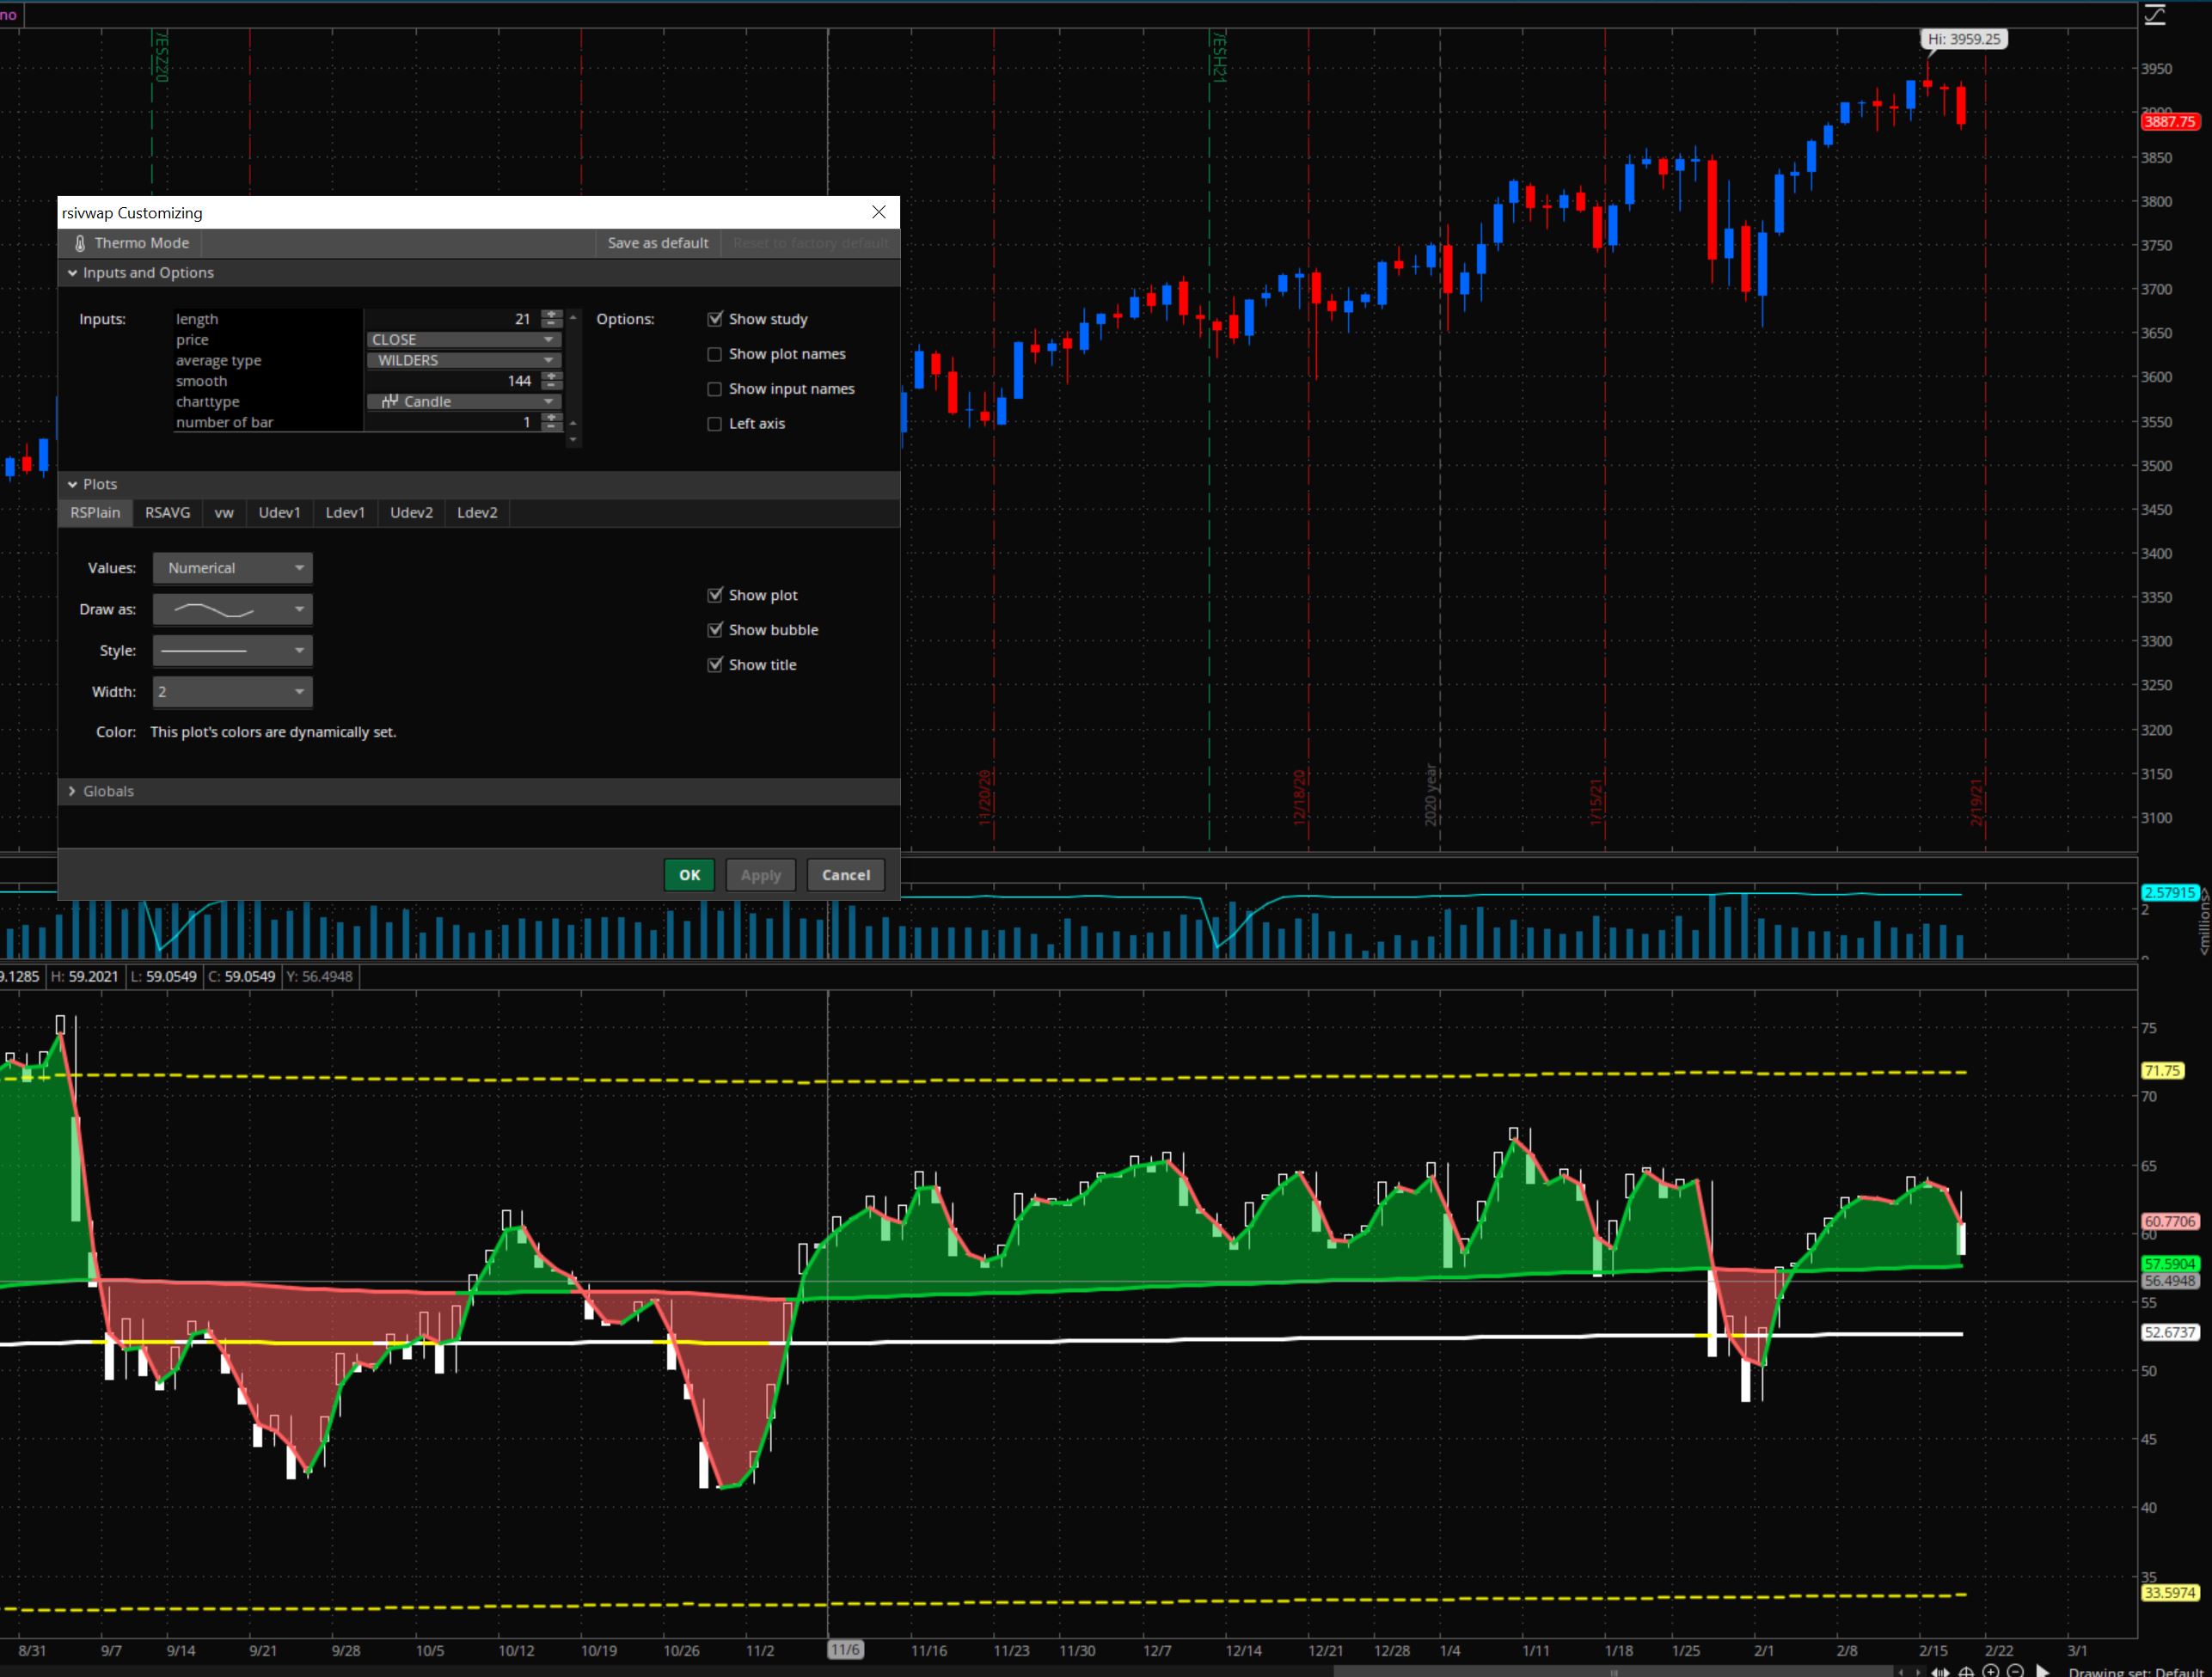
")