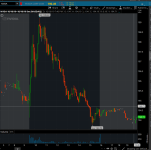
This indicator is just a simple modification of the original script called SJ_VSA_Reversals that was based on Volume Price Analysis (VPA). Someone wanted to turn the bubble signals into arrows so here it is.
With the arrows, it just makes it easier for the signals to be displayed on your chart. Moreover, you can use it to scan for new signals on the hourly, daily, etc. The Volume Reversals indicator also come with alerts (by default from the original).


With the arrows, it just makes it easier for the signals to be displayed on your chart. Moreover, you can use it to scan for new signals on the hourly, daily, etc. The Volume Reversals indicator also come with alerts (by default from the original).
thinkScript Code
Code:
# Volume Reversals Indicator
# Original SJ_VSA_Reversals (found in thinkScript Lounge)
# Modified by BenTen at useThinkScript.com
# Replaced chart bubbles with arrows

# Arguments

def length = 40;

def displace = 0;

def volumeEMALength = 30;

def narrowSpreadFactor = 0.7;

def wideSpreadFactor = 1.5;

def aboveAvgVolfactor = 1.5;

def ultraHighVolfactor = 2;

def highCloseFactor = 0.70;

def lowCloseFactor = 0.25;

def GdojiFactor = 0.2; # C_RP

def WickFactor = 0.1; # C_RP

def shortTermLength = 5; #C_RP

def midTermLength = 15; #C_RP

def longTermLength = 40; #C_RP

input colorBars = {false, default true}; #C_RP

input trendText = {false, default true};

input volumeDefinitions = { false, default true };

input alerts = { default false, true };

# Calculations

rec spread = high - low;

def median = (high + low ) / 2;

rec avgVolume = compoundValue(volumeEMALength, ExpAverage(volume, volumeEMALength), Double.NaN);

# Calculate Volume moving average and it's standard deviation

rec sAvgVolume =  compoundValue(volumeEMALength, Average(volume, volumeEMALength), Double.NaN);

def sAvgVolumeSTD = stdev(sAvgVolume, volumeEMALength);

# check if the vloume has been decreasing in the past two days.

def isTwoDaysLowVol = (volume < volume[1] && volume[0] < volume[2]);

# Calculate Range information

def avgSpread = WildersAverage(spread, volumeEMALength)[0];

rec isWideSpreadBar = (spread > (wideSpreadFactor * avgSpread));

rec isNarrowSpreadBar = (spread < (narrowSpreadFactor * avgSpread));

# Price information

rec isUpBar = close > close[1];

rec isDownBar = close < close[1];

# Check if the close is in the Highs/Lows/Middle of the bar.

# C_RP 20100809

# original code - def x1 = if (close == low) then avgSpread else (spread / (close - low));

def x1 = if (high==low) then 2.0 else if (close == low) then 2.65 else (spread / (close - low));

# C_RP try the line below with various divisors totalSum result in a minimum of 2.3 on a spread of 1 pip instead of using a fixed 2.3 as in the line above

# def x1 = if (high==low) then 2.0 else if (close == low) then (spread / 0.43 ) else (spread / (close - low));

def isUpCloseBar = (x1 < 2);

def isDownCloseBar = (x1 > 2);

def isMidCloseBar = (x1 < 2.2 && x1 > 1.8);

def isVeryHighCloseBar = (x1 < 1.35);

# C_RP 20100809 added isVeryLowCloseBar

def isVeryLowCloseBar = (x1 >= 2.65);


# Trend Definitions


rec fiveDaysSma = compoundValue(5, Average(close, 5)[0], Double.NaN);

def LongTermTrendSlope = LinearRegressionSlope(price = fiveDaysSma, length = longTermLength)[0]; # 40

def MiddleTermTrendSlope = LinearRegressionSlope(price = fiveDaysSma, length = midTermLength)[0]; # 15

def ShortTermTrendSlope = LinearRegressionSlope(price = fiveDaysSma, length = shortTermLength)[0]; # 5


#  VSA Definitions


# upTHRUST - CRITERIA

# utbar

rec isUpThrustBar = isWideSpreadBar && isDownCloseBar &&  ShortTermTrendSlope > 0 && middleTermTrendSlope > 0; #C_RP added positive middleTermTrendSlope requirement to filter out upThrusts in trends that are only short term. Consider adding longTermTrendSlope requirement as well.

# utcond1

def upThrustConditionOne = (isUpThrustBar[1] && isDownBar);

# utcond2

def upThrustConditionTwo = (isUpThrustBar[1] && isDownBar[0] && volume > volume[1]);

# utcond3

def upThrustConditionThree = (isUpThrustBar[0] && volume > 2 * sAvgVolume[0]);

# scond1

rec isConfirmedUpThrustBar = (upThrustConditionOne OR upThrustConditionTwo OR upThrustConditionThree);

# scond

rec isNewConfirmedUpThrustBar = (isConfirmedUpThrustBar[0] && !isConfirmedUpThrustBar[1]);

# Two Period UpThrust Bar

rec isTwoPerUpT = isUpBar[1] && isWideSpreadBar[1] &&  isDownBar[0] && isDownCloseBar[0] && !isUpThrustBar[0] && (absValue(open[1] - close[0]) < (GdojiFactor * spread[1])) ;

# Three Period UpThrust Bar

rec isThreePerUpT = isUpBar[2] && isWideSpreadBar[2] &&  isDownBar[0] && isDownCloseBar[0] && !isUpThrustBar[0] && (absValue(open[2] - close[0]) < (GdojiFactor * spread[2])) ;


# GRAVESTONE DOJI - CRITERIA

#  C_RP 20100816

# rec isGraveDojiBar = (spread > avgSpread) && (open == low) && (close == low); totally strict Gravestone Doji. Revised version below identifies a candle with above average spread, a real body smaller than 20% of the spread, and a lower wick less than 10% of the spread as a Gravestone Doji pictured as a white triangle above the candle.

rec isGraveDojiBar = (spread > avgSpread) && (absValue(open - close) < (GdojiFactor * spread)) &&  ((absValue(close - low) < (WickFactor * spread)) or (absValue(open - low) < (WickFactor * spread))); # less strict Gravestone Doji


# LIKELY REVERSAL - CRITERIA

#  trbar

def reversalLikelyBar = (volume[1] > sAvgVolume[0] && isUpBar[1] && isWideSpreadBar[1] && isDownBar[0] && isDownCloseBar && isWideSpreadBar[0] && LongTermTrendSlope > 0 && high == Highest(high, 10)[0]);


# PSEUSO-upTHRUST - CRITERIA

# hutbar

rec isPseudoUpThrustBar = (isUpBar[1] && (volume[1] > aboveAvgVolfactor * sAvgVolume[0]) && isDownBar[0] && isDownCloseBar && !isWideSpreadBar[0] && !isUpThrustBar[0]);

# hutcond

def pseudoUpThrustConfirmation = (isPseudoUpThrustBar[1] && isDownBar[0] && isDownCloseBar && !isUpThrustBar[0]);


# FAILED-upTHRUST - CRITERIA

# C_RP Failed UpThrustConfirmation or pseudoUpThrustConfirmation occurs when the close of bar following such confirmation is not lower than the close of the confirmation bar

rec isFailedUpThrustConfirmation = (isNewConfirmedUpThrustBar[1] or pseudoUpThrustConfirmation[1]) && close[0] >= close[1];


# WEAKNESS BAR - CRITERIA

# tcbar

def weaknessBar = (isUpBar[1] && high[0] == Highest(high, 5)[0] && isDownBar[0] && (isDownCloseBar OR isMidCloseBar) && volume[0] > sAvgVolume[0] && !isWideSpreadBar[0] && !isPseudoUpThrustBar[0]);


# DOWNTREND STRENGTH (MARKET WEAKNESS) - CRITERIA

# stdn, stdn0, stdn1, stdn2

def strengthInDownTrend =  (volume[0] > volume[1] && isDownBar[1] && isUpBar[0] && (isUpCloseBar OR isMidCloseBar) && ShortTermTrendSlope < 0 && MiddleTermTrendSlope < 0);

def strengthInDownTrend0 = (volume[0] > volume[1] && isDownBar[1] && isUpBar[0] && (isUpCloseBar OR isMidCloseBar) && ShortTermTrendSlope < 0 && MiddleTermTrendSlope < 0 && LongTermTrendSlope < 0);

def strengthInDownTrend1 = (volume[0] > (sAvgVolume[0] * aboveAvgVolfactor) && isDownBar[1] && isUpBar[0] && (isUpCloseBar OR isMidCloseBar) && ShortTermTrendSlope < 0 && MiddleTermTrendSlope < 0 && LongTermTrendSlope < 0);

def strengthInDownTrend2 = (volume[1] < sAvgVolume[0] && isUpBar[0] && isVeryHighCloseBar && volume[0] > sAvgVolume[0] && ShortTermTrendSlope < 0);


# CONFIRMATION DOWNTREND STRENGTH (MARKET WEAKNESS) - CRITERIA

rec bycond1 = (strengthInDownTrend OR strengthInDownTrend1);

# bycond

def isStrengthConfirmationBar = (isUpBar[0] && bycond1[1]);

# bycond2 C_RP UpClose on higher volume with all slopes down adds extra strength

def isStrengthConfirmationBar2 = (isUpBar[0] && isUpCloseBar[0] && volume[0] > volume[1] && longtermtrendslope < 0 && bycond1[1]);


# FAILED DOWNTREND STRENGTH (MARKET WEAKNESS) - CRITERIA

# Failed strength in downtrend signal force a follow-up bar that closes below mid-point of confirmaton bar C_RP

def isFailedStrengthSignal = (isStrengthConfirmationBar[1] or isStrengthConfirmationBar2[1] or strengthinDownTrend2[1])&& close[0] <= (close[1] - (spread[1]/2));


# STOPPING VOLUME AT BOTTOM (LIKELY REVERSAL) - CRITERIA

# stvol

def stopVolBar = low[0] == Lowest(low, 5)[0] && (isUpCloseBar OR isMidCloseBar) && volume[0] > aboveAvgVolfactor * sAvgVolume[0] && LongTermTrendSlope < 0;


# STOPPING VOLUME AT TOP (LIKELY REVERSAL) - CRITERIA

# C_RP stvol at highs - the opposite of stvol

def stopVolBarHighs = high[0] == Highest(high, 5)[0] && (isDownCloseBar OR isMidCloseBar) && volume[0] > aboveAvgVolfactor * sAvgVolume[0] && LongTermTrendSlope > 0;


# NO DEMAND - CRITERIA

# ndbar, nsbar

def noDemandBar = (isUpBar[0] && isNarrowSpreadBar[0] && isTwoDaysLowVol && isDownCloseBar);

# C_RP 20100809


# NO SUPPLY - CRITERIA

# def noSupplyBar = (isDownBar[0] && isNarrowSpreadBar[0] && isTwoDaysLowVol && isDownCloseBar);

def noSupplyBar = (isDownBar[0] && isNarrowSpreadBar[0] && isTwoDaysLowVol && isUpCloseBar);


# TEST FOR SUPPLY - CRITERIA

# lvtbar, lvtbar1, lvtbar2

rec supplyTestBar = (isTwoDaysLowVol && low[0] < low[1] && isUpCloseBar);


# TEST FOR SUPPLY IN AN UPTREND - CRITERIA

def supplyTestInUpTrendBar = (volume[0] < sAvgVolume[0] && Low[0] < Low[1] && isUpCloseBar && LongTermTrendSlope > 0 && MiddleTermTrendSlope > 0 && isWideSpreadBar[0]);


# SUCCESSFUL FIRST TEST FOR SUPPLY - CRITERIA

def successfulSupplyTestBar = (supplyTestBar[1] && isUpBar[0] && isUpCloseBar);


# SUCCESSFUL SECOND TEST FOR SUPPLY - CRITERIA

def successfulSupplyTestBar2 = (successfulsupplyTestBar[1] && isUpBar[0] && x1 <= 2 && volume[0] > volume[1]); # C_RP x1 finds Mid and UpCloseBars


# DISTRIBUTION - CRITERIA

# dbar

def distributionBar = (volume[0] > ultraHighVolfactor * sAvgVolume[0] && isDownCloseBar && isUpBar[0] && ShortTermTrendSlope > 0 && MiddleTermTrendSlope > 0 && !isConfirmedUpThrustBar[0] && !isUpThrustBar[0]);


# EFFORT TO MOVE UP - CRITERIA

# eftup, eftupfl, eftdn

def effortToMoveUpBar = (high[0] > high[1] && low[0] > low[1] && Close[0] > Close[1] && Close[0] >= ((high[0] - low[0]) * highCloseFactor + low[0]) && spread[0] > avgSpread && volume[0] > volume[1]);


# FAILED EFFORT TO MOVE UP - CRITERIA

def failedEffortUpMove = (effortToMoveUpBar[1] && (isUpThrustBar[0] OR upThrustConditionOne OR upThrustConditionTwo OR upThrustConditionThree));


# EFFORT TO DOWN - CRITERIA

def effortToMoveDownBar = ( ((high[0] < high[1]) OR (isWideSpreadBar && volume[0] > 1.5 * sAvgVolume[0]))  && low[0] < low[1] && close[0] < close[1] && Close[0] <= ((high[0] - low[0]) * lowCloseFactor + low[0]) && spread[0] > avgSpread && volume[0] > volume[1]);

#C_RP old code - def effortToMoveDownBar = (high[0] < high[1] && low[0] < low[1] && close[0] < close[1] && Close[0] <= ((high[0] - low[0]) * lowCloseFactor + low[0]) && spread[0] > avgSpread && volume[0] > volume[1]);


#  PLOT DEFINITIONS


def uSMA = Average(volume[-displace], length);

def dSMA = Average(-volume[-displace], length);

def ZeroLine = 0;

def Condition1 = shortTermTrendSlope > 0 and MiddleTermTrendSlope > 0 and longtermtrendslope > 0;

def Condition2 = shortTermTrendSlope > 0 and MiddleTermTrendSlope > 0 and longtermtrendslope < 0;

def Condition3 = shortTermTrendSlope > 0 and MiddleTermTrendSlope < 0 and longtermtrendslope < 0;

def Condition4 = shortTermTrendSlope < 0 and MiddleTermTrendSlope < 0 and longtermtrendslope < 0;

def Condition5 = shortTermTrendSlope < 0 and MiddleTermTrendSlope > 0 and longtermtrendslope > 0;

def Condition6 = shortTermTrendSlope < 0 and MiddleTermTrendSlope < 0 and longtermtrendslope > 0;


# Candle definitions

def SafeReversal = double.nan;

# plot null = double.nan;


# SELECTED REVERSAL CONDITIONS


# LIKELY REVERSAL AT THE TOP #1

# (Top - Red DownArrow)

def ConditionDown1 = if isNewConfirmedUpThrustBar && (upThrustConditionTwo or upThrustConditionThree) then (high + 4 * tickSize()) else Double.NAN;


# (Top - Red Triangle)

def ConditionDown2 = if isNewConfirmedUpThrustBar && upThrustConditionOne then (high + 2 * tickSize()) else Double.NAN;


# (Middle - Magenta Circle)

def ConditionDown3 = if effortToMoveDownBar && !(shortTermTrendSlope < 0 && MiddleTermTrendSlope < 0 && longTermTrendSlope < 0) then (median) else

Double.NAN;

# AddChartBubble(ConditionDown2, Volume, "Reversal Alert", Color.Red, Yes);


# LIKELY REVERSAL AT THE TOP #2

# (Top - Red Circle)

def ConditionDown4 = if reversalLikelyBar then (high + 6 * tickSize()) else Double.NAN;


# (Top - Yellow circle)

def ConditionDown5 = if stopVolBarHighs then (high + 7 * tickSize()) else Double.NAN;

#++++++++++++++++++++++++++++++++++++++++++++++++++++++++++++++++++++++

#++++++++++++++++++++++++++++++++++++++++++++++++++++++++++++++++++++++

#++++++++++++++++++++++++++++++++++++++++++++++++++++++++++++++++++++++

# LIKELY REVERSAL AT THE BOTTOM #1

# (Bottom - Green Arrow Up) #1

def ConditionUp1 = if isStrengthConfirmationBar then (low - 4 * tickSize()) else Double.NAN;


# (Bottom - Green Arrow Up) #2

def ConditionUp2 = if isStrengthConfirmationBar2 then (low - 7 * tickSize()) else Double.NAN;


# (Middle - Green Circle)

def ConditionUp3 = if effortToMoveUpBar then (median) else Double.NAN;

# LIKELY REVERSAL AT THE BOTTOM #2

# (Bottom - Green Circle)

def ConditionUp4 = if stopVolBar then (low - 2 * tickSize()) else Double.NAN;


# (Bottom - Green Triangle)

def ConditionUp5 = if strengthInDownTrend2 then (low - 3 * tickSize()) else Double.NAN;

# Arrows below based on the following
#AddChartBubble(ConditionUp4 && ConditionUp5, Volume, concat("Buy @ $", Close), Color.Green, Yes);
#AddChartBubble(ConditionUp1 && ConditionUp2 && ConditionUp3, Volume, concat("Buy @ $", Close), Color.Green, Yes);
#AddChartBubble(ConditionDown1 && ConditionDown4 && ConditionDown5, Volume, concat("Sell @ $", Close), Color.Red, Yes);
#AddChartBubble(ConditionDown1 && ConditionDown2 && ConditionDown3,  Volume, concat("Sell @ $", Close), Color.Red, Yes);

# buy and sell signals

def Buy45 = ConditionUp4 && ConditionUp5;
plot bullish45 = Buy45;
bullish45.SetPaintingStrategy(PaintingStrategy.BOOLEAN_ARROW_UP);
bullish45.SetDefaultColor(Color.CYAN);
bullish45.SetLineWeight(3);

def Buy123 = ConditionUp1 && ConditionUp2 && ConditionUp3;
plot bullish123 = Buy123;
bullish123.SetPaintingStrategy(PaintingStrategy.BOOLEAN_ARROW_UP);
bullish123.SetDefaultColor(Color.CYAN);
bullish123.SetLineWeight(3);

def Bearish145i = ConditionDown1 && ConditionDown4 && ConditionDown5;
plot bearish145 = Bearish145i;
bearish145.SetPaintingStrategy(PaintingStrategy.BOOLEAN_ARROW_DOWN);
bearish145.SetDefaultColor(Color.CYAN);
bearish145.SetLineWeight(3);

def Bearish123i = ConditionDown1 && ConditionDown2 && ConditionDown3;
plot bearish123 = Bearish123i;
bearish123.SetPaintingStrategy(PaintingStrategy.BOOLEAN_ARROW_DOWN);
bearish123.SetDefaultColor(Color.CYAN);
bearish123.SetLineWeight(3);

# Alerts
Alert(ConditionUp4 && ConditionUp5, concat("Buy @ $", Close), Alert.BAR, Sound.Bell);
Alert(ConditionUp1 && ConditionUp2 && ConditionUp3, concat("Buy @ $", Close), Alert.BAR, Sound.Bell);
Alert(ConditionDown1 && ConditionDown4 && ConditionDown5, concat("Sell @ $", Close), Alert.BAR, Sound.Chimes);
Alert(ConditionDown1 && ConditionDown2 && ConditionDown3, concat("Sell @ $", Close), Alert.BAR, Sound.Chimes);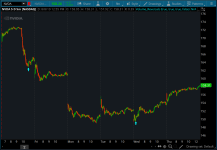

")