Volume Profile Indicator & POCs For ThinkOrSwim

gilda

New member
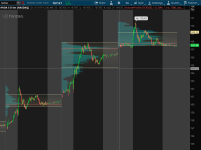
This is the one I'm using.

Code:
# Profile TPO & Volume
input profileType = {default Time, Volume};
input pricePerRowHeightMode = {default Ticksize, Automatic, Custom};
input customRowHeight = 1.0;
input timePerProfile = {default Day, Week, Month, Year, Hour, Chart, "Opt Exp"};
input multiplier = 1;
input OnExpansionProfile = No;
input OnExpansionValueArea = No;
input profiles = 2;
input showPointOfControl = Yes;
input showValueArea = Yes;
input showValueAreaCloud = Yes;
input ValueAreaPercent = 70;
input ShowHighLow = Yes;
input opacity = 5;
input PaintBars = No;
input ShowExtensions = No;
input DynamicHideExtensions = Yes;
input ShowLabel = No;
def FibExt1 = 1.618;
def FibExt2 = 2.618;
def FibExt3 = 4.236;
def SE = ShowExtensions;
def ShowProfileValueAreaCloud = no;

def period;
def yyyymmdd = GetYYYYMMDD();
def seconds = SecondsFromTime(0);
def month = GetYear() * 12 + GetMonth();
def year = GetYear();
def day_number = DaysFromDate(First(yyyymmdd)) + GetDayOfWeek(First(yyyymmdd));
def dom = GetDayOfMonth(yyyymmdd);
def dow = GetDayOfWeek(yyyymmdd - dom + 1);
def expthismonth = (if dow > 5 then 27 else 20) - dow;
def exp_opt = month + (dom > expthismonth);
switch (timePerProfile) {
case Chart:
    period = 0;
case Hour:
    period = Floor(seconds / 3600 + day_number * 24);
case Day:
    period = CountTradingDays(Min(First(yyyymmdd), yyyymmdd), yyyymmdd) - 1;
case Week:
    period = Floor(day_number / 7);
case Month:
    period = Floor(month - First(month));
case Year:
    period = Floor(year - First(year));
case "Opt Exp":
    period = exp_opt - First(exp_opt);
}

def CloseByPeriod = close(Period = timePerProfile)[-1];
def Openbyperiod  = open(Period = timePerProfile)[-1];
def NewDay = if !IsNaN(CloseByPeriod) then 0 else 1;

rec Count = if period != period[1] then (Count[1] + period - period[1]) % 1 else Count[1];
def Cond = Count < Count[1] + period - period[1];
def height;
switch (pricePerRowHeightMode) {
case Automatic:
    height = PricePerRow.AUTOMATIC;
case Ticksize:
    height = PricePerRow.TICKSIZE;
case Custom:
    height = customRowHeight;
}

profile VOL = if profileType == profileType.Volume then VolumeProfile("startNewProfile" = Cond, "onExpansion" = onExpansionProfile, "NumberOfProfiles" = profiles, "PricePerRow" = height, "Value Area Percent" = ValueAreaPercent) else TimeProfile("startNewProfile" = Cond, "OnExpansion" = onExpansionProfile, "NumberOfProfiles" = profiles, "PricePerRow" = height, "Value Area Percent" = ValueAreaPercent);

def con = CompoundValue(1, onExpansionProfile, no);
rec pc = if IsNaN(VOL.GetPointOfControl()) and con then pc[1] else VOL.GetPointOfControl();
rec hVA = if IsNaN(VOL.GetHighestValueArea()) and con then hVA[1] else VOL.GetHighestValueArea();
rec lVA = if IsNaN(VOL.GetLowestValueArea()) and con then lVA[1] else VOL.GetLowestValueArea();
rec HVA_Last = if period == period[1] then HVA_Last[1] else hVA[1];
rec PC_Last  = if period == period[1] then PC_Last[1]  else pc[1];
rec LVA_Last = if period == period[1] then LVA_Last[1] else lVA[1];
rec hProfile = if IsNaN(VOL.GetHighest()) and con then hProfile[1] else VOL.GetHighest();
rec lProfile = if IsNaN(VOL.GetLowest()) and con then lProfile[1] else VOL.GetLowest();
def plotsDomain = IsNaN(close) == onExpansionProfile;

rec hP_Last = if period == period[1] then hP_Last[1] else hProfile[1];
rec lP_Last = if period == period[1] then lP_Last[1] else lProfile[1];

plot VAH  = if !showValueArea then Double.NaN else if IsNaN(close[0]) then HVA_Last[0] else if !OnExpansionValueArea then HVA_Last[0] else Double.NaN;
plot POC  = if IsNaN(close[0]) then PC_Last[0] else if !OnExpansionValueArea then PC_Last[0] else Double.NaN;
plot VAL  = if !showValueArea then Double.NaN else if IsNaN(close[0]) then LVA_Last[0] else if !OnExpansionValueArea then LVA_Last[0] else Double.NaN;
plot High = if !ShowHighLow then Double.NaN else if IsNaN(close[0]) then hP_Last[0] else if !OnExpansionValueArea then hP_Last[0] else Double.NaN;
plot Low = if !ShowHighLow then Double.NaN else if IsNaN(close[0]) then lP_Last[0] else if !OnExpansionValueArea then lP_Last[0] else Double.NaN;

DefineGlobalColor("Profile", GetColor(7));
DefineGlobalColor("Point Of Control", GetColor(5));
DefineGlobalColor("Value Area", GetColor(8));

VOL.Show(GlobalColor("Profile"), if showPointOfControl then GlobalColor("Point Of Control") else Color.CURRENT, if ShowProfileValueAreaCloud then GlobalColor("Value Area") else Color.CURRENT, opacity);

POC.SetPaintingStrategy(PaintingStrategy.HORIZONTAL);
POC.SetDefaultColor(Color.DARK_GRAY);
#POC.SetDefaultColor(CreateColor(32,49,57));
POC.SetLineWeight(1);
POC.HideTitle();

VAH.SetPaintingStrategy(PaintingStrategy.HORIZONTAL);
VAH.SetDefaultColor(Color.DARK_GREEN);
VAH.SetLineWeight(1);
VAH.HideBubble();
VAH.HideTitle();

VAL.SetPaintingStrategy(PaintingStrategy.HORIZONTAL);
VAL.SetDefaultColor(Color.DARK_RED);
VAL.SetLineWeight(1);
VAL.HideBubble();
VAL.HideTitle();

High.SetPaintingStrategy(PaintingStrategy.DASHES);
High.SetDefaultColor(CreateColor(38, 38, 8));
High.SetLineWeight(1);
High.HideBubble();
High.HideTitle();

Low.SetPaintingStrategy(PaintingStrategy.DASHES);
Low.SetDefaultColor(CreateColor(38, 38, 8));
Low.SetLineWeight(1);
Low.HideBubble();
Low.HideTitle();
#Paint Bars

#AssignPriceColor(if !PaintBars then Color.CURRENT else if open >= VAH and close >= VAH then CreateColor(0, 204, 0) else if open <= VAL and close <= VAL then CreateColor(204, 0, 0) else Color.Light_GRAY);
AssignPriceColor(if !PaintBars then Color.CURRENT else if open >= VAH and close >= VAH then Color.Green else if open <= VAL and close <= VAL then Color.Red else Color.Light_GRAY);
#Value Area Cloud

#DefineGlobalColor("Value Area Cloud", (CreateColor(20, 20, 20)));
DefineGlobalColor("Value Area Cloud", Color.DARK_GRAY);
def cloudhigh = if showValueAreaCloud and IsNaN(close[0]) then HVA_Last else if !OnExpansionValueArea then HVA_Last else Double.NaN;
def cloudlow  = if showValueAreaCloud and IsNaN(close[0]) then LVA_Last else if !OnExpansionValueArea then LVA_Last else Double.NaN;
AddCloud (cloudhigh, cloudlow, GlobalColor("Value Area Cloud"));
#Chart Label

def InsideValueArea = close < HVA_Last and close > LVA_Last;
def BelowValue = close < LVA_Last;

AddLabel(ShowLabel, close, if InsideValueArea then Color.GRAY else if BelowValue then Color.RED else Color.GREEN);
#Fibonacci Extensions

def VAWidth = VAH - VAL;

plot E1H = if SE < 1 then Double.NaN else VAH + VAWidth * (FibExt1 - 1);
E1H.SetHiding(DynamicHideExtensions and close < VAH);
E1H.SetDefaultColor(CreateColor(0, 51, 0));
E1H.SetPaintingStrategy(PaintingStrategy.DASHES);
E1H.SetLineWeight(1);
E1H.HideBubble();
E1H.HideTitle();
plot E1L = if SE < 1 then Double.NaN else VAL - VAWidth * (FibExt1 - 1);
E1L.SetHiding(DynamicHideExtensions and close > VAL);
E1L.SetDefaultColor(CreateColor(51, 0, 0));
E1L.SetPaintingStrategy(PaintingStrategy.DASHES);
E1L.SetLineWeight(1);
E1L.HideBubble();
E1L.HideTitle();

plot E2H = if SE < 1 then Double.NaN else VAH + VAWidth * (FibExt2 - 1);
E2H.SetHiding(DynamicHideExtensions and close < E1H);
E2H.SetDefaultColor(CreateColor(0, 51, 0));
E2H.SetPaintingStrategy(PaintingStrategy.DASHES);
E2H.SetLineWeight(1);
E2H.HideBubble();
E2H.HideTitle();
plot E2L = if SE < 1 then Double.NaN else VAL - VAWidth * (FibExt2 - 1);
E2L.SetHiding(DynamicHideExtensions and close > E1L);
E2L.SetDefaultColor(CreateColor(51, 0, 0));
E2L.SetPaintingStrategy(PaintingStrategy.DASHES);
E2L.SetLineWeight(1);
E2L.HideBubble();
E2L.HideTitle();

plot E3H = if SE < 1 then Double.NaN else VAH + VAWidth * (FibExt3 - 1);
E3H.SetHiding(DynamicHideExtensions and close < E2H);
E3H.SetDefaultColor(CreateColor(0, 51, 0));
E3H.SetPaintingStrategy(PaintingStrategy.DASHES);
E3H.SetLineWeight(1);
E3H.HideBubble();
E3H.HideTitle();
plot E3L = if SE < 1 then Double.NaN else VAL - VAWidth * (FibExt3 - 1);
E3L.SetHiding(DynamicHideExtensions and close > E2L);
E3L.SetDefaultColor(CreateColor(51, 0, 0));
E3L.SetPaintingStrategy(PaintingStrategy.DASHES);
E3L.SetLineWeight(1);
E3L.HideBubble();
E3L.HideTitle();
Screenshot (85).png
 
Last edited by a moderator:
This one has everything you asked for and more.

I have never used it with equities, only with futures. Be careful with the volume or TPO profile in TOS, it uses aggregated values, not a true tick, so it might lag the real profile, especially intraday. In addition, the values for different time frames often do not match.

Code:
#v1.1 - 5/10/18
#- Able to get Implied Volatity at any specified time. Default set to 9PM est  
#- Modified Settlement to take closing price of the last bar of the day. Previous version used "Closing Price" at 16:15 which was usually nowhere near ending settlement
#- Added option to substitute symbol used in IV/Deviation calculation for instruments with #no option chains such as /NKD  
#- Added customizable deviation line (hidden as default)

#===========================
#Steps if you want your VA to match u/uberbotman's:
#1) Set your chart to 30M, and show extended hours
#2) Go to options, make sure ShowLabels is set to "Yes" (hit apply if needed)
#3) Copy VAH, POC and VAL from the labels in the top left corner of your chart into Manual input locations
#4) Set Value Area Area Mode to Manual

declare upper;
declare once_per_bar;
#============================
#Inputs
#============================

input SetMode = {default Auto, Manual};#Hint SetMode: Select Auto to update Settlement automatically in input manually. \n\n NOTE: ToS doesn't support Settlement so LAST closing price is used. This is usually pretty close to within a single tick, but Manually entering Settlement from CME website or UBM's nightly post is more accurate
input Settlement = 2444.50;#Hint Settlement: Enter Settlement value when SetMode is set to Manual
input IVMode = {default Auto, Manual};#Hint IVMode: Select Auto to update Implied Volatility at time chosen on IVSettleTime
input IVSettleTime = 2100;#Hint IVSettleTime: Enter time_value of desired Implied Volatility "settlement" \n\n NOTE: If time selected is not visible on chart (i.e. 2100 on a chart not showing extended trading hours), IV will not calculate
input Volatility = 11.2;#Hint Volatility: Enter Implied Volatility value when IVMode is set to Manual
input IVSymbolMode = {default Auto, Manual};#Hint IVSymbolMode: Select Manual if you wish to use a different instrument's IV instead of what is on the chart
input Symbol = "EWJ";#Hint Symbol: Enter symbol of Implied Volatility you wish to substitute with. For use with products with no option chains (i.e. /NKD)
input ValueAreaMode = {default Auto, Manual};#Hint ValueAreaMode: Select Auto to update Value Areas automatically and is rounded to the nearest tick. Manual selection changes Value Area for today only \n\n NOTE: Value Area is typically calculated on a 30min chart, if the timeframe changes, then calculated value area may also change. To lock in the values from the 30min chart follow these steps: \n#1) Set your chart to 30M, and show extended hours \n#2) Go to options, make sure ShowLabels is set to "Yes" (hit apply if needed) \n#3) Copy VAH, POC and VAL from the labels showing in the top left corner of the chart into the Manual input locations \n#4) Set Value Area Area Mode to Manual and hit Apply
input ValueAreaHigh = 2445.00;#Hint ValueAreaHigh: Enter Value Area High when ValueAreaMode is set to Manual
input PointOfControl = 2442.00;#Hint PointOfControl: Enter Point of Control when ValueAreaMode is set to Manual
input ValueAreaLow = 2440.00;#Hint ValueAreaLow: Enter Value Area Low when ValueAreaMode is set to Manual
input ShowTodayOnly = {default "No", "Yes"};#Hint ShowTodayOnly: Show/Hide chart plots for previous days
input ShowBubbles = {"No", default "Yes"};#Hint ShowBubbles: Show/Hide chart bubbles
input ShowCloud = {"No", default "Yes"};#Hint ShowCloud: Show/Hide Value Area cloud
input ShowLabels = {"No", default "Yes"};#Hint ShowLabels: Show/Hide Labels with Value Area data and IV used for Std Deviation calculations in Auto setting
input ProfileType = {default Volume, Time};#Hint ProfileType: Switch between Volume Profile and Time Profile
input valueAreaPercent = 70;#Hint valueAreaPercent: Set the size of the Value Area
input ShowVWAP = {"No", default "Yes"};#Hint ShowVWAP: Show daily VWAP
input CustomDev = 3.5;#Hint CustomDev: Enter custom deviation line

#============================
#Std Dev Calc / Plot
#============================

def CloseTime2 = SecondsTillTime(0000) >= 0;
def OpenTime2 = SecondsFromTime(1700) >= 0;
def MarketOpen = OpenTime2 and CloseTime2;
def NewDay = IsNaN(close(period = “Day”)[-1]);
def Chart  = MarketOpen and NewDay;
def bar = BarNumber();

def SettleTime = 1800;
rec SetTimeValue = if(secondstilltime(SettleTime)== 0,close()[1],SetTimeValue[1]);
def SetAtTime = if(SetTimeValue == 0, double.nan,SetTimeValue);

def Set = if SetMode == SetMode."Manual" and NewDay then Settlement else SetAtTime;

rec IVTimeValue = if(secondstilltime(IVSettleTime)== 0,imp_volatility(symbol = if IVSymbolMode == IVSymbolMode."Auto" then GetSymbol() else Symbol)[1],IVTimeValue[1]);
def IVSet = if(IVTimeValue==0, double.nan,IVTimeValue);
def Vol = if IVMode == IVMode."Manual" and NewDay then Volatility else IVSet;


def a = Vol;
def b = a / Sqrt(252);
def SD = b * Set;


plot Settle = Round(If (MarketOpen, Set, If (ShowTodayOnly, Double.NaN, Set)) / TickSize(), 0) * TickSize();
Settle.SetDefaultColor(Color.DARK_GREEN);
Settle.SetStyle(Curve.FIRM);
Settle.SetLineWeight(2);
AddChartBubble(bar == HighestAll(bar) and ShowBubbles, Settle, "Set", Color.DARK_GREEN, no);

plot StdDev025H = Round(If (Chart, Set + (SD * 0.25), If (ShowTodayOnly, Double.NaN, Set + (SD * 0.25))) / TickSize(), 0) * TickSize();
StdDev025H.SetDefaultColor(Color.GRAY);
StdDev025H.SetStyle(Curve.SHORT_DASH);
AddChartBubble(bar == HighestAll(bar) and ShowBubbles, StdDev025H, "0.25 Std Dev ", Color.GRAY, no);

plot StdDev05H = Round(If (Chart, Set + (SD * 0.5), If (ShowTodayOnly, Double.NaN, Set + (SD * 0.5))) / TickSize(), 0) * TickSize();
StdDev05H.SetDefaultColor(Color.CYAN);
StdDev05H.SetStyle(Curve.SHORT_DASH);
AddChartBubble(bar == HighestAll(bar) and ShowBubbles, StdDev05H, "0.5 Std Dev ", Color.CYAN, no);

plot StdDev1H = Round(If (Chart, Set + (SD * 1), If (ShowTodayOnly, Double.NaN, Set + (SD * 1))) / TickSize(), 0) * TickSize();
StdDev1H.SetDefaultColor(Color.VIOLET);
StdDev1H.SetStyle(Curve.LONG_DASH);
AddChartBubble(bar == HighestAll(bar) and ShowBubbles, StdDev1H, "1 Std Dev", Color.VIOLET, no);

plot StdDev1_5H = Round(If (Chart, Set + (SD * 1.5), If (ShowTodayOnly, Double.NaN, Set + (SD * 1.5))) / TickSize(), 0) * TickSize();
StdDev1_5H.SetDefaultColor(Color.PLUM);
StdDev1_5H.SetStyle(Curve.LONG_DASH);
#AddChartBubble(bar == HighestAll(bar) and ShowBubbles, StdDev1_5H, "1.5 Std Dev", Color.PLUM, no);

plot StdDev2H = Round(If (Chart, Set + (SD * 2), If (ShowTodayOnly, Double.NaN, Set + (SD * 2))) / TickSize(), 0) * TickSize();
StdDev2H.SetDefaultColor(Color.PLUM);
StdDev2H.SetStyle(Curve.FIRM);
StdDev2H.SetLineWeight(3);
AddChartBubble(bar == HighestAll(bar) and ShowBubbles, StdDev2H, "2 Std Dev", Color.PLUM, no);

plot StdDev3H = Round(If (Chart, Set + (SD * 3), If (ShowTodayOnly, Double.NaN, Set + (SD * 3))) / TickSize(), 0) * TickSize();
StdDev3H.SetDefaultColor(Color.DARK_RED);
StdDev3H.SetStyle(Curve.FIRM);
StdDev3H.SetLineWeight(3);
AddChartBubble(bar == HighestAll(bar) and ShowBubbles, StdDev3H, "3 Std Dev", Color.DARK_RED, no);

plot StdDev025L = Round(If (Chart, Set + (SD * -0.25), If (ShowTodayOnly, Double.NaN, Set + (SD * -0.25))) / TickSize(), 0) * TickSize();
StdDev025L.SetDefaultColor(Color.GRAY);
StdDev025L.SetStyle(Curve.SHORT_DASH);
AddChartBubble(bar == HighestAll(bar) and ShowBubbles, StdDev025L, "-0.25 Std Dev", Color.GRAY, no);

plot StdDev05L = Round(If (Chart, Set + (SD * -0.5), If (ShowTodayOnly, Double.NaN, Set + (SD * -0.5))) / TickSize(), 0) * TickSize();
StdDev05L.SetDefaultColor(Color.CYAN);
StdDev05L.SetStyle(Curve.SHORT_DASH);
AddChartBubble(bar == HighestAll(bar) and ShowBubbles, StdDev05L, "-0.5 Std Dev", Color.CYAN, no);

plot StdDev1L = Round(If (Chart, Set + (SD * -1), If (ShowTodayOnly, Double.NaN, Set + (SD * -1))) / TickSize(), 0) * TickSize();
StdDev1L.SetDefaultColor(Color.VIOLET);
StdDev1L.SetStyle(Curve.LONG_DASH);
AddChartBubble(bar == HighestAll(bar) and ShowBubbles, StdDev1L, "1 Std Dev", Color.VIOLET, no);

plot StdDev1_5L = Round(If (Chart, Set + (SD * -1.5), If (ShowTodayOnly, Double.NaN, Set + (SD * -1.5))) / TickSize(), 0) * TickSize();
StdDev1_5L.SetDefaultColor(Color.PLUM);
StdDev1_5L.SetStyle(Curve.LONG_DASH);
#AddChartBubble(bar == HighestAll(bar) and ShowBubbles, StdDev1_5L, "-1.5 Std Dev", Color.PLUM, no);

plot StdDev2L = Round(If (Chart, Set + (SD * -2), If (ShowTodayOnly, Double.NaN, Set + (SD * -2))) / TickSize(), 0) * TickSize();
StdDev2L.SetDefaultColor(Color.PLUM);
StdDev2L.SetStyle(Curve.FIRM);
StdDev2L.SetLineWeight(3);
AddChartBubble(bar == HighestAll(bar) and ShowBubbles, StdDev2L, "-2 Std Dev", Color.PLUM, no);

plot StdDev3L = Round(If (Chart, Set + (SD * -3), If (ShowTodayOnly, Double.NaN, Set + (SD * -3))) / TickSize(), 0) * TickSize();
StdDev3L.SetDefaultColor(Color.DARK_RED);
StdDev3L.SetStyle(Curve.FIRM);
StdDev3L.SetLineWeight(3);
AddChartBubble(bar == HighestAll(bar) and ShowBubbles, StdDev3L, "-3 Std Dev", Color.DARK_RED, no);

plot CustDev = Round(If (Chart, Set + (SD * CustomDev), If (ShowTodayOnly, Double.NaN, Set + (SD * CustomDev))) / TickSize(), 0) * TickSize();
CustDev.Hide();
CustDev.SetDefaultColor(Color.YELLOW);
CustDev.SetStyle(Curve.FIRM);
CustDev.SetLineWeight(2);


# =================================
# Volume Profile Definition Section
# =================================

def profiles = 50;
def customRowHeight = 1.0;
def multiplier = 1;
def onExpansion = ShowTodayOnly;
def yyyymmdd = GetYYYYMMDD();
def seconds = SecondsFromTime(0);
def period = CountTradingDays(Min(First(yyyymmdd), yyyymmdd), yyyymmdd) - 1;
def month = GetYear() * 12 + GetMonth();
def day_number = DaysFromDate(First(yyyymmdd)) + GetDayOfWeek(First(yyyymmdd));
def dom = GetDayOfMonth(yyyymmdd);
def dow = GetDayOfWeek(yyyymmdd - dom + 1);
def expthismonth = (if dow > 5 then 27 else 20) - dow;
def exp_opt = month + (dom > expthismonth);
def height = PricePerRow.TICKSIZE;

rec count = CompoundValue(1, if period != period[1] then (count[1] + period - period[1]) % multiplier else count[1], 0);
def cond = count < count[1] + period - period[1];


#============================
# Plot POC VAH VAL Section
#============================

profile tpo = if ProfileType == ProfileType.Volume then VolumeProfile("startNewProfile" = cond, "onExpansion" = onExpansion, "numberOfProfiles" = profiles, "pricePerRow" = height, "value area percent" = valueAreaPercent)
    else TimeProfile("startNewProfile" = cond, "onExpansion" = onExpansion, "numberOfProfiles" = profiles, "pricePerRow" = height, "value area percent" = valueAreaPercent);


rec PC = if cond == 1 then tpo.GetPointOfControl()[1] else PC[1];
plot POC = Round(If(ValueAreaMode == ValueAreaMode."Auto", PC, if NewDay then PointOfControl else PC) / TickSize(), 0) * TickSize();
POC.SetDefaultColor(Color.DARK_RED);
POC.SetStyle(Curve.FIRM);
POC.SetLineWeight(2);

rec hVA = if cond == 1 then tpo.GetHighestValueArea()[1] else hVA[1];
plot VAH = Round(If(ValueAreaMode == ValueAreaMode."Auto", hVA, if NewDay then ValueAreaHigh else hVA) / TickSize(), 0) * TickSize();
VAH.SetDefaultColor(Color.RED);
VAH.SetStyle(Curve.FIRM);

rec lVA = if cond == 1 then tpo.GetLowestValueArea()[1] else lVA[1];
plot VAL =  Round(If(ValueAreaMode == ValueAreaMode."Auto", lVA, if NewDay then ValueAreaLow else lVA) / TickSize(), 0) * TickSize();
;
VAL.SetDefaultColor(Color.GREEN);
VAL.SetStyle(Curve.FIRM);


#============================
# VWAP Plot
#============================
def VWAP1 = Round(vwap(period = AggregationPeriod.DAY) / TickSize(), 0) * TickSize();
plot VWAP = if ShowVWAP > 0 then VWAP1 else Double.NaN;
VWAP.SetPaintingStrategy(PaintingStrategy.DASHES);
VWAP.SetDefaultColor(Color.DARK_GRAY);


#============================
#Value Area Cloud & Labels
#============================

def VArea  = Between(close, VAL, VAH);
def VAreaAbove  = close > VAH;
def VAreaBelow  = close < VAL;

def Cloudhigh = if ShowCloud then VAH else Double.NaN;
def Cloudlow  = if ShowCloud then VAL else Double.NaN;
AddCloud(CloudHigh, CloudLow, GlobalColor("cloud"), GlobalColor("cloud"));
DefineGlobalColor("cloud", Color.DARK_GRAY);

AddLabel(ShowLabels, Concat("VAH:", Round(VAH)), if close > VAH then Color.GREEN else Color.RED)  ;
AddLabel(ShowLabels, Concat("POC:", Round(POC)), if close > POC then Color.GREEN else Color.RED);
AddLabel(ShowLabels, Concat("VAL:", Round(VAL)), if close > VAL then Color.GREEN else Color.RED);
AddLabel(ShowLabels, Concat("VWAP: ", Round(VWAP1)), Color.LIGHT_ORANGE);
AddLabel(ShowLabels, "IV: " + AsPercent(IVSet), if IsAscending(imp_volatility(period = AggregationPeriod.DAY, priceType = PriceType.LAST)[1]) then Color.RED else if IsDescending(imp_volatility(period = AggregationPeriod.DAY, priceType = PriceType.LAST)[1]) then Color.GREEN else Color.WHITE);
AddLabel(ShowLabels, if VArea then "Inside Value Area" else if VAreaAbove then  "Above Value Area" else "Below Value Area", if VArea then Color.ORANGE else if VAreaAbove then Color.GREEN else Color.RED);


#============================
# Alerts:
#============================
input alerttext = "Entry/Exit Point";
# BLOCK CODE BELOW
input UseAlerts = {false, default true};
input AlertType = {default "BAR", "ONCE", "TICK"};
def at = AlertType;
input AlertSound = {default "Bell", "Chimes", "Ding", "NoSound", "Ring"};
def Signal = (close crosses POC) or (close crosses VAH) or (close crosses VAL) or (close crosses StdDev05H) or (close crosses StdDev1H) or (close crosses StdDev2H) or (close crosses StdDev05L) or (close crosses StdDev1L) or (close crosses StdDev2L);
Alert(UseAlerts and Signal, alerttext, if at == 1 then Alert.ONCE else if at == 2 then Alert.TICK else Alert.BAR, AlertSound);
 
Last edited:
Yeah I am aware. I never use current day profile anyways, hence why I asked for an indicator that plots prev. day onto current day. TOS is not great for VPRO/TPO with the aggregate tick, but I have noticed with equities its close enough to get the job done. All I look for is price to break, and build above or below VAH/VAL and use previous VPOC as targets. There's no way I'd use it for futures trading.
 
Last edited:
This is working well for me however I am finding that i cannot change the # of Bars, Hours etc. length. Basically, it's stuck on 1 bar, 1Hour, 1 Day etc. and I'd like to have this as a variable length (the way it works on the standard version of VP). Thanks!

 
Last edited:
Hey all. Someone mentioned that ThinkorSwim's volume profile study was basically Center of Gravity (COG). I forget who and where this was said - can someone please confirm or refute?

Also, I noticed the way Volume Profile is calculated on TOS is different than how it's calculated on Tradingview but I don't use Tradingview because I would rather not pay for indicators.... I also took a liking to Tradingview's version and find it more accurate and easier to interpret. Does anybody know the calculation are different and whether or not we can convert that from pinescript to TOS?

This Volume Profile script is for 24 hours BEGINNING with the RTH OPEN.

Code:
# Volume Profile for RTH and GlobeX
# Mobius
# Chat Room Discussion 03.26.2018

input pricePerRowHeightMode = {AUTOMATIC, TICKSIZE, default CUSTOM};
input customRowHeight = 1.0;
input onExpansion = no;
input profiles = 5; #Hint profiles: for just RTH 1 for GlobeX and RTH 2
input showPointOfControl = yes;
input showValueArea = yes;
input valueAreaPercent = 68;
input opacity = 5;
input RthBegin = 0930;
input RthEnd = 1600;

def TS = TickSize();
def Active = getTime() >= RegularTradingStart(getYYYYMMDD());
def cond = getTime() crosses above RegularTradingStart(getYYYYMMDD());
def height;
switch (pricePerRowHeightMode) {
case AUTOMATIC:
height = PricePerRow.AUTOMATIC;
case TICKSIZE:
height = PricePerRow.TICKSIZE;
case CUSTOM:
height = customRowHeight;
}
profile vol = VolumeProfile("startNewProfile" = cond, "onExpansion" = onExpansion, "numberOfProfiles" = profiles, "pricePerRow" = height, "value area percent" = valueAreaPercent);
def con = CompoundValue(1, onExpansion, no);
def pc = if IsNaN(vol.GetPointOfControl()) and con
then pc[1]
else vol.GetPointOfControl();
def hVA = if IsNaN(vol.GetHighestValueArea()) and con
then hVA[1]
else Round(vol.GetHighestValueArea(), 0);
def lVA = if IsNaN(vol.GetLowestValueArea()) and con
then lVA[1]
else vol.GetLowestValueArea();
def hProfile = if IsNaN(vol.GetHighest()) and con
then hProfile[1]
else vol.GetHighest();
def lProfile = if IsNaN(vol.GetLowest()) and con
then lProfile[1]
else vol.GetLowest();
def plotsDomain = IsNaN(close) == onExpansion;

plot POC = if plotsDomain
then Round(pc / TS, 0) * TS
else Double.NaN;
plot ProfileHigh = if plotsDomain
then Round(hProfile / TS, 0) * TS
else Double.NaN;
plot ProfileLow = if plotsDomain
then Round(lProfile / TS, 0) * TS
else Double.NaN;
plot VAHigh = if plotsDomain
then Round(hVA / TS, 0) * TS
else Double.NaN;
plot VALow = if plotsDomain
then Round(lVA / TS, 0) * TS
else Double.NaN;

DefineGlobalColor("Profile", GetColor(1));
DefineGlobalColor("Point Of Control", GetColor(5));
DefineGlobalColor("Value Area", GetColor(8));

vol.Show(GlobalColor("Profile"), if showPointOfControl then GlobalColor("Point Of Control") else Color.CURRENT, if showValueArea then GlobalColor("Value Area") else Color.CURRENT, opacity);

POC.SetDefaultColor(GlobalColor("Point Of Control"));
POC.SetPaintingStrategy(PaintingStrategy.HORIZONTAL);
VAHigh.SetPaintingStrategy(PaintingStrategy.HORIZONTAL);
VAHigh.HideBubble();
VAHigh.HideTitle();
VALow.SetPaintingStrategy(PaintingStrategy.HORIZONTAL);
VALow.HideBubble();
VALow.HideTitle();
VAHigh.SetDefaultColor(GlobalColor("Value Area"));
VALow.SetDefaultColor(GlobalColor("Value Area"));
ProfileHigh.SetPaintingStrategy(PaintingStrategy.HORIZONTAL);
ProfileLow.SetPaintingStrategy(PaintingStrategy.HORIZONTAL);
ProfileHigh.SetDefaultColor(GetColor(3));
ProfileLow.SetDefaultColor(GetColor(3));
ProfileHigh.Hide();
ProfileLow.Hide();
def bubble = isNaN(close[2]) and !isNaN(close[3]);
AddChartBubble(bubble, VAHigh[3], "VAH", color = Color.YELLOW, yes);
AddChartBubble(bubble, VALow[3], "VAL", Color.YELLOW, no);
AddChartBubble(bubble, POC[3], "POC", Color.RED, no);
# End Code Volume Profile RTH and GlobeX
 
ToS's built in Volume Profile is correct according to Professor Jeff Bierman, CTA. He worked as the chief market technician for ThinkorSwim for 5 years before the buyout by TDA. Keep in mind, just like the Fractal Energy Indicator is similar to the Chop Indicator even though the math constructs are different.

Code:
#VolumeProfile_RTHvOvernight
#JoeBone87 in TSL May 2019 (No Guarantee it will plot but math should be good)

input pricePerRowHeightMode = {default AUTOMATIC, TICKSIZE, CUSTOM};
input customRowHeight = 1.0;
input onExpansion = no;
input profiles = 1000;
input showPointOfControl = yes;
input showValueArea = yes;
input valueAreaPercent = 70;
input opacity = 50;

input rthbegin  = 0930;
input rthend    = 1600;
def count = secondsfromTime(rthbegin)>0 and secondstillTime(rthend)>0;
def cond = count != count[1];
def height;
switch (pricePerRowHeightMode) {
case AUTOMATIC:
height = PricePerRow.AUTOMATIC;
case TICKSIZE:
height = PricePerRow.TICKSIZE;
case CUSTOM:
height = customRowHeight;
}

profile vol = VolumeProfile("startNewProfile" = cond, "onExpansion" = onExpansion, "numberOfProfiles" = profiles, "pricePerRow" = height, "value area percent" = valueAreaPercent);
def con = CompoundValue(1, onExpansion, no);
def pc = if IsNaN(vol.GetPointOfControl()) and con then pc[1] else vol.GetPointOfControl();
def hVA = if IsNaN(vol.GetHighestValueArea()) and con then hVA[1] else vol.GetHighestValueArea();
def lVA = if IsNaN(vol.GetLowestValueArea()) and con then lVA[1] else vol.GetLowestValueArea();

def hProfile = if IsNaN(vol.GetHighest()) and con then hProfile[1] else vol.GetHighest();
def lProfile = if IsNaN(vol.GetLowest()) and con then lProfile[1] else vol.GetLowest();
def plotsDomain = IsNaN(close) == onExpansion;

plot POC = if plotsDomain then pc else Double.NaN;
plot ProfileHigh = if plotsDomain then hProfile else Double.NaN;
plot ProfileLow = if plotsDomain then lProfile else Double.NaN;
plot VAHigh = if plotsDomain then hVA else Double.NaN;
plot VALow = if plotsDomain then lVA else Double.NaN;

DefineGlobalColor("Profile", GetColor(1));
DefineGlobalColor("Point Of Control", GetColor(5));
DefineGlobalColor("Value Area", GetColor(8));

vol.Show(GlobalColor("Profile"), if showPointOfControl then GlobalColor("Point Of Control") else Color.CURRENT, if showValueArea then GlobalColor("Value Area") else Color.CURRENT, opacity);
POC.SetDefaultColor(GlobalColor("Point Of Control"));
POC.SetPaintingStrategy(PaintingStrategy.HORIZONTAL);
VAHigh.SetPaintingStrategy(PaintingStrategy.HORIZONTAL);
VALow.SetPaintingStrategy(PaintingStrategy.HORIZONTAL);
VAHigh.SetDefaultColor(GlobalColor("Value Area"));
VALow.SetDefaultColor(GlobalColor("Value Area"));
ProfileHigh.SetPaintingStrategy(PaintingStrategy.HORIZONTAL);
ProfileLow.SetPaintingStrategy(PaintingStrategy.HORIZONTAL);
ProfileHigh.SetDefaultColor(GetColor(3));
ProfileLow.SetDefaultColor(GetColor(3));
ProfileHigh.Hide();
ProfileLow.Hide();

input bubbles = yes;
input n  = 2;
def   n1 = n + 1;
AddChartBubble(bubbles and !IsNaN(close[n1]) and IsNaN(close[n]), VAHigh[n1], "V-VAH", color = Color.YELLOW, yes);
AddChartBubble(bubbles and !IsNaN(close[n1]) and IsNaN(close[n]), VALow[n1], "V-VAL", Color.YELLOW, no);
AddChartBubble(bubbles and !IsNaN(close[n1]) and IsNaN(close[n]), POC[n1], "V-POC", Color.RED, no);

The Volume Profile script below lets you set the starting time.

Code:
# Volume Profile for User Set Time
# Mobius
# Chat Room Discussion 03.26.2018

input pricePerRowHeightMode = {AUTOMATIC, TICKSIZE, default CUSTOM};
input customRowHeight = 1.0;
input onExpansion = no;
input profiles = 5; #Hint profiles: for just RTH 1 for GlobeX and RTH 2
input showPointOfControl = yes;
input showValueArea = yes;
input valueAreaPercent = 68;
input opacity = 5;
input Begin = 0930;

def TS = TickSize();
def Active = SecondsTillTime(Begin) == 0;
def cond = Active;
def height;
switch (pricePerRowHeightMode) {
case AUTOMATIC:
    height = PricePerRow.AUTOMATIC;
case TICKSIZE:
    height = PricePerRow.TICKSIZE;
case CUSTOM:
    height = customRowHeight;
}
profile vol = VolumeProfile("startNewProfile" = cond, "onExpansion" = onExpansion, "numberOfProfiles" = profiles, "pricePerRow" = height, "value area percent" = valueAreaPercent);
def con = CompoundValue(1, onExpansion, no);
def pc = if IsNaN(vol.GetPointOfControl()) and con
         then pc[1]
         else vol.GetPointOfControl();
def hVA = if IsNaN(vol.GetHighestValueArea()) and con
          then hVA[1]
          else Round(vol.GetHighestValueArea(), 0);
def lVA = if IsNaN(vol.GetLowestValueArea()) and con
          then lVA[1]
          else vol.GetLowestValueArea();
def hProfile = if IsNaN(vol.GetHighest()) and con
               then hProfile[1]
               else vol.GetHighest();
def lProfile = if IsNaN(vol.GetLowest()) and con
               then lProfile[1]
               else vol.GetLowest();
def plotsDomain = IsNaN(close) == onExpansion;

plot POC = if plotsDomain
           then Round(pc / TS, 0) * TS
           else Double.NaN;
plot ProfileHigh = if plotsDomain
                   then Round(hProfile / TS, 0) * TS
                   else Double.NaN;
plot ProfileLow = if plotsDomain
                  then Round(lProfile / TS, 0) * TS
                  else Double.NaN;
plot VAHigh = if plotsDomain
              then Round(hVA / TS, 0) * TS
              else Double.NaN;
plot VALow = if plotsDomain
             then Round(lVA / TS, 0) * TS
             else Double.NaN;

DefineGlobalColor("Profile", GetColor(1));
DefineGlobalColor("Point Of Control", GetColor(5));
DefineGlobalColor("Value Area", GetColor(8));

vol.Show(GlobalColor("Profile"), if showPointOfControl then GlobalColor("Point Of Control") else Color.CURRENT, if showValueArea then GlobalColor("Value Area") else Color.CURRENT, opacity);

POC.SetDefaultColor(GlobalColor("Point Of Control"));
POC.SetPaintingStrategy(PaintingStrategy.HORIZONTAL);
VAHigh.SetPaintingStrategy(PaintingStrategy.HORIZONTAL);
VAHigh.HideBubble();
VAHigh.HideTitle();
VALow.SetPaintingStrategy(PaintingStrategy.HORIZONTAL);
VALow.HideBubble();
VALow.HideTitle();
VAHigh.SetDefaultColor(GlobalColor("Value Area"));
VALow.SetDefaultColor(GlobalColor("Value Area"));
ProfileHigh.SetPaintingStrategy(PaintingStrategy.HORIZONTAL);
ProfileLow.SetPaintingStrategy(PaintingStrategy.HORIZONTAL);
ProfileHigh.SetDefaultColor(GetColor(3));
ProfileLow.SetDefaultColor(GetColor(3));
ProfileHigh.Hide();
ProfileLow.Hide();
def bubble = isNaN(close[2]) and !isNaN(close[3]);
AddChartBubble(bubble, VAHigh[3], "VAH", color = Color.YELLOW, yes);
AddChartBubble(bubble, VALow[3], "VAL", Color.YELLOW, no);
AddChartBubble(bubble, POC[3], "POC", Color.RED, no);
# End Code Volume Profile User Set Time

Volume Profile Scanner

Code:
# Mr. Script
def yyyymmdd = GetYYYYMMDD();
def day_number = DaysFromDate(First(yyyymmdd)) + GetDayOfWeek(First(yyyymmdd));
def period = Floor(day_number / 7);
def cond = 0 < period - period[1];
profile vol = VolumeProfile("startNewProfile" = cond, "onExpansion" = no);
vol.Show("va color" = Color.YELLOW);
def b = vol.GetLowestValueArea();
plot c = close <= b and close >= (b*.9);
c.setPaintingStrategy(paintingStrategy.BOOLEAN_ARROW_UP);
 
Hi @Shinthus, here is another cog indicator https://usethinkscript.com/threads/center-of-gravity-cog-indicator-for-thinkorswim.138/ I think this might be the cog indicator you're looking for if you were in bluesgirl's chatroom. (I'm in the same room :) That's similar to what she uses. From what I understand with the cog indicator is you want to play the edges and also look at the curves of the waves. So if the waves are starting to curl up price may have found a bottom and start to move up. Maybe similar to boillinger bands.

As for volume profile here is a picture of the study I use on TOS. It looks at the volume profile for every individual day, so the levels are pretty much the same across all time frames. I can post the settings I have if you're interested :)

52B6GLo.png


I like to mark off the Value area Highs/Lows (the yellow lines) and the point of control (red line). I use these lines as support/resistance and targets for the next day.

dBsFGTi.png


Oh, all of those lines are hand-drawn lol. With Volume profile, there's a concept called VPOC or virgin point of control, which means if a point of control(the red line) hasn't been tested the next day after it's been made, the price will naturally trend towards it. The "put" target level was the value area high from 8/9/19, the same day the VPOC level is from. I'm still practicing with volume profile, but I like it so far.

Hopefully this helps.
 

Attachments

  • 52B6GLo.png
    52B6GLo.png
    61.2 KB · Views: 366
  • dBsFGTi.png
    dBsFGTi.png
    86.1 KB · Views: 314
Last edited by a moderator:
Also would like to post historical POC (Point of Control) to follow average POC.

Code:
# plots POC, VAH and VAL for profiles starting at RTH Open and ending 1,2,3 etc bars later
# Not a realistic solution to the problem
# Nube

def bn = BarNumber();
def na = Double.NaN;

script TestPro {
input Start = 1;
input nBars = 3;
def bn    = BarNumber();
def na    = Double.NaN;
def EndBar        = if   bn == start + nBars
                    then bn else endBar[1];
def NewProfile    = bn == start or
                    bn crosses above endBar;

profile testProfile = VolumeProfile("startNewProfile" = NewProfile
, "onExpansion" = no, "numberOfProfiles" = 1000, "pricePerRow" = TickSize(), "value area percent" = 68);

plot hva = if   bn == EndBar
           then testProfile.GetHighestValueArea()
           else na;
plot lva = if   bn == EndBar
           then testProfile.GetLowestValueArea()
           else na;
plot poc = if   bn == EndBar
           then testProfile.GetPointOfControl()
           else na;
}
def RTHOpen = GetDay() == GetLastDay() &&
              GetTime() crosses above
              RegularTradingStart(GetYYYYMMDD());
def RTHBar = CompoundValue(1,
             if   RTHOpen
             then bn
             else RTHBar[1],0);


def hva =
if  bn == RTHBar + 1 then TestPro(RTHBar,1).hva else
if  bn == RTHBar + 2 then TestPro(RTHBar,2).hva else
if  bn == RTHBar + 3 then TestPro(RTHBar,3).hva else
if  bn == RTHBar + 4 then TestPro(RTHBar,4).hva else
if  bn == RTHBar + 5 then TestPro(RTHBar,5).hva else
if  bn == RTHBar + 6 then TestPro(RTHBar,6).hva else
if  bn == RTHBar + 7 then TestPro(RTHBar,7).hva else
if  bn == RTHBar + 8 then TestPro(RTHBar,8).hva else
if  bn == RTHBar + 9 then TestPro(RTHBar,9).hva else
if  bn == RTHBar + 10 then TestPro(RTHBar,10).hva else
if  bn == RTHBar + 11 then TestPro(RTHBar,11).hva else
if  bn == RTHBar + 12 then TestPro(RTHBar,12).hva else
if  bn == RTHBar + 13 then TestPro(RTHBar,13).hva else
if  bn == RTHBar + 14 then TestPro(RTHBar,14).hva else
na;

def lva =
if  bn == RTHBar + 1 then TestPro(RTHBar,1).lva else
if  bn == RTHBar + 2 then TestPro(RTHBar,2).lva else
if  bn == RTHBar + 3 then TestPro(RTHBar,3).lva else
if  bn == RTHBar + 4 then TestPro(RTHBar,4).lva else
if  bn == RTHBar + 5 then TestPro(RTHBar,5).lva else
if  bn == RTHBar + 6 then TestPro(RTHBar,6).lva else
if  bn == RTHBar + 7 then TestPro(RTHBar,7).lva else
if  bn == RTHBar + 8 then TestPro(RTHBar,8).lva else
if  bn == RTHBar + 9 then TestPro(RTHBar,9).lva else
if  bn == RTHBar + 10 then TestPro(RTHBar,10).lva else
if  bn == RTHBar + 11 then TestPro(RTHBar,11).lva else
if  bn == RTHBar + 12 then TestPro(RTHBar,12).lva else
if  bn == RTHBar + 13 then TestPro(RTHBar,13).lva else
if  bn == RTHBar + 14 then TestPro(RTHBar,14).lva else
na;

def poc =
if  bn == RTHBar + 1 then TestPro(RTHBar,1).poc else
if  bn == RTHBar + 2 then TestPro(RTHBar,2).poc else
if  bn == RTHBar + 3 then TestPro(RTHBar,3).poc else
if  bn == RTHBar + 4 then TestPro(RTHBar,4).poc else
if  bn == RTHBar + 5 then TestPro(RTHBar,5).poc else
if  bn == RTHBar + 6 then TestPro(RTHBar,6).poc else
if  bn == RTHBar + 7 then TestPro(RTHBar,7).poc else
if  bn == RTHBar + 8 then TestPro(RTHBar,8).poc else
if  bn == RTHBar + 9 then TestPro(RTHBar,9).poc else
if  bn == RTHBar + 10 then TestPro(RTHBar,10).poc else
if  bn == RTHBar + 11 then TestPro(RTHBar,11).poc else
if  bn == RTHBar + 12 then TestPro(RTHBar,12).poc else
if  bn == RTHBar + 13 then TestPro(RTHBar,13).poc else
if  bn == RTHBar + 14 then TestPro(RTHBar,14).poc else
na;

plot
LoVA = if   bn > HighestAll(RTHBar)
       then lva else na;
plot
HiVA = if   bn > HighestAll(RTHBar)
       then hva else na;
plot
PointOfControl = if   bn > HighestAll(RTHBar)
                 then poc else na;

LoVA.SetDefaultColor(Color.Violet);
LoVA.SetStyle(Curve.Long_Dash);
LoVA.EnableApproximation();
HiVA.SetStyle(Curve.Long_Dash);
HiVA.SetDefaultColor(Color.Violet);
HiVA.EnableApproximation();
PointOfControl.SetDefaultColor(Color.Yellow);
PointOfControl.EnableApproximation();
 
Plots the average POC for all Chart Data. Can be used as boundaries for likely price range intraday.

Code:
# Average Point OF Control (POC) with Standard Deviation Bands
# Mobius
# V01.09.2018
# Plots the average point of control value and standard deviation for high and low price as bands around the average POC.

input SD_Multiplier = 2;

def h = high;
def l = low;
def x = BarNumber();
def RTHBar1 = if getTime() crosses above RegularTradingStart(getYYYYMMDD())
              then x
              else Double.NaN;
def cond = x == (RTHBar1);
profile vol = VolumeProfile("startNewProfile" = cond, "onExpansion" = no, "numberOfProfiles" = 100, "pricePerRow" = PricePerRow.TICKSIZE, "value area percent" = 68);
def pc = if IsNaN(vol.GetPointOfControl())
         then pc[1]
         else vol.GetPointOfControl();
def sumPc = if !isNaN(RTHbar1)
            then sumPC[1] + pc[1]
            else sumPc[1];
def sumD = if !isNaN(RTHbar1)
           then sumD[1] + 1
           else sumD[1];
def SDH = if isNaN(StDevAll(h))
          then SDH[1]
          else StDevAll(h);
def SDL = if isNaN(StDevAll(l))
          then SDL[1]
          else StDevAll(l);
plot Avgpc = (sumPc + pc) / (sumD + 1);
     Avgpc.SetDefaultColor(Color.Cyan);
plot upper = Avgpc + (SD_Multiplier*SDH);
     upper.SetDefaultColor(Color.Gray);
plot lower = Avgpc - (SD_Multiplier*SDL);
     lower.SetDefaultColor(Color.Gray);
# End Code
 
You people really want this? Just a moving average that can be duplicated by using the already existing SMA or EMA in ToS. Here is the POC avg compared to 100 length SMA and EMA.

MAc10QM.png


I doubt it is worth the trouble. If you have a POC that is plotted each day just add something like this :

Code:
input length =20;
plot smapoc =  simpleMovingAvg (poc, length);

Adjust length to fit what you want.
 
New here to the forum, but had a few questions regarding thinkscript for VolumeProfile in TOS. I know there is a study there already, but I need to change it a bit to fit my needs.

1)How can I be showing ALL the Weekly VOLUMEPROFILES On the chart (For all the Weeks on the chart)? When I click "No" in the Expansion input, it shows me all the VolumeProfiles, but it plots them on their respective Weeks' charts, when I need them to show next week's one (for each one of them - One period forward, so it can serve as support or resistance for next week). - You can take a look at Market Webs and/or Christian Fromhertz from Tribeca Trade Group (active on twitter)
2)How can I be having the Monthly Volume Profile shown when I have the Weekly Chart Up, the Weekly Volume profile shown when I have the Daily Chart up and the Daily Volume profile shown when I have the 60min. Chart up? and
3)On each of the respective charts above, I would need to see the POC plotted, UNTIL the price hits it again in the future (Virgin Point of Control).
So, for the Weekly chart the Monthly POC, for the Daily Chart the Weekly POC and for the 60min. chart the Daily POC to be carrying forward, until price hits them in the future. How can I do that?
 
TOS is giving me trouble with this one. Some invalid statements etc. Has anyone run this lately? I would appreciate it, if one could clean it up a bit. From the "Paint Bars" down there are a few "invalid statements" as it says. It doesn't bring up anything. Blank. It has an exclamation mark within an orange triangle at the top of the script. Am I doing something wrong or is it the script again? thx
 
I did thank you. I wish we could get the code to work, from the original post. @BenTen your help would be much appreciated, if you could let me know what can possibly be wrong with the code. It does not bring up any "Invalid statements", but it has the orange triangle with the exclamation mark in it. don't know what that means. thx

Anyone know how to make the original Volume Profile Study on TOS, be offset by 1 period?
That way, yesterday's, or last week's range will be showing on today's, or this week's chart?
Since I can seem to make the script above show on my charts and I do not know how to code, I could use your help.
Thx in advance for everyone's help
 
i hand typed the COG Center of Gravity code for TOS ( thinkorswim ) thinkscript indicator study that was posted above, since i cant copy and paste the picture. Here it is in easier copy and paste format. Please keep entire code intact.

Code:
# Ehlers_COG (Center Of Gravity)
# by growex
# Posted by: Mobius
# 12.18.2017
# Mobius: Someone was asking for a COG study with bands. Cog is an
# unbounded oscillartor as designed by Ehlers. It would need to be
# normalized to the price chart to have bands. Otherwise a 1 bar
# lag on the oscillator gives very good signals. COG is 1 weighted
# average shifted backwards to their center of lag or balance thus
# the name. I was picturing the lagged second line or signal line
# as the second of two but that's actually the same WAVG just
# lagged one bar
#
# Mobius: This study is an accurate translation of Ehlers Center
# Of Gravity.

declare lower;

input price = hl2;
input length = 10;

def Num = fold i = 0 to length -1
with n
do n + (1 + i) * getvalue(price, i , length - 1);
def denom = fold j = 0 to length -1
with k
do k + getvalue(price, j, length -1);
def CG = if denom <> 0 then -Num/Denom else double.NaN;

plot cgline = cg;
cgline.SetDefaultColor(color.green);
plot trigger = cgline[1];
trigger.setdefaultcolor(color.red);
addcloud(cgline, trigger, color.green, color.red);

#End Code Ehlers Center Of Gravity
 
Here is what I thought was a cool COG (Center of Gravity) study that someone posted in the lounge several years ago. I happened to find it in my files, thought I'd share it with the community

Code:
# Adaptive COG
# califj
# 8.5.2017

input price = close;
input CenterLine = 30;
def bar = CenterLine;

input CenterLine2 = 60;
input CenterLine3 = 100;
def length = -bar;

def displacement = (length / 2) + 1;
def dPrice = price[displacement];

def CMA = if !IsNaN(dPrice) then Average(dPrice, AbsValue(length)) else CMA[1] + (CMA[1] - CMA[2]);
def CenteredMA = if !IsNaN(price) then ExpAverage(CMA, bar) else Double.NaN;

plot Center =  CenteredMA;
Center.SetDefaultColor(Color.CYAN);
Center.SetStyle(Curve.SHORT_DASH);
plot Center2 =  if !IsNaN(price) then ExpAverage(CMA, CenterLine2) else Double.NaN;
Center2.SetDefaultColor(Color.LIME);
Center2.SetStyle(Curve.SHORT_DASH);
plot Center3 =  if !IsNaN(price) then ExpAverage(CMA, CenterLine3) else Double.NaN;
Center3.SetDefaultColor(Color.MAGENTA);
Center3.SetStyle(Curve.SHORT_DASH);

def pct = 100;
input width = 75;
def d = width / pct;
def d1 = 0.809 * d;
def d2 = 1.0 * d;
def d3 = 1.618 * d;
def stdDeviation = HighestAll("data" = AbsValue(CenteredMA - price));

plot UpperLine = CenteredMA + stdDeviation * d1;
plot LowerLine = CenteredMA - stdDeviation * d1;
plot UpperLine1 = CenteredMA + stdDeviation * d2;
plot LowerLine1 = CenteredMA - stdDeviation * d2;
plot UpperLine2 = CenteredMA + stdDeviation * d3;
plot LowerLine2 = CenteredMA - stdDeviation * d3;

UpperLine.SetDefaultColor(Color.GRAY);
UpperLine1.SetDefaultColor(Color.LIGHT_RED);
UpperLine2.SetDefaultColor(Color.RED);
LowerLine.SetDefaultColor(Color.GRAY);
LowerLine1.SetDefaultColor(Color.LIGHT_GREEN);
LowerLine2.SetDefaultColor(Color.GREEN);

def crossup = close > center and center2;
def crossdn = close < center and center2;
AddLabel(crossup, " crosses above", Color.GREEN);
AddLabel(crossdn, " crosses below", Color.RED);

Alert(Crosses(high, UpperLine2, CrossingDirection.ABOVE), " price crosses over upper line2!");
Alert(Crosses(low, LowerLine2, CrossingDirection.BELOW), " price crosses over lower line2!");

AddCloud(close, Center, Color.GREEN, Color.RED);
AddCloud(UpperLine, UpperLine1, Color.PINK, Color.PINK);
AddCloud(LowerLine, LowerLine1, Color.LIGHT_GREEN, Color.LIGHT_GREEN);

AddCloud(UpperLine2, UpperLine1, Color.RED, Color.RED);
AddCloud(LowerLine2, LowerLine1, Color.GREEN, Color.GREEN);
def bound1 = HighestAll(high) * 2;
def bound2 = LowestAll(low) / 2;
def cond1 = (close crosses below UpperLine1);
def cond2 = (close crosses above LowerLine1);

AssignPriceColor(if close > center and center2 and center3 then Color.BLUE else if close < center and center2 and center3 then Color.DARK_ORANGE else Color.GRAY);

We have Monkey Bars (several iterations) Volume Profile TPO Profile and a User Defined Profile all of which can be set to defined ranges. So yeah there's alternatives.

Code:
#
# TD Ameritrade IP Company, Inc. (c) 2010-2018
#

input pricePerRowHeightMode = {default AUTOMATIC, TICKSIZE, CUSTOM};
input customRowHeight = 1.0;
input aggregationPeriod = {"1 min", "2 min", "3 min", "4 min", "5 min", "10 min", "15 min", "20 min", default "30 min", "1 hour", "2 hours", "4 hours", "Day", "2 Days", "3 Days", "4 Days", "Week", "Month"};
input timePerProfile = {default CHART, MINUTE, HOUR, DAY, WEEK, MONTH, "OPT EXP", BAR, YEAR};
input multiplier = 1;
input onExpansion = yes;
input profiles = 1000;
input showMonkeyBar = yes;
input showThePlayground = yes;
input thePlaygroundPercent = 70;
input opacity = 100;
input emphasizeFirstDigit = no;
input markOpenPrice = yes;
input markClosePrice = yes;
input volumeShowStyle = MonkeyVolumeShowStyle.NONE;
input showVolumeVA = yes;
input showVolumePoc = yes;
input theVolumePercent = 70;
input showInitialBalance = yes;
input initialBalanceRange = 3;

def period;
def yyyymmdd = getYyyyMmDd();
def seconds = secondsFromTime(0);
def month = getYear() * 12 + getMonth();
def day_number = daysFromDate(first(yyyymmdd)) + getDayOfWeek(first(yyyymmdd));
def dom = getDayOfMonth(yyyymmdd);
def dow = getDayOfWeek(yyyymmdd - dom + 1);
def expthismonth = (if dow > 5 then 27 else 20) - dow;
def exp_opt = month + (dom > expthismonth);
def periodMin = Floor(seconds / 60 + day_number * 24 * 60);
def periodHour = Floor(seconds / 3600 + day_number * 24);
def periodDay = countTradingDays(Min(first(yyyymmdd), yyyymmdd), yyyymmdd) - 1;
def periodWeek = Floor(day_number / 7);
def periodMonth = month - first(month);

switch (timePerProfile) {
case CHART:
    period = 0;
case MINUTE:
    period = periodMin;
case HOUR:
    period = periodHour;
case DAY:
    period = periodDay;
case WEEK:
    period = periodWeek;
case MONTH:
    period = periodMonth;
case "OPT EXP":
    period = exp_opt - first(exp_opt);
case BAR:
    period = barNumber() - 1;
case YEAR:
    period = getYear() - first(getYear());
}

def count = compoundvalue(1, if period != period[1] then (getValue(count, 1) + period - period[1]) % multiplier else getValue(count, 1), 0);
def cond = compoundvalue(1, count < count[1] + period - period[1], yes);
def height;
switch (pricePerRowHeightMode) {
case AUTOMATIC:
    height = PricePerRow.AUTOMATIC;
case TICKSIZE:
    height = PricePerRow.TICKSIZE;
case CUSTOM:
    height = customRowHeight;
}

def timeInterval;
def aggMultiplier;
switch (aggregationPeriod) {
case "1 min":
    timeInterval = periodMin;
    aggMultiplier = 1;
case "2 min":
    timeInterval = periodMin;
    aggMultiplier = 2;
case "3 min":
    timeInterval = periodMin;
    aggMultiplier = 3;
case "4 min":
    timeInterval = periodMin;
    aggMultiplier = 4;
case "5 min":
    timeInterval = periodMin;
    aggMultiplier = 5;
case "10 min":
    timeInterval = periodMin;
    aggMultiplier = 10;
case "15 min":
    timeInterval = periodMin;
    aggMultiplier = 15;
case "20 min":
    timeInterval = periodMin;
    aggMultiplier = 20;
case "30 min":
    timeInterval = periodMin;
    aggMultiplier = 30;
case "1 hour":
    timeInterval = periodHour;
    aggMultiplier = 1;
case "2 hours":
    timeInterval = periodHour;
    aggMultiplier = 2;
case "4 hours":
    timeInterval = periodHour;
    aggMultiplier = 4;
case "Day":
    timeInterval = periodDay;
    aggMultiplier = 1;
case "2 Days":
    timeInterval = periodDay;
    aggMultiplier = 2;
case "3 Days":
    timeInterval = periodDay;
    aggMultiplier = 3;
case "4 Days":
    timeInterval = periodDay;
    aggMultiplier = 4;
case "Week":
    timeInterval = periodWeek;
    aggMultiplier = 1;
case "Month":
    timeInterval = periodMonth;
    aggMultiplier = 1;
}

def agg_count = compoundvalue(1, if timeInterval != timeInterval[1] then (getValue(agg_count, 1) + timeInterval - timeInterval[1]) % aggMultiplier else getValue(agg_count, 1), 0);
def agg_cond = compoundvalue(1,  agg_count < agg_count[1] + timeInterval - timeInterval[1], yes);

def digit = compoundValue(1, if cond then 1 else agg_cond + getValue(digit, 1), 1);

profile monkey = monkeyBars(digit, "startNewProfile" = cond, "onExpansion" = onExpansion,
"numberOfProfiles" = profiles, "pricePerRow" = height, "the playground percent" = thePlaygroundPercent,
"emphasize first digit" = emphasizeFirstDigit, "volumeProfileShowStyle" = volumeShowStyle, "volumePercentVA" = theVolumePercent,
 "show initial balance" = showInitialBalance, "initial balance range" = initialBalanceRange);
def con = compoundValue(1, onExpansion, no);
def mbar = compoundvalue(1, if IsNaN(monkey.getPointOfControl()) and con then getValue(mbar, 1) else monkey.getPointOfControl(), monkey.getPointOfControl());
def hPG = compoundvalue(1, if IsNaN(monkey.getHighestValueArea()) and con then getValue(hPG, 1) else monkey.getHighestValueArea(), monkey.getHighestValueArea());
def lPG = compoundvalue(1, if IsNaN(monkey.getLowestValueArea()) and con then getValue(lPG, 1) else monkey.getLowestValueArea(), monkey.getLowestValueArea());

def hProfile = compoundvalue(1, if IsNaN(monkey.getHighest()) and con then getValue(hProfile, 1) else monkey.getHighest(), monkey.getHighest());
def lProfile = compoundvalue(1, if IsNaN(monkey.getLowest()) and con then getValue(lProfile, 1) else monkey.getLowest(), monkey.getLowest());
def plotsDomain = IsNaN(close) == onExpansion;

plot MB = if plotsDomain then mbar else Double.NaN;
plot ProfileHigh = if plotsDomain then hProfile else Double.NaN;
plot ProfileLow = if plotsDomain then lProfile else Double.NaN;
plot PGHigh = if plotsDomain then hPG else Double.NaN;
plot PGLow = if plotsDomain then lPG else Double.NaN;

DefineGlobalColor("Monkey Bar", GetColor(4));
DefineGlobalColor("The Playground", GetColor(3));
DefineGlobalColor("Open Price", GetColor(1));
DefineGlobalColor("Close Price", GetColor(1));
DefineGlobalColor("Volume", GetColor(8));
DefineGlobalColor("Volume Value Area", GetColor(2));
DefineGlobalColor("Volume Point of Control", GetColor(3));
DefineGlobalColor("Initial Balance", GetColor(7));

monkey.show(color.red, if showMonkeyBar then globalColor("Monkey Bar") else color.current,
 if showThePlayground then globalColor("The Playground") else color.current,
 opacity, if markOpenPrice then globalColor("Open Price") else color.current,
 if markClosePrice then globalColor("Close Price") else color.current,
 if showInitialBalance then globalColor("Initial Balance") else color.current,
 globalColor("Volume"),
 if showVolumeVA then globalColor("Volume Value Area") else color.current,
 if showVolumePOC then globalColor("Volume Point of Control") else color.current);
MB.SetDefaultColor(globalColor("Monkey Bar"));
MB.SetPaintingStrategy(PaintingStrategy.HORIZONTAL);
PGHigh.SetPaintingStrategy(PaintingStrategy.HORIZONTAL);
PGLow.SetPaintingStrategy(PaintingStrategy.HORIZONTAL);
PGHigh.SetDefaultColor(globalColor("The Playground"));
PGLow.SetDefaultColor(globalColor("The Playground"));
ProfileHigh.SetPaintingStrategy(PaintingStrategy.HORIZONTAL);
ProfileLow.SetPaintingStrategy(PaintingStrategy.HORIZONTAL);
ProfileHigh.SetDefaultColor(GetColor(3));
ProfileLow.SetDefaultColor(GetColor(3));
ProfileHigh.hide();
ProfileLow.hide();
 

Join useThinkScript to post your question to a community of 21,000+ developers and traders.

Similar threads

Not the exact question you're looking for?

Start a new thread and receive assistance from our community.

87k+ Posts
495 Online
Create Post

Similar threads

Similar threads

The Market Trading Game Changer

Join 2,500+ subscribers inside the useThinkScript VIP Membership Club
  • Exclusive indicators
  • Proven strategies & setups
  • Private Discord community
  • ‘Buy The Dip’ signal alerts
  • Exclusive members-only content
  • Add-ons and resources
  • 1 full year of unlimited support

Frequently Asked Questions

What is useThinkScript?

useThinkScript is the #1 community of stock market investors using indicators and other tools to power their trading strategies. Traders of all skill levels use our forums to learn about scripting and indicators, help each other, and discover new ways to gain an edge in the markets.

How do I get started?

We get it. Our forum can be intimidating, if not overwhelming. With thousands of topics, tens of thousands of posts, our community has created an incredibly deep knowledge base for stock traders. No one can ever exhaust every resource provided on our site.

If you are new, or just looking for guidance, here are some helpful links to get you started.

What are the benefits of VIP Membership?
VIP members get exclusive access to these proven and tested premium indicators: Buy the Dip, Advanced Market Moves 2.0, Take Profit, and Volatility Trading Range. In addition, VIP members get access to over 50 VIP-only custom indicators, add-ons, and strategies, private VIP-only forums, private Discord channel to discuss trades and strategies in real-time, customer support, trade alerts, and much more. Learn all about VIP membership here.
How can I access the premium indicators?
To access the premium indicators, which are plug and play ready, sign up for VIP membership here.
Back
Top