Volume Profile Indicator & POCs For ThinkOrSwim

Hello Experts.

I am wondering if we have an Indicator which will locate yesterday Value High - Value Low - Point Of Control so we can plot them after new market session opens.

Second if we can do the same for 30 minutes profiles also. Take last 30 minute profile and plot it ahead for next 30 minutes.
 
I've been using this study for a bit now. I like it lots. Is there any way to turn this into a scan and/or strategy? i'd like to be able to scan for fundamentals and stocks in relation to the current project Volume profile. So for ex, stocks within 5% of VAH-yearly

or stocks consolidating between VAL and POC.

I tried it convert to a scan/strategy a bit but failed miserably atm. Not sure if it's past the limitations of ToS
 
I am interested in your VPOC settings. I have been looking at ways to have the VPOC for previous days marked. Can you please share your Volume Profile settings please?

Does anyone know if prior day's volume profile data can be referenced such as GetPointofControl()[1] or[2]...etc? When I've tried this in the past I could not get it to work but want to revisit this. I'd like to carry forward POC's and yesterdays value area as an example. Thanks
 
thanks for sharing the study. Works great! Quick question: the Standard Deviation Levels do not show on equities, but on the SPY it does. How can I get the study to reflect the standard deviations on equities?
 
Hey, would you mind sharing your settings? I'm using tos and I'm just learning about volume profile. Do you find it helpful for intraday trading? thank you!
 
The chart below shows the end of yesterdays regular trading hours session and the start of todays session for an etf I trade. The chart shows that yesterdays Low for the day (an unbroken red line) is carried over to the new session as a broken red line. I would like to be able to do the same with Yesterdays POC, Value Area High, and Value Area Low for the days volume profile. I do not need any other variables from yesterdays Volume Profile. Is some help possible for this, or pointing me in the direction of some code starter to call up the values that I could plot in an indicator with Thnkscript?

I am using the code posted by @gilda at the beginning of this thread. Pushing these lines into the next day's session can give a heads up on S/R and Magnet areas. https://usethinkscript.com/threads/projected-volume-profile-vah-val-poc.128/post-668 I don't use TPO profile, and only need to project Vol Profile POC and Value Area High and Low lines into the next day's session. No clouds, etc.

I have been able to modify other code to simplify & add to in order to get what I need in indicators. But this code is more complex and I wondering if it could be simplified to get just what I need and not all the other bells and whistles. I am wondering if anyone who knows coding could simplify this code. Just asking.
 
Last edited by a moderator:
@rlohmeyer Is this any better?

Code:
# Profile TPO & Volume
input profileType = {default Volume, Time};
input pricePerRowHeightMode = {default Ticksize, Automatic, Custom};
input customRowHeight = 1.0;
input timePerProfile = {default Day, Week, Month, Year, Hour, Chart, "Opt Exp"};
input multiplier = 1;
input OnExpansionProfile = No;
input OnExpansionValueArea = No;
input profiles = 2;
input showPointOfControl = Yes;
input showValueArea = Yes;
input ValueAreaPercent = 70;
input ShowHighLow = Yes;
input opacity = 5;
input ShowExtensions = No;
input DynamicHideExtensions = Yes;
def SE = ShowExtensions;


def period;
def yyyymmdd = GetYYYYMMDD();
def seconds = SecondsFromTime(0);
def month = GetYear() * 12 + GetMonth();
def year = GetYear();
def day_number = DaysFromDate(First(yyyymmdd)) + GetDayOfWeek(First(yyyymmdd));
def dom = GetDayOfMonth(yyyymmdd);
def dow = GetDayOfWeek(yyyymmdd - dom + 1);
def expthismonth = (if dow > 5 then 27 else 20) - dow;
def exp_opt = month + (dom > expthismonth);
switch (timePerProfile) {
case Chart:
    period = 0;
case Hour:
    period = Floor(seconds / 3600 + day_number * 24);
case Day:
    period = CountTradingDays(Min(First(yyyymmdd), yyyymmdd), yyyymmdd) - 1;
case Week:
    period = Floor(day_number / 7);
case Month:
    period = Floor(month - First(month));
case Year:
    period = Floor(year - First(year));
case "Opt Exp":
    period = exp_opt - First(exp_opt);
}

def CloseByPeriod = close(Period = timePerProfile)[-1];
def Openbyperiod  = open(Period = timePerProfile)[-1];
def NewDay = if !IsNaN(CloseByPeriod) then 0 else 1;

rec Count = if period != period[1] then (Count[1] + period - period[1]) % 1 else Count[1];
def Cond = Count < Count[1] + period - period[1];
def height;
switch (pricePerRowHeightMode) {
case Automatic:
    height = PricePerRow.AUTOMATIC;
case Ticksize:
    height = PricePerRow.TICKSIZE;
case Custom:
    height = customRowHeight;
}

profile VOL = if profileType == profileType.Volume then VolumeProfile("startNewProfile" = Cond, "onExpansion" = onExpansionProfile, "NumberOfProfiles" = profiles, "PricePerRow" = height, "Value Area Percent" = ValueAreaPercent) else TimeProfile("startNewProfile" = Cond, "OnExpansion" = onExpansionProfile, "NumberOfProfiles" = profiles, "PricePerRow" = height, "Value Area Percent" = ValueAreaPercent);

def con = CompoundValue(1, onExpansionProfile, no);
rec pc = if IsNaN(VOL.GetPointOfControl()) and con then pc[1] else VOL.GetPointOfControl();
rec hVA = if IsNaN(VOL.GetHighestValueArea()) and con then hVA[1] else VOL.GetHighestValueArea();
rec lVA = if IsNaN(VOL.GetLowestValueArea()) and con then lVA[1] else VOL.GetLowestValueArea();
rec HVA_Last = if period == period[1] then HVA_Last[1] else hVA[1];
rec PC_Last  = if period == period[1] then PC_Last[1]  else pc[1];
rec LVA_Last = if period == period[1] then LVA_Last[1] else lVA[1];
rec hProfile = if IsNaN(VOL.GetHighest()) and con then hProfile[1] else VOL.GetHighest();
rec lProfile = if IsNaN(VOL.GetLowest()) and con then lProfile[1] else VOL.GetLowest();
def plotsDomain = IsNaN(close) == onExpansionProfile;

rec hP_Last = if period == period[1] then hP_Last[1] else hProfile[1];
rec lP_Last = if period == period[1] then lP_Last[1] else lProfile[1];

plot VAH  = if !showValueArea then Double.NaN else if IsNaN(close[0]) then HVA_Last[0] else if !OnExpansionValueArea then HVA_Last[0] else Double.NaN;
plot POC  = if IsNaN(close[0]) then PC_Last[0] else if !OnExpansionValueArea then PC_Last[0] else Double.NaN;
plot VAL  = if !showValueArea then Double.NaN else if IsNaN(close[0]) then LVA_Last[0] else if !OnExpansionValueArea then LVA_Last[0] else Double.NaN;
plot High = if !ShowHighLow then Double.NaN else if IsNaN(close[0]) then hP_Last[0] else if !OnExpansionValueArea then hP_Last[0] else Double.NaN;
plot Low = if !ShowHighLow then Double.NaN else if IsNaN(close[0]) then lP_Last[0] else if !OnExpansionValueArea then lP_Last[0] else Double.NaN;

DefineGlobalColor("Profile", GetColor(7));
DefineGlobalColor("Point Of Control", GetColor(5));
DefineGlobalColor("Value Area", GetColor(8));


POC.SetPaintingStrategy(PaintingStrategy.HORIZONTAL);
POC.SetDefaultColor(Color.DARK_GRAY);
POC.SetLineWeight(1);
POC.HideTitle();

VAH.SetPaintingStrategy(PaintingStrategy.HORIZONTAL);
VAH.SetDefaultColor(Color.DARK_GREEN);
VAH.SetLineWeight(1);
VAH.HideBubble();
VAH.HideTitle();

VAL.SetPaintingStrategy(PaintingStrategy.HORIZONTAL);
VAL.SetDefaultColor(Color.DARK_RED);
VAL.SetLineWeight(1);
VAL.HideBubble();
VAL.HideTitle();

High.SetPaintingStrategy(PaintingStrategy.DASHES);
High.SetDefaultColor(CreateColor(38, 38, 8));
High.SetLineWeight(1);
High.HideBubble();
High.HideTitle();

Low.SetPaintingStrategy(PaintingStrategy.DASHES);
Low.SetDefaultColor(CreateColor(38, 38, 8));
Low.SetLineWeight(1);
Low.HideBubble();
Low.HideTitle();
 
@Dupre Thank you very much. Perfect.

Perfect example from this morning of the usefulness of this indicator on an ETF I trade. At the open, price rejects the previous day VAH twice for a nice move lower. The previous days VAH is the broken Gray Line. Price on 2 occasions went I tick higher and then broke lower.

I keep fooling with this code. The VAH, VAL lines are often off by enough to make a difference when trading 5 minutes. I gobbled together some simpler code to get my my basic POC, VAH, & VAL for the present day which works very well. It is below. I am wondering if this code can be added to or modified in order to have the previous day POC, VAH, & VAL as well as the present day without all the other code defining times, etc. Or am I just deluded that it can be simpler than all the code in the original example.

Code:
#JustProfileLines
#TD Ameritrade Code with minor changes

def yyyymmdd = GetYYYYMMDD();
def period = yyyymmdd;
def cond = 0 < period - period[1];

profile vol = VolumeProfile("startNewProfile" = cond, "onExpansion" = no);
vol.Show("opacity" = 0);

plot VAH = vol.GetHighestValueArea();
plot VAL = vol.GetLowestValueArea();
plot POC=vol.GetPointOfControl();
 
From everything I've poked around with I don't think this can be done, but I wanted to ask anyway.

It looks like TOS has the volume profile study locked down so you can only pull POC/Value area. I want to be able to pull data for basically each line / price level.

Basically I would like to automatically look for HVN's, LVN's and edges etc. If TOS can't do it does anyone know of another platform that has that data available ?

Found this script: http://tos.mx/s4SLQt

Code:
# Begin Code --------------------------------------------------------------------
# Mobius
# Mobius.rts[at]gmail.com
# Study Name:  Mobius_Volume_Profile_Plus
# Copy and paste the above name to the Study name before saving the new study.
# V02102011.14
# Study Number 112
# Notes: This is not a recommendation or endorsement to trade any equity.
# Trading has extreme risk and you should not trade equities without fully understanding all risks associated with trading.
# Day trading or Intraday trading could and often does cause extreme financial loss.
#Hint: Volume Profile with Fibonacci Levels and Directional Day Filter.\n \n Aggregation for Volume Profile must be set at a higher level than chart aggregation. \n The Directional Day Filter calculates an average of the first 5Min bar and the extreme values above and below that line for the defined period. \n If the periods closing above the line are grater than those below the day will finish above that line approximately 65% of the time. \n Below the opposite holds true. \n On even distribution days it indicates the likelihood of a flat day. \n At a turn from either extreme of the range the trend will likely be to the opposite side of the range after 1 ATR. \n Target should be the closest Fibonacci. \n If the volume is rising move stop to that level, take 1/2 off and let the trade run to the next Fibonacci, take another 1/2 off and continue to the other extreme end of the range. \n If the extreme of either end of the range is breached it is likely to continue past the breech for 1 ATR. \n If the volume spikes above the norm for the day it is likely to trend further and moving stops each
 
@BlueRaven It certainly doesnt seem possible. I do have this code by Mobius, although it is likely not what you're looking for.

Code:
# High Volume Nodes
# Mobius
# V01.02.2018
# Looks for the highest volume candle in "n" periods and plots the candle range.
# As Volatility increases this study has two values. Plotting a current high volume node as a channel which price will be drawn back to and test since a very high volume node will move price quickly, and price will retest that area. And, with the legacy plots a way to quickly see if larger traders, those that can generate a high volume node, are accumulating or distributing inventory.

input n = 60;
input r = .95;
input LegacyPoints = yes;

def h = high;
def l = low;
def c = close;
def v = volume;
def x = barNumber();
def HighVolume = if ((v - Lowest(v, n)) / (Highest(v, n) - Lowest(v, n))) >= r
                 then x
                 else Double.NaN;
def hh = if !IsNaN(HighVolume)
         then h
         else hh[1];
def ll = if !IsNaN(HighVolume)
         then l
         else ll[1];
plot hhLine = if x >= HighestAll(HighVolume)
              then HighestAll(if IsNaN(c)
                              then hh
                              else Double.NaN)
              else Double.NaN;
hhLine.SetDefaultColor(Color.GRAY);
plot llLine = if x >= HighestAll(HighVolume)
              then HighestAll(if IsNaN(c)
                              then ll
                              else Double.NaN)
              else Double.NaN;
llLine.SetDefaultColor(Color.GRAY);
plot legacy = if LegacyPoints and !IsNaN(HighVolume)
              then l - (2*TickSize())
              else Double.NaN;
legacy.SetStyle(Curve.POINTS);
legacy.SetLineWeight(3);
legacy.SetDefaultColor(Color.Gray);
AddCloud(llLine, hhLine, Color.DARK_GRAY, Color.DARK_GRAY, yes);
# End Code High Volume Nodes
 
Yeah, I've seen that one before and played with it a bit, but yeah it's not what I'm after. I really don't think its possible in TOS.
 
Maybe just a coincidence but I believe Mobius Fractal pivot mobile lines up pretty well with POC. (At least I think I remember it does)
 
From everything I've poked around with I don't think this can be done, but I wanted to ask anyway.

It looks like TOS has the volume profile study locked down so you can only pull POC/Value area. I want to be able to pull data for basically each line / price level.

Basically I would like to automatically look for HVN's, LVN's and edges etc. If TOS can't do it does anyone know of another platform that has that data available ?

1) Copy all of the stock TOS Volume Profile study code into a new study you're creating(maybe call it VolumeProfileME, or whatever you want).

2) Once created, you can edit the new study and manipulate code and/or variables to do rather interesting things.

Some of what I experimented with were:

-- Showing various levels for today vs. other levels for previous days
.
-- Continuing a level from yesterday onto today's chart(ex: yesterday's POC extends to show on today's chart; very handy, as you can then show/hide prices, use algorithms against yesterday's POC value, etc.).

-- Placing price bubbles/comments/labels/markers/whatever for diff variables and/or labels.

-- Show bubbles when approaching a particular level, such as LVA or POC, etc. to give me a heads up.

-- Set some of the defaults more to my liking. Gets old adding the stock/TOS study to charts and having to change -their- defaults each time.

I no longer use Volume Profile, etc. all that much, but I still have it showing; more as a confirmation thing than anything else.
 
Looking for a support & resistance based on volume profile similar to tradestation. Could anyone make one for TOS?
 
Last edited by a moderator:
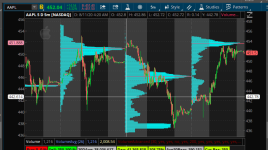
Question: The AAPL chart is how I have my TOS volume profile setup.
I have 'price per height' as "Ticksize" + "time per profile" as "Day" + "on expansion" "no" + "show value area" "no".
This is as close as I can get it to the volume profile of a twitter post I saw on the bottum chart of GNPX.
And I am envious of how they did their volume profile!
Somehow, they are able to have expansion volume profile of the chart added to the "no" "on expansion" chart.
How in the heck did they do that??


7fRIh6N.png
hg07EXp.png
 

Attachments

  • 7fRIh6N.png
    7fRIh6N.png
    56 KB · Views: 1,455
Click on the gear icon next to your indicator's name and adjust the settings of the Volume Profile indicator.
 

Join useThinkScript to post your question to a community of 21,000+ developers and traders.

Not the exact question you're looking for?

Start a new thread and receive assistance from our community.

87k+ Posts
168 Online
Create Post

The Market Trading Game Changer

Join 2,500+ subscribers inside the useThinkScript VIP Membership Club
  • Exclusive indicators
  • Proven strategies & setups
  • Private Discord community
  • ‘Buy The Dip’ signal alerts
  • Exclusive members-only content
  • Add-ons and resources
  • 1 full year of unlimited support

Frequently Asked Questions

What is useThinkScript?

useThinkScript is the #1 community of stock market investors using indicators and other tools to power their trading strategies. Traders of all skill levels use our forums to learn about scripting and indicators, help each other, and discover new ways to gain an edge in the markets.

How do I get started?

We get it. Our forum can be intimidating, if not overwhelming. With thousands of topics, tens of thousands of posts, our community has created an incredibly deep knowledge base for stock traders. No one can ever exhaust every resource provided on our site.

If you are new, or just looking for guidance, here are some helpful links to get you started.

What are the benefits of VIP Membership?
VIP members get exclusive access to these proven and tested premium indicators: Buy the Dip, Advanced Market Moves 2.0, Take Profit, and Volatility Trading Range. In addition, VIP members get access to over 50 VIP-only custom indicators, add-ons, and strategies, private VIP-only forums, private Discord channel to discuss trades and strategies in real-time, customer support, trade alerts, and much more. Learn all about VIP membership here.
How can I access the premium indicators?
To access the premium indicators, which are plug and play ready, sign up for VIP membership here.
Back
Top