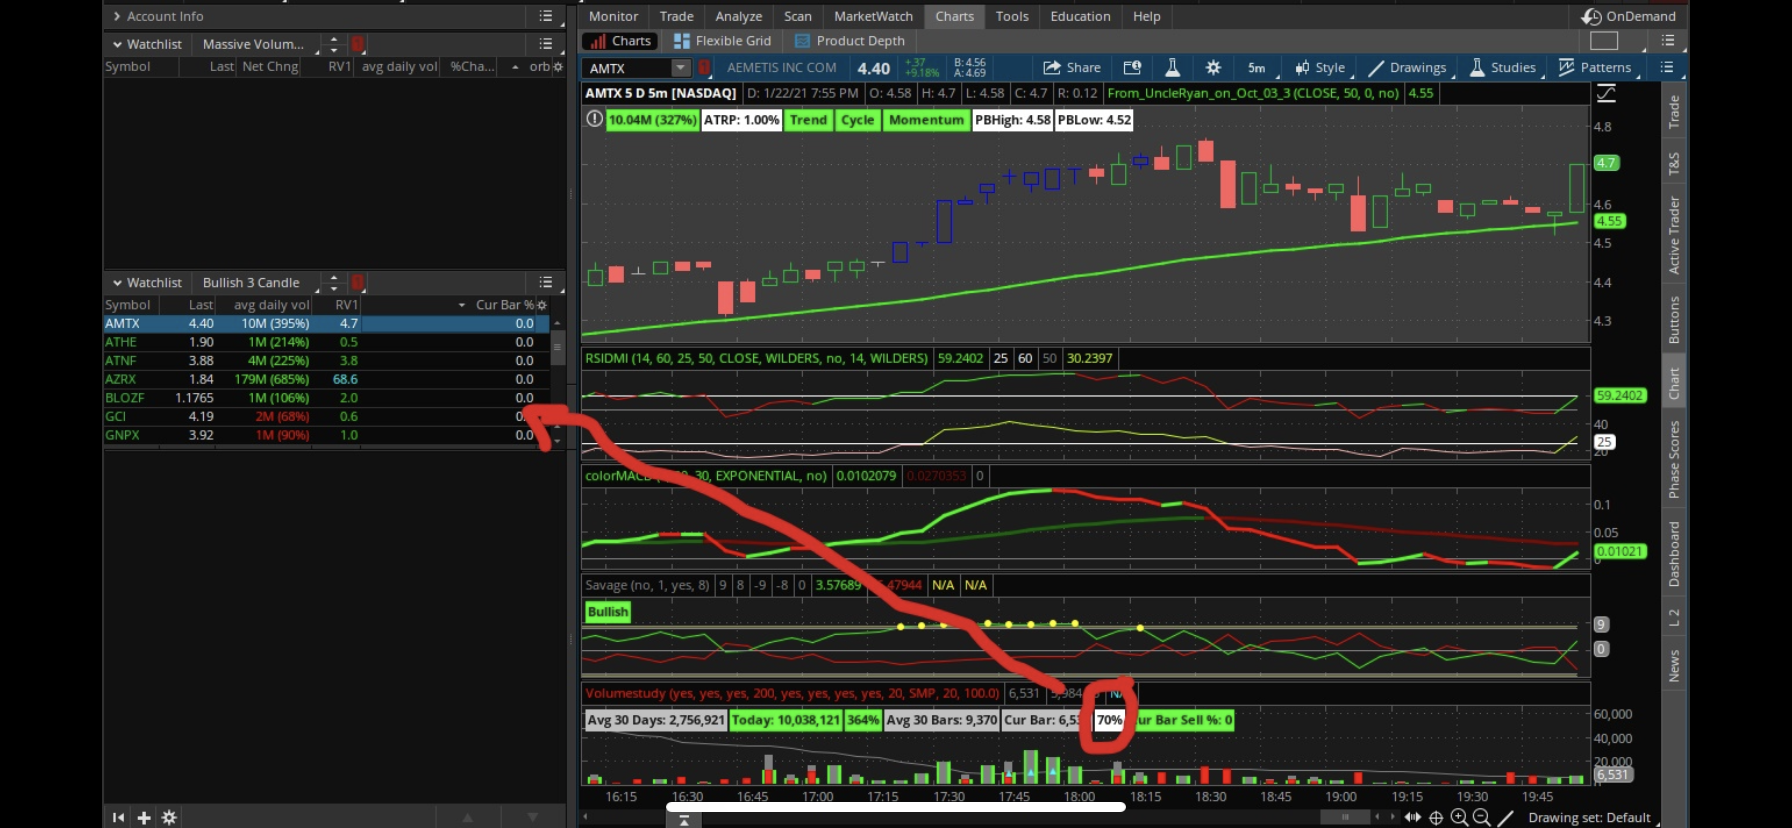
Volume Buy Sell Pressure with Hot Percent for ThinkorSwim

Hey guys. I have been working on this indicator to make it so that you can input the loopback period and that way you aren't stuck with only 30 Days/Bars. I think I've got a decent replacement (I also changed the labels that show Buy/Sell percentages so that you see one for each). However my numbers don't add up to the originals even with the simple moving average. Any hep would be appreciated.

The top window is the original version posted here. The bottom one is my mod.
WtSHucI.png


Here is the code to my mod:

Code:
# Original author: Unknown
# Modified by 7of9
# Second Mod by Ramon DV

declare lower;

#Inputs

input ShowDayAvg = yes;
input AvgDayVolLength = 30;
input ShowTodayVolume = yes;
input ShowPercentOfDayAvg = yes;
input UnusualVolumePercent = 200;
input ShowBarAvg = yes;
input AvgBarVolLength = 30;
input ShowCurrentBar = yes;
input ShowPercentOfBarAvg = yes;
input ShowSellVolumePercent = yes;
input ShowBuyVolumePercent = yes;
input AvgType = AverageType.SIMPLE;

def O = open;
def H = high;
def C = close;
def L = low;
def V = volume;
def buying = V*(C-L)/(H-L);
def selling = V*(H-C)/(H-L);

# Selling Volume

Plot SellVol = selling;
SellVol.setPaintingStrategy(PaintingStrategy.Histogram);
SellVol.SetDefaultColor(Color.Red);
SellVol.HideTitle();
SellVol.HideBubble();
SellVol.SetLineWeight(5);

# Total Volume

Plot BuyVol = volume;
BuyVol.setPaintingStrategy(PaintingStrategy.Histogram);
BuyVol.SetDefaultColor(Color.Dark_Green);
BuyVol.HideTitle();
BuyVol.HideBubble();
BuyVol.SetLineWeight(5);

#Volume Data

def DayVol = volume(period = “DAY”);
def AvgDayVol = MovingAverage(AvgType, DayVol, AvgDayVolLength);
def percentOfDay = Round((DayVol / AvgDayVol) * 100, 0);
def AvgBarVol = MovingAverage(AvgType, Volume, AvgBarVolLength);
def percentOfBar = Round((Volume / AvgBarVol) * 100, 0);
def SellVolPercent = Round((Selling / Volume) * 100, 0);
def BuyVolPercent = 100 - SellVolPercent;

# Labels

AddLabel(ShowDayAvg, "Avg “ + AvgDayVolLength + “ Days: " + Round(AvgDayVol, 0), Color.LIGHT_GRAY);

AddLabel(ShowTodayVolume, "Today: " + DayVol, (if percentOfDay >= UnusualVolumePercent then Color.GREEN else if percentOfDay >= 100 then Color.ORANGE else Color.LIGHT_GRAY));

AddLabel(ShowPercentOfDayAvg, percentOfDay + "%", (if percentOfDay >= UnusualVolumePercent then Color.GREEN else if percentOfDay >= 100 then Color.ORANGE else Color.WHITE) );

AddLabel(ShowBarAvg, "Avg “ + AvgBarVolLength + ” Bars: " + Round(AvgBarVol, 0), Color.LIGHT_GRAY);

AddLabel(ShowCurrentBar, "Cur Bar: " + volume, (if percentOfBar >= UnusualVolumePercent then Color.GREEN else if percentOfBar >= 100 then Color.ORANGE else Color.LIGHT_GRAY));

AddLabel(ShowPercentOfBarAvg, percentOfBar + "%", (if percentOfBar >= UnusualVolumePercent then Color.GREEN else if percentOfBar >= 100 then Color.ORANGE else Color.WHITE) );


AddLabel(ShowSellVolumePercent, "Cur Bar Sell %: "+SellVolPercent, if SellVolPercent > BuyVolPercent then color.red else color.black);
AddLabel(ShowBuyVolumePercent, "Cur Bar Buy %: "+BuyVolPercent, if BuyVolPercent > SellVolPercent then color.green else color.black);


input length = 50;

plot Vol = volume;
plot VolAvg = Average(volume, length);

Vol.SetPaintingStrategy(PaintingStrategy.HISTOGRAM);
Vol.SetLineWeight(3);
Vol.DefineColor("Up", Color.UPTICK);
Vol.DefineColor("Down", Color.DOWNTICK);
Vol.AssignValueColor(if close > close[1] then Vol.color("Up") else if close < close[1] then Vol.color("Down") else GetColor(1));
VolAvg.SetDefaultColor(GetColor(8));

Here is the shareable link to my mod:

https://tos.mx/owi0kjx
 

Join useThinkScript to post your question to a community of 21,000+ developers and traders.

OH SNAP!!!! I figured it out. Here is the correct code that eliminates the problem.

Code:
# Original author: Unknown
# Modified by 7of9
# Second Mod by Ramon DV

declare lower;

#Inputs

input ShowDayAvg = yes;
input AvgDayVolLength = 30;
input ShowTodayVolume = yes;
input ShowPercentOfDayAvg = yes;
input UnusualVolumePercent = 200;
input ShowBarAvg = yes;
input AvgBarVolLength = 30;
input ShowCurrentBar = yes;
input ShowPercentOfBarAvg = yes;
input ShowSellVolumePercent = yes;
input ShowBuyVolumePercent = yes;
input AvgType = AverageType.SIMPLE;

def O = open;
def H = high;
def C = close;
def L = low;
def V = volume;
def buying = V*(C-L)/(H-L);
def selling = V*(H-C)/(H-L);

# Selling Volume

Plot SellVol = selling;
SellVol.setPaintingStrategy(PaintingStrategy.Histogram);
SellVol.SetDefaultColor(Color.Red);
SellVol.HideTitle();
SellVol.HideBubble();
SellVol.SetLineWeight(5);

# Total Volume

Plot BuyVol = volume;
BuyVol.setPaintingStrategy(PaintingStrategy.Histogram);
BuyVol.SetDefaultColor(Color.Dark_Green);
BuyVol.HideTitle();
BuyVol.HideBubble();
BuyVol.SetLineWeight(5);

#Volume Data

def DayVol = volume(period = “DAY”);
def AvgDayVol = MovingAverage(AvgType, DayVol[1], AvgDayVolLength);
def percentOfDay = Round((DayVol / AvgDayVol) * 100, 0);
def AvgBarVol = MovingAverage(AvgType, Volume[1], AvgBarVolLength);
def percentOfBar = Round((Volume / AvgBarVol) * 100, 0);
def SellVolPercent = Round((Selling / Volume) * 100, 0);
def BuyVolPercent = 100 - SellVolPercent;

# Labels

AddLabel(ShowDayAvg, "Avg “ + AvgDayVolLength + “ Days: " + Round(AvgDayVol, 0), Color.LIGHT_GRAY);

AddLabel(ShowTodayVolume, "Today: " + DayVol, (if percentOfDay >= UnusualVolumePercent then Color.GREEN else if percentOfDay >= 100 then Color.ORANGE else Color.LIGHT_GRAY));

AddLabel(ShowPercentOfDayAvg, percentOfDay + "%", (if percentOfDay >= UnusualVolumePercent then Color.GREEN else if percentOfDay >= 100 then Color.ORANGE else Color.WHITE) );

AddLabel(ShowBarAvg, "Avg “ + AvgBarVolLength + ” Bars: " + Round(AvgBarVol, 0), Color.LIGHT_GRAY);

AddLabel(ShowCurrentBar, "Cur Bar: " + volume, (if percentOfBar >= UnusualVolumePercent then Color.GREEN else if percentOfBar >= 100 then Color.ORANGE else Color.LIGHT_GRAY));

AddLabel(ShowPercentOfBarAvg, percentOfBar + "%", (if percentOfBar >= UnusualVolumePercent then Color.GREEN else if percentOfBar >= 100 then Color.ORANGE else Color.WHITE) );


AddLabel(ShowSellVolumePercent, "Cur Bar Sell %: "+SellVolPercent, if SellVolPercent > BuyVolPercent then color.red else color.black);
AddLabel(ShowBuyVolumePercent, "Cur Bar Buy %: "+BuyVolPercent, if BuyVolPercent > SellVolPercent then color.green else color.black);


input length = 50;

plot Vol = volume;
plot VolAvg = Average(volume, length);

Vol.SetPaintingStrategy(PaintingStrategy.HISTOGRAM);
Vol.SetLineWeight(3);
Vol.DefineColor("Up", Color.UPTICK);
Vol.DefineColor("Down", Color.DOWNTICK);
Vol.AssignValueColor(if close > close[1] then Vol.color("Up") else if close < close[1] then Vol.color("Down") else GetColor(1));
VolAvg.SetDefaultColor(GetColor(8));
 
@horserider Thank you for your work! I was wondering if you could add Relative Volume Standard Deviation, as a filter that will hide the candles that are below a given level.

As a reference, this is the code of RelativeVolumeStDev with Spikes threshold

Code:
declare lower;
declare zerobase;

input length = 60;
input numDev = 2.0;
input allowNegativeValues = no;

def rawRelVol = (volume - Average(volume, length)) / StDev(volume, length);
def RelVol = if allowNegativeValues then rawRelVol else Max(0, rawRelVol);

plot StDevLevel = numDev;
plot RV = if RelVol > numDev then RelVol else Double.NaN;

RV.SetPaintingStrategy(PaintingStrategy.HISTOGRAM);
RV.SetLineWeight(3);
RV.DefineColor("Above", GetColor(0));
RV.DefineColor("Below", GetColor(2));
RV.AssignValueColor(if RelVol >= numDev then RV.Color("Above") else RV.Color("Below"));
StDevLevel.SetDefaultColor(GetColor(7));
StDevLevel.SetStyle(Curve.SHORT_DASH);
# End Code
 
I posted this on the thread for the older version but i'll ask it here as well...


I've been using this indicator or a version of it for awhile now.

Is there anyway to get the hourly vol labels and/or the hist on a 2 min chart?


So instead of on a 2min chart, seeing the 2 min bar vol, I want to see the hourly levels instead.

Thanks for any help
volume(period = aggregationperiod.hour);
 
I reconfigured it to correctly to show the hourly stats on a 2min chart except It still shows all the 2 min vol histogram bars.

Is there anyway to have it show only the hourly bars on a 2min chart?

Thanks
 
I would like to have this study check and see if it could be use as well on tick charts with out having to be on day frame time.

Code:
input period = AggregationPeriod.FOUR_min;

def O = open(period = period);
def H = high(period = period);
def C = close(period = period);
def L = low(period = period);
def V = volume(period = period);
input ShowChartBubble = yes;

# Selling Volume
def SV = -V * (H - C) / (H - L);

def O1 = open(period = period);
def H1 = high(period = period);
def C1 = close(period = period);
def L1 = low(period = period);
def V1 = volume(period = period);

# Buying Volume
def BV = V1 * (C1 - L1) / (H1 - L1);
plot SLine = SV + BV / 2;
SLine.AssignValueColor(if SLine > 0 then Color.GREEN else if SLine < 0 then Color.RED else Color.CYAN);
plot zeroLine = 0;
AddLabel(if BV>-SV then 1 else 0, "BuyVolume " + BV, Color.Green);
AddLabel(if BV>-SV then 0 else 1, "SellVolume " + SV, Color.Red);
rec vol = volume();

def cond1 = if BV - SV > 0 then 1 else 0;
def cond2 = if BV - SV < 0 then -1 else 0;

#AddChartBubble(ShowChartBubble,cond1, cond1, concat("", vol ), color.Green, No);

#AddChartBubble(ShowChartBubble,cond2, cond2, concat("", vol ), color.Green, No);
 
I adjusted this to my liking. I am not the original author. I just edited the code to make improvements. I think this is the best setup for it no matter what time frame you use. Enjoy.

Code:
#HINT: This study color codes volume by amount of volume on up-tick versus amount of volume on down-tick

declare lower;

def O = open;
def H = high;
def C = close;
def L = low;
def V = volume;
def Buying = V*(C-L)/(H-L);
def Selling = V*(H-C)/(H-L);

# Selling Volume
Plot SV = selling;
SV.setPaintingStrategy(PaintingStrategy.Histogram);
SV.SetDefaultColor(Color.Red);
SV.HideTitle();
SV.HideBubble();
SV.SetLineWeight(5);


Plot BV =  volume;
BV.setPaintingStrategy(PaintingStrategy.Histogram);
BV.SetDefaultColor(Color.Dark_Green);
BV.HideTitle();
BV.HideBubble();
BV.SetLineWeight(5);


#declare lower;
declare zerobase;

input length = 50;

#plot Vol = volume;
plot VolAvg = Average(volume, length);
 
@zeek

Code:
#Advanced Volume Study
#[email protected]
#v5.22.2020
declare upper;
input ShowBuySellStrength = yes;
input TickLevel = 1000;
input ShowTickLabel = yes;


def NA = Double.NaN;
def PriceRange = high - low;

#Current Candle Buy and Sell Strength
def BuyStr = ((close - low) / PriceRange) * 100;
def SellStr = ((high - close) / PriceRange) * 100;


#$TICK Vertical Lines
def tickc = close("$TICK");
def tickh = high("$TICK");
def tickl = low("$TICK");

#$TICK Label
AddLabel(if ShowTickLabel then 1 else 0,"$TICK: " + tickc, if tickc > 0 then Color.GREEN else Color.RED);

def trinRatio = Round(close(symbol="$TRIN"),2);
def trinOverlyBearish = if trinRatio >= 2 then 1 else 0;
def trinOverlyBullish = if trinRatio <= 0.5 then 1 else 0;
AddLabel(yes, "$TRIN: "+trinRatio, if trinOverlyBearish then color.green else if trinOverlyBullish then color.red else color.gray);

def pcallRatio = Round(SimpleMovingAvg(close(symbol="$PCALL"),10),2);
def pcallOverlyBearish = if pcallRatio >= 1 then 1 else 0;
def pcallOverlyBullish = if pcallratio <= 0.85 then 1 else 0;
AddLabel(yes, "$PCALL: "+pcallRatio, if pcallOverlyBearish then color.green else if pcallOverlyBullish then color.red else color.gray);

#current candle Buy/Sell strength labels
#AddLabel(if ShowBuySellStrength then 1 else 0, " ", Color.black);
#AddLabel(if ShowBuySellStrength then 1 else 0, "1", Color.GRAY);
AddLabel(if ShowBuySellStrength then 1 else 0, "Sell " + Round(SellStr, 2) + "%", if SellStr > BuyStr then Color.RED else Color.DARK_RED);
AddLabel(if ShowBuySellStrength then 1 else 0, "Buy " + Round(BuyStr, 2) + "%", if BuyStr > SellStr then Color.GREEN else Color.DARK_GREEN);
 

Similar threads

Not the exact question you're looking for?

Start a new thread and receive assistance from our community.

87k+ Posts
207 Online
Create Post

Similar threads

Similar threads

The Market Trading Game Changer

Join 2,500+ subscribers inside the useThinkScript VIP Membership Club
  • Exclusive indicators
  • Proven strategies & setups
  • Private Discord community
  • ‘Buy The Dip’ signal alerts
  • Exclusive members-only content
  • Add-ons and resources
  • 1 full year of unlimited support

Frequently Asked Questions

What is useThinkScript?

useThinkScript is the #1 community of stock market investors using indicators and other tools to power their trading strategies. Traders of all skill levels use our forums to learn about scripting and indicators, help each other, and discover new ways to gain an edge in the markets.

How do I get started?

We get it. Our forum can be intimidating, if not overwhelming. With thousands of topics, tens of thousands of posts, our community has created an incredibly deep knowledge base for stock traders. No one can ever exhaust every resource provided on our site.

If you are new, or just looking for guidance, here are some helpful links to get you started.

What are the benefits of VIP Membership?
VIP members get exclusive access to these proven and tested premium indicators: Buy the Dip, Advanced Market Moves 2.0, Take Profit, and Volatility Trading Range. In addition, VIP members get access to over 50 VIP-only custom indicators, add-ons, and strategies, private VIP-only forums, private Discord channel to discuss trades and strategies in real-time, customer support, trade alerts, and much more. Learn all about VIP membership here.
How can I access the premium indicators?
To access the premium indicators, which are plug and play ready, sign up for VIP membership here.
Back
Top