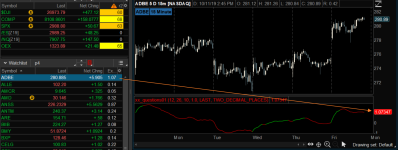
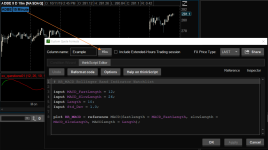
Here is a MACD indicator for ThinkorSwim. It uses a color coded MACD line to show changes. There is a moving average of the MACD signal line. And MACD bands to show volatility. The signal would be the cross of MACD (Green/RED) and signal line (White). A photo is also below to give tips on trading the indicator. The lengths can be adjusted to suit your trading. (Since the below photo zero line was added)

Original post is below with updated standard code.

Any questions just ask.
Here is the code. Code updated to current version:
Update to show versatility of the study to fit different trading styles. Will include shares to each variation but same can be accomplished by changing the inputs. Added a zero line.
Standard MACD 12,26,9 BB length 20. https://tos.mx/X1IBznK
Short term MACD 6, 13, 6 BB length 5. https://tos.mx/tpa1Ek8
Long term MACD 48, 104, 36 BB length 20. https://tos.mx/iUs5wqK
Original post is below with updated standard code.
Any questions just ask.
Here is the code. Code updated to current version:
Code:
#
# Ultimate MACD by Horserider 8/30/2019
# Standard version
# Also have short and long term versions. Can accomplish all three by just adjusting inputs to fit your trading style.
# Standard MACD 12,26,9 BB length 20.
# Short term MACD 6, 13, 6 BB length 5.
# Long term MACD 48, 104, 36 BB length 20.
# Added zero line on suggestion of Ahmar824 1/12/2019.

declare lower;
input fastLength = 12;
input slowLength = 26;
input MACDLength = 9;
input AverageTypeMACD = {SMA, default EMA, Wilders};

input price = close;
input displace = 0;

def MACD_Data = MACD(fastLength = fastLength, slowLength = slowLength, MACDLength = MACDLength);
plot MACD_Line = MACD_Data;

MACD_Line.DefineColor("Up", Color.GREEN);
MACD_Line.DefineColor("Down", Color.RED);
MACD_Line.DefineColor("Even", Color.WHITE);
MACD_Line.AssignValueColor(if MACD_Line > MACD_Line[1] then MACD_Line.Color("Up") else (if MACD_Line == MACD_Line[1] then MACD_Line.Color("Even") else MACD_Line.Color("Down")));
MACD_Line.SetLineWeight(3);

plot zero = 0;
zero.setDefaultColor(color.LIGHT_ORANGE);
zero.setLineWeight (1) ;

def Value;
plot Avg;
switch (AverageTypeMACD) {
case SMA:
    Value = Average(price, fastLength) - Average(price, slowLength);
    Avg = Average(Value, MACDLength);
case EMA:
    Value = ExpAverage(price, fastLength) - ExpAverage(price, slowLength);
    Avg = ExpAverage(Value, MACDLength);

case Wilders:
    Value = WildersAverage(price, fastLength) - WildersAverage(price, slowLength);
    Avg = ExpAverage(Value, MACDLength);
}
Avg.SetDefaultColor(Color.WHITE);


#plot BB;
#Bollinger BandsSMA,EMA
input AverageTypeBB = {default SMA, EMA, HMA};
input displaceBB = 0;
input lengthBB = 20;
input Num_Dev_Dn = -2.0;
input Num_Dev_up = 2.0;

plot upperBand;
plot lowerBand;
def midline;

switch (AverageTypeBB) {
case SMA:
    upperBand = reference BollingerBands(MACD_Line, displaceBB, lengthBB, Num_Dev_Dn, Num_Dev_up).UpperBand;
    lowerBand = reference BollingerBands(MACD_Line, displaceBB, lengthBB, Num_Dev_Dn, Num_Dev_up).LowerBand;
    midline   = reference BollingerBands(MACD_Line, displaceBB, lengthBB, Num_Dev_Dn, Num_Dev_up).Midline;
case EMA:
    upperBand = reference BollingerBands(MACD_Line, displaceBB, lengthBB, Num_Dev_Dn, Num_Dev_up, averageType = AverageType.EXPONENTIAL).UpperBand;
    lowerBand = reference BollingerBands(MACD_Line, displaceBB, lengthBB, Num_Dev_Dn, Num_Dev_up, averageType = AverageType.EXPONENTIAL).LowerBand;
    midline   = reference BollingerBands(MACD_Line, displaceBB, lengthBB, Num_Dev_Dn, Num_Dev_up, averageType = AverageType.EXPONENTIAL).Midline;
case HMA:
    upperBand = reference BollingerBands(MACD_Line, displaceBB, lengthBB, Num_Dev_Dn, Num_Dev_up, averageType = AverageType.EXPONENTIAL).UpperBand;
    lowerBand = reference BollingerBands(MACD_Line, displaceBB, lengthBB, Num_Dev_Dn, Num_Dev_up, averageType = AverageType.EXPONENTIAL).LowerBand;
    midline   = reference BollingerBands(MACD_Line, displaceBB, lengthBB, Num_Dev_Dn, Num_Dev_up, averageType = AverageType.EXPONENTIAL).Midline;
}

upperBand.SetDefaultColor(Color.GRAY);
upperBand.DefineColor("Up", Color.CYAN);
upperBand.DefineColor("Down", Color.PINK);
upperBand.DefineColor("Even", Color.GRAY);
upperBand.AssignValueColor(if upperBand > upperBand[1] and lowerBand < lowerBand[1] then upperBand.Color("Up") else (if upperBand < upperBand[1] and lowerBand > lowerBand[1] then upperBand.Color("Down") else upperBand.Color("Even")));
upperBand.SetLineWeight(2);

lowerBand.SetDefaultColor(Color.GRAY);
lowerBand.DefineColor("Up", Color.CYAN);
lowerBand.DefineColor("Down", Color.PINK);
lowerBand.DefineColor("Even", Color.GRAY);
lowerBand.AssignValueColor(if upperBand > upperBand[1] and lowerBand < lowerBand[1] then upperBand.Color("Up") else (if upperBand < upperBand[1] and lowerBand > lowerBand[1] then upperBand.Color("Down") else upperBand.Color("Even")));

plot midline1 = midline;
Update to show versatility of the study to fit different trading styles. Will include shares to each variation but same can be accomplished by changing the inputs. Added a zero line.
Standard MACD 12,26,9 BB length 20. https://tos.mx/X1IBznK
Short term MACD 6, 13, 6 BB length 5. https://tos.mx/tpa1Ek8
Long term MACD 48, 104, 36 BB length 20. https://tos.mx/iUs5wqK
Attachments
Last edited:


