Ultimate MACD Indicator for ThinkorSwim

horserider

Well-known member
VIP
Here is a MACD indicator for ThinkorSwim. It uses a color coded MACD line to show changes. There is a moving average of the MACD signal line. And MACD bands to show volatility. The signal would be the cross of MACD (Green/RED) and signal line (White). A photo is also below to give tips on trading the indicator. The lengths can be adjusted to suit your trading. (Since the below photo zero line was added)

Image-9999999999.jpg


Original post is below with updated standard code.

F8KbJxf.jpg


Any questions just ask.

Here is the code. Code updated to current version:

Code:
#
# Ultimate MACD by Horserider 8/30/2019
# Standard version
# Also have short and long term versions. Can accomplish all three by just adjusting inputs to fit your trading style.
# Standard MACD 12,26,9 BB length 20.
# Short term MACD 6, 13, 6 BB length 5.
# Long term MACD 48, 104, 36 BB length 20.
# Added zero line on suggestion of Ahmar824 1/12/2019.

declare lower;
input fastLength = 12;
input slowLength = 26;
input MACDLength = 9;
input AverageTypeMACD = {SMA, default EMA, Wilders};

input price = close;
input displace = 0;

def MACD_Data = MACD(fastLength = fastLength, slowLength = slowLength, MACDLength = MACDLength);
plot MACD_Line = MACD_Data;

MACD_Line.DefineColor("Up", Color.GREEN);
MACD_Line.DefineColor("Down", Color.RED);
MACD_Line.DefineColor("Even", Color.WHITE);
MACD_Line.AssignValueColor(if MACD_Line > MACD_Line[1] then MACD_Line.Color("Up") else (if MACD_Line == MACD_Line[1] then MACD_Line.Color("Even") else MACD_Line.Color("Down")));
MACD_Line.SetLineWeight(3);

plot zero = 0;
zero.setDefaultColor(color.LIGHT_ORANGE);
zero.setLineWeight (1) ;

def Value;
plot Avg;
switch (AverageTypeMACD) {
case SMA:
    Value = Average(price, fastLength) - Average(price, slowLength);
    Avg = Average(Value, MACDLength);
case EMA:
    Value = ExpAverage(price, fastLength) - ExpAverage(price, slowLength);
    Avg = ExpAverage(Value, MACDLength);

case Wilders:
    Value = WildersAverage(price, fastLength) - WildersAverage(price, slowLength);
    Avg = ExpAverage(Value, MACDLength);
}
Avg.SetDefaultColor(Color.WHITE);


#plot BB;
#Bollinger BandsSMA,EMA
input AverageTypeBB = {default SMA, EMA, HMA};
input displaceBB = 0;
input lengthBB = 20;
input Num_Dev_Dn = -2.0;
input Num_Dev_up = 2.0;

plot upperBand;
plot lowerBand;
def midline;

switch (AverageTypeBB) {
case SMA:
    upperBand = reference BollingerBands(MACD_Line, displaceBB, lengthBB, Num_Dev_Dn, Num_Dev_up).UpperBand;
    lowerBand = reference BollingerBands(MACD_Line, displaceBB, lengthBB, Num_Dev_Dn, Num_Dev_up).LowerBand;
    midline   = reference BollingerBands(MACD_Line, displaceBB, lengthBB, Num_Dev_Dn, Num_Dev_up).Midline;
case EMA:
    upperBand = reference BollingerBands(MACD_Line, displaceBB, lengthBB, Num_Dev_Dn, Num_Dev_up, averageType = AverageType.EXPONENTIAL).UpperBand;
    lowerBand = reference BollingerBands(MACD_Line, displaceBB, lengthBB, Num_Dev_Dn, Num_Dev_up, averageType = AverageType.EXPONENTIAL).LowerBand;
    midline   = reference BollingerBands(MACD_Line, displaceBB, lengthBB, Num_Dev_Dn, Num_Dev_up, averageType = AverageType.EXPONENTIAL).Midline;
case HMA:
    upperBand = reference BollingerBands(MACD_Line, displaceBB, lengthBB, Num_Dev_Dn, Num_Dev_up, averageType = AverageType.EXPONENTIAL).UpperBand;
    lowerBand = reference BollingerBands(MACD_Line, displaceBB, lengthBB, Num_Dev_Dn, Num_Dev_up, averageType = AverageType.EXPONENTIAL).LowerBand;
    midline   = reference BollingerBands(MACD_Line, displaceBB, lengthBB, Num_Dev_Dn, Num_Dev_up, averageType = AverageType.EXPONENTIAL).Midline;
}

upperBand.SetDefaultColor(Color.GRAY);
upperBand.DefineColor("Up", Color.CYAN);
upperBand.DefineColor("Down", Color.PINK);
upperBand.DefineColor("Even", Color.GRAY);
upperBand.AssignValueColor(if upperBand > upperBand[1] and lowerBand < lowerBand[1] then upperBand.Color("Up") else (if upperBand < upperBand[1] and lowerBand > lowerBand[1] then upperBand.Color("Down") else upperBand.Color("Even")));
upperBand.SetLineWeight(2);

lowerBand.SetDefaultColor(Color.GRAY);
lowerBand.DefineColor("Up", Color.CYAN);
lowerBand.DefineColor("Down", Color.PINK);
lowerBand.DefineColor("Even", Color.GRAY);
lowerBand.AssignValueColor(if upperBand > upperBand[1] and lowerBand < lowerBand[1] then upperBand.Color("Up") else (if upperBand < upperBand[1] and lowerBand > lowerBand[1] then upperBand.Color("Down") else upperBand.Color("Even")));

plot midline1 = midline;

Update to show versatility of the study to fit different trading styles. Will include shares to each variation but same can be accomplished by changing the inputs. Added a zero line.

Standard MACD 12,26,9 BB length 20. https://tos.mx/X1IBznK
Short term MACD 6, 13, 6 BB length 5. https://tos.mx/tpa1Ek8
Long term MACD 48, 104, 36 BB length 20. https://tos.mx/iUs5wqK
 

Attachments

  • F8KbJxf.jpg
    F8KbJxf.jpg
    135.8 KB · Views: 1,966
Last edited:

Join useThinkScript to post your question to a community of 21,000+ developers and traders.

Good Evening everyone,

I am new to this forum, feel very fortunate to have found all of you. I loaded this into my TOS studies, and that was successful. The MACD lines are very compressed in the lower study window. When I zoom in they become more compressed. Any help would be very much appreciated.
 
@Lambert58 You have 2 studies in the same study panel. Many times this will make the scaling do crazy things. If you want to use both of those studies put each in it's own lower panel.
 
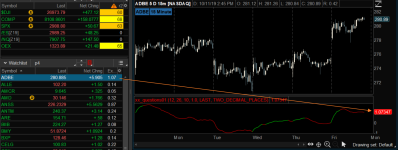
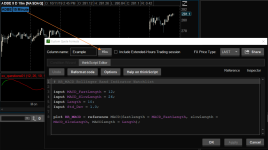
If you could help me creating a watchlist column by using the Macd BB Indicator for tos. I would like to get the last dot to display a numerical value and display the color of the dot into a watchlist. but it has to match as close to the number on the right side of the indicator. thanks I wish I had your skill to make indicators.

Here is what I tried but I cant get the numerical value to match up with the with the lower graph number on the rightside of the indicator. thanks

Code:
# BB_MACD Bollinger Band Indicator Watchlist

input MACD_FastLength = 12;
input MACD_SlowLength = 26;
input Length = 10;
Input Std_Dev = 1.0;

rec BB_MACD = reference MACD(fastlength = MACD_FastLength, slowlength = MACD_SlowLength, MACDlength = Length);
def avg = ExpAverage(BB_MACD, Length);
def sdev = stdev(data = BB_MACD, length = Length);
#def Lower_Band = avg - Std_Dev * sdev;
#def Upper_Band = avg + Std_Dev * sdev;

plot bbmacd = BB_MACD;
def upperband = avg + Std_Dev * sdev;
def lowerband = avg - Std_Dev * sdev;
###################################### added 09032019
BBMACD.assignValueColor(if BB_MACD > upperband then color.green else if BB_MACD < LowerBand then color.red else color.red);
#BBMACD.assignValueColor(if ( BB_MACD[1]> 0.00) then color.Green else if ( BB_MACD[1] < 0.00) then color.RED else color.RED);
input Type = PriceType.LAST;
def Lastprice =(close(priceType = Type));
assignBackgroundColor(if lastprice then color.black else color.black);#added 70419
def CurrentBar = (if !isNaN(close) and isNaN(close[-1])
then barNumber()
                 else double.nan); #added 090419

def LastBar = if isNaN(close[-1]) and !isNaN(close) then barNumber() else LastBar[1]; #added 100419
def priceLine = if isNan(close[-1]) and !isNAN(close) then close else priceLine[1];#added 100419
input Dec_Places = numberformat.TWO_DECIMAL_PLACES;#added 100419
 
@HDP

I pasted your script into the watchlist column and it worked perfectly. The only change I made was to remove the excess code that had nothing to do with calculating bbmacd.

I believe the problem may be that you didn't match the time frame of your chart to the watchlist. Make certain that both match. Also, either check or uncheck the "extended session" box as necessary.

z7Uoj0Q.png


7fwXOLF.png
 

Attachments

  • z7Uoj0Q.png
    z7Uoj0Q.png
    204.4 KB · Views: 828
  • 7fwXOLF.png
    7fwXOLF.png
    180.6 KB · Views: 908
@HighBredCloud I'm glad to hear the Breakout signals are working perfectly :) Unfortunately, the coding of the DSS Line and the Moving Averages is more problematic...Below is a screenshot of what the DSS Line looks like currently...

a.png


I am currently at a loss to explain why the DSS Line is plotting the way it is...I will sleep on it and hopefully have an answer in the morning...I would welcome any thoughts or suggestions from the community regarding this situation...

Code:
# MACD with a more Normal Distribution
# Mobius
# V01.09.2015
#Hint: Plots a Gaussian distribution. If Normal Distribution is met, then at minimum, 68.2% of the close values should be inside a One Standard Deviation Envelope and 95.4% of the close values should be inside a 2 Standard Deviation Envelope.

# V11.01.2019 - netarchitech added standard TOS Breakout Signals per HighBredCloud request

declare lower;

input fastLength = 12;
input slowLength = 26;
input MACDLength = 9;
input showBreakoutSignals = no;

# Four Pole Filter
script g{
input length = 4;
input betaDev = 2;
input price = OHLC4;
def c;
def w;
def beta;
def alpha;
def G;
c = price;
w = (2 * Double.Pi / length);
beta = (1 - Cos(w)) / (Power(1.414, 2.0 / betaDev) - 1 );
alpha = (-beta + Sqrt(beta * beta + 2 * beta));
G = Power(alpha, 4) * c +
4 * (1 – alpha) * G[1] – 6 * Power( 1 - alpha, 2 ) * G[2] +
4 * Power( 1 - alpha, 3 ) * G[3] - Power( 1 - alpha, 4 ) * G[4];
plot Line = G;
}
# Modified MACD
plot Value = g(length = fastLength) - g(length = slowLength);
plot Avg = g(price = Value, length = MACDLength);
plot Diff = Value - Avg;
plot ZeroLine = 0;

Value.SetDefaultColor(GetColor(1));
Avg.SetDefaultColor(GetColor(8));
Diff.SetDefaultColor(GetColor(5));
Diff.SetPaintingStrategy(PaintingStrategy.HISTOGRAM);
Diff.SetLineWeight(3);
Diff.DefineColor("Positive and Up", Color.GREEN);
Diff.DefineColor("Positive and Down", Color.DARK_GREEN);
Diff.DefineColor("Negative and Down", Color.RED);
Diff.DefineColor("Negative and Up", Color.DARK_RED);
Diff.AssignValueColor(if Diff >= 0 then if Diff > Diff[1] then Diff.color("Positive and Up") else Diff.color("Positive and Down") else if Diff < Diff[1] then Diff.color("Negative and Down") else Diff.color("Negative and Up"));
ZeroLine.SetDefaultColor(GetColor(0));

plot UpSignal = if Diff crosses above ZeroLine then ZeroLine else Double.NaN;
plot DownSignal = if Diff crosses below ZeroLine then ZeroLine else Double.NaN;

UpSignal.SetHiding(!showBreakoutSignals);
DownSignal.SetHiding(!showBreakoutSignals);

UpSignal.SetDefaultColor(Color.UPTICK);
UpSignal.SetPaintingStrategy(PaintingStrategy.ARROW_UP);
DownSignal.SetDefaultColor(Color.DOWNTICK);
DownSignal.SetPaintingStrategy(PaintingStrategy.ARROW_DOWN);

# DSS Line
input N2_Period = 21;
input R2_Period = 5;

def Ln2 = Lowest(low, N2_Period);
def Hn2 = Highest(high, N2_Period);
def Y2 = ((close - Ln2)/(Hn2 - Ln2)) * 100;
def X2 = ExpAverage(Y2, R2_period);

def Lxn = Lowest(x2, n2_period);
def Hxn = Highest(x2, n2_period);
def DSS = ((X2 - Lxn)/(Hxn - Lxn)) * 100;

def DSSb = ExpAverage(Dss, R2_period);
#DSSb.setdefaultColor(Color.GREEN);

plot DSSsignal = DSSb[1];
DSSsignal.AssignValueColor(if DSSb>DSSsignal then Color.Green else Color.Red);
 
@netarchitech This MACD is working better than expected...I am getting the entry signal a bar sooner on a 5 min chart before the cross over happens...I kept the standard settings of 12, 26, 9 on the 5m timeframe. I kept the AA setting at default 0.1...So far this has been a very good indication of pull backs...Really cool indicator to go along with TMO and the SMI with DSS line. You hit a winner on this one...Can't wait to see more updates to this. Will continue testing variety of other stocks and time frames on it. (This message did not post earlier)
 

Normalized MACD Example Study

There was some discussion in one of the sub forums regarding how to normalize plots. Rather than post it there, thought it might make it easier for future searches to find it here. Based on a normalizePlot function Mobius wrote several years ago, you can use that to normalize plots to whatever scale you like, e.g. 0 to 100, -100 to 100, etc.

Here is an example on how to normalize the MACD on a scale from -100 to 100.

First determine what data you're going to plot. In the example below I have chosen to plot the MACDAvg line. Place all the code into a script() routine, in my example I call this MACDScr(). Then run this through Mobius normalizePlot function and slap on whatever lipstick you need

Code:
# Normalized MACD
# tomsk
# 11.16.2019

declare lower;

input fastLength = 12;
input slowLength = 26;
input MACDLength = 9;
input OverBought = 80;
input OverSold = -80;

script normalizePlot {
    input data = close;
    input newRngMin =  -1;
    input newRngMax = 1;
    def hhData = HighestAll( data );
    def llData = LowestAll( data );
    plot nr = ((( newRngMax - newRngMin ) * ( data - llData )) / ( hhData - llData )) + newRngMin;
}

script MACDScr {
   input fastLength = 13;
   input slowLength = 21;
   input MACDLength  =  8;
   input data = close;
   def Value = ExpAverage(data, fastLength) - ExpAverage(data, slowLength);
   plot MACDAvg  = ExpAverage(Value, MACDLength);
}

plot MACDX = normalizePlot(MACDScr("fastLength" = fastLength, "slowLength" = slowLength, "MACDLength" = MACDLength, "data" = close), -100, 100);

plot OS = if !isNaN(close) then OverSold else Double.NaN;
OS.SetPaintingStrategy(PaintingStrategy.Line);
OS.SetLineWeight(2);
OS.SetDefaultColor(Color.Cyan);

plot OB = if !IsNaN(close) then OverBought else Double.NaN;
OB.SetPaintingStrategy(PaintingStrategy.Line);
OB.SetLineWeight(2);
OB.SetDefaultColor(Color.Cyan);

plot MID = if !isNaN(close) then 0 else Double.NaN;
MID.SetPaintingStrategy(PaintingStrategy.Dashes);
MID.SetLineWeight(2);
MID.SetDefaultColor(Color.Orange);

MACDX.SetPaintingStrategy(PaintingStrategy.Line);
MACDX.SetLineWeight(1);
MACDX.AssignValueColor(if MACDX >= 50 then if MACDX > MACDX[1] then Color.Light_Green else Color.Light_Red else if MACDX < MACDX[1] then Color.Light_Red else Color.Light_Green);
AddCloud(MACDX, MID, Color.Light_Green, Color.Light_Red);
# End Normalized MACD
 
Hello Horserider, The MACD with Bollinger bands is very intriguing. I can't wait to try it in my ToS. Is it possible for you to create a shareable link ? If not, can you tell me how to get it into my ToS ? Thank you, SFR
 
@Ahmar824 Good suggestion. Zero line added. Everyone code has been updated to add a zero line to show overall strength or weakness of MACD.
Update to the new code or add this to your study if you want a zero line.

plot zero = 0;
zero.setDefaultColor(color.LIGHT_ORANGE);
zero.setLineWeight (1) ;
 
This is cool. Can you possibly add histogram crossover arrows like the default MACD has? I know this doesn't have a histogram but I thought maybe it could be added in the code, and then hidden, to allow the histogram crossover arrows to appear as another layer of confirmation. Thanks!
 
For what it is worth. Good luck .

Code:
# Ultimate MACD by Horserider 8/30/2019
# Standard version
# Also have short and long term versions. Can accomplish all three by just adjusting inputs to fit your trading style.
# Standard MACD 12,26,9 BB length 20.
# Short term MACD 6, 13, 6 BB length 5.
# Long term MACD 48, 104, 36 BBlength 20.
# Added zero line on suggestion of Ahmar824 1/12/2019.
# Added TRIX histogram 3/1/2019


declare lower;
input fastLength = 6;
input slowLength = 13;
input MACDLength = 6;
input AverageTypeMACD = {SMA, default EMA,  Wilders};

input price = close;
input displace = 0;

def MACD_Data = MACD(fastLength = fastLength, slowLength = slowLength, MACDLength = MACDLength);
plot MACD_Line = MACD_Data;

MACD_Line.DefineColor("Up", Color.GREEN);
MACD_Line.DefineColor("Down", Color.RED);
MACD_Line.DefineColor("Even", Color.WHITE);
MACD_Line.AssignValueColor(if MACD_Line > MACD_Line[1] then MACD_Line.Color("Up") else (if MACD_Line == MACD_Line[1] then MACD_Line.Color("Even") else MACD_Line.Color("Down")));
MACD_Line.SetLineWeight(3);

plot zero = 0;
zero.setDefaultColor(color.LIGHT_ORANGE);
zero.setLineWeight (1) ;

def Value;
plot Avg;
switch (AverageTypeMACD) {
case SMA:
    Value = Average(price, fastLength) - Average(price, slowLength);
    Avg = Average(Value, MACDLength);
case EMA:
    Value = ExpAverage(price, fastLength) - ExpAverage(price, slowLength);
    Avg = ExpAverage(Value, MACDLength);

case Wilders:
    Value = WildersAverage(price, fastLength) - WildersAverage(price, slowLength);
    Avg = ExpAverage(Value, MACDLength);
}
Avg.SetDefaultColor(Color.WHITE);


#plot BB;
#Bollinger BandsSMA,EMA
input AverageTypeBB = {default SMA, EMA, HMA};
input displaceBB = 0;
input lengthBB = 5;
input Num_Dev_Dn = -2.0;
input Num_Dev_up = 2.0;

plot upperBand;
plot lowerBand;
def midline;

switch (AverageTypeBB) {
case SMA:
    upperBand = reference BollingerBands(MACD_Line, displaceBB, lengthBB, Num_Dev_Dn, Num_Dev_up).UpperBand;
    lowerBand = reference BollingerBands(MACD_Line, displaceBB, lengthBB, Num_Dev_Dn, Num_Dev_up).LowerBand;
    midline   = reference BollingerBands(MACD_Line, displaceBB, lengthBB, Num_Dev_Dn, Num_Dev_up).Midline;
case EMA:
    upperBand = reference BollingerBands(MACD_Line, displaceBB, lengthBB, Num_Dev_Dn, Num_Dev_up, averageType = AverageType.EXPONENTIAL).UpperBand;
    lowerBand = reference BollingerBands(MACD_Line, displaceBB, lengthBB, Num_Dev_Dn, Num_Dev_up, averageType = AverageType.EXPONENTIAL).LowerBand;
    midline   = reference BollingerBands(MACD_Line, displaceBB, lengthBB, Num_Dev_Dn, Num_Dev_up, averageType = AverageType.EXPONENTIAL).Midline;
case HMA:
    upperBand = reference BollingerBands(MACD_Line, displaceBB, lengthBB, Num_Dev_Dn, Num_Dev_up, averageType = AverageType.EXPONENTIAL).UpperBand;
    lowerBand = reference BollingerBands(MACD_Line, displaceBB, lengthBB, Num_Dev_Dn, Num_Dev_up, averageType = AverageType.EXPONENTIAL).LowerBand;
    midline   = reference BollingerBands(MACD_Line, displaceBB, lengthBB, Num_Dev_Dn, Num_Dev_up, averageType = AverageType.EXPONENTIAL).Midline;
}

upperBand.SetDefaultColor(Color.GRAY);
upperBand.DefineColor("Up", Color.CYAN);
upperBand.DefineColor("Down", Color.PINK);
upperBand.DefineColor("Even", Color.GRAY);
upperBand.AssignValueColor(if upperBand > upperBand[1] and lowerBand < lowerBand[1] then upperBand.Color("Up") else (if upperBand < upperBand[1] and lowerBand > lowerBand[1] then upperBand.Color("Down") else upperBand.Color("Even")));
upperBand.SetLineWeight(2);

lowerBand.SetDefaultColor(Color.GRAY);
lowerBand.DefineColor("Up", Color.CYAN);
lowerBand.DefineColor("Down", Color.PINK);
lowerBand.DefineColor("Even", Color.GRAY);
lowerBand.AssignValueColor(if upperBand > upperBand[1] and lowerBand < lowerBand[1] then upperBand.Color("Up") else (if upperBand < upperBand[1] and lowerBand > lowerBand[1] then upperBand.Color("Down") else upperBand.Color("Even")));

plot midline1 = midline;

## Trix

input lengthtrix = 9;
input colorNormLength = 14;

input signalLength = 3;

def tr = ExpAverage(ExpAverage(ExpAverage(Log(price), lengthtrix), lengthtrix), lengthtrix);

plot TRIX = (tr - tr[1]) * 10000;
plot Signal = ExpAverage(TRIX, signalLength);
plot ZeroLine = 0;
TRIX.SetPaintingStrategy(PaintingStrategy.HISTOGRAM);
TRIX.DefineColor("Highest", Color.LIGHT_GREEN);
TRIX.DefineColor("Lowest", Color.LIGHT_RED);
TRIX.AssignNormGradientColor(colorNormLength, TRIX.color("Lowest"), TRIX.color("Highest"));
Signal.setDefaultColor(GetColor(3));
ZeroLine.SetDefaultColor(GetColor(5));
 
@horserider hey what do the blue gray and pink mean on bollingerbands? does blue mean the bands are expanding gray sideways and pink getting tighter? and if so how do you read that?
 
@Aliikhatami When bands are expanding ( upper is rising and lower is falling) the color is cyan. Volatility is increasing. When bands are staying same distance apart the color is gray. Could be sloped up or down but bands are moving the same direction and staying basically the same distance apart.
Pink is the bands moving closer together, squeezing. The longer the squeeze period the more likely a volatile period will follow.
 
HMSN9Lb.png


Code:
#
# Grimes Modified MACD + Highest / Lowest Momentum Indicator
# Grimes_Modified_MACD_HILO_GMACDHILO
#
# Author: Kory Gill, @korygill
#
# Version History :
# 20191007-KG - Created.
#
# Assembled by Kory Gill for BenTen at useThinkScript.com
# Original idea: https://www.tradingview.com/script/eVnQUwKW-Grimes-Modified-MACD-Supply-Demand/
#

declare lower;
declare once_per_bar;

input FastLength = 3;
input SlowLength = 10;
input SignalLength = 16;
input HighestLength = 20; #Hint HighestLength: Highest MACD Reading Within N Bars
input LowestLength = 20; #Hint LowestLength: Lowest MACD Reading Within N Bars

def vClose = close;
def vHigh = high;
def vLow = low;
def bn = BarNumber();
def nan = double.NaN;

def fastMA = MovingAverage(AverageType.SIMPLE, vClose, fastLength);
def slowMA = MovingAverage(AverageType.SIMPLE, vClose, slowLength);
def macd = fastMA - slowMA;
def signal = MovingAverage(AverageType.SIMPLE, macd, signalLength);
def higher = MovingAverage(AverageType.SIMPLE, Highest(macd, HighestLength), HighestLength);
def lower = MovingAverage(AverageType.SIMPLE, Lowest(macd, LowestLength), HighestLength);
def macdAbove = if macd > higher then macd else nan; #macdAbove[1];
def macdBelow = if macd < lower then macd else nan; #macdBelow[1];

plot zeroLine = 0;
plot pma = macdAbove;
plot pmb = macdBelow;
plot phi = higher;
plot plo = lower;
plot pmacd = macd;
plot psignal = signal;

zeroLine.SetDefaultColor(Color.White);
zeroLine.SetPaintingStrategy(PaintingStrategy.DASHES);
pmacd.SetDefaultColor(Color.Black);
psignal.SetDefaultColor(Color.Orange);
phi.SetDefaultColor(Color.Cyan);
plo.SetDefaultColor(Color.Cyan);
phi.SetPaintingStrategy(PaintingStrategy.DASHES);
plo.SetPaintingStrategy(PaintingStrategy.DASHES);

AddCloud(pma, phi, Color.Green, Color.Black);
AddCloud(pmb, plo, Color.Black, Color.Red);

# END - Grimes_Modified_MACD_HILO_GMACDHILO
 
@horserider I really like this indicator you've made. I'm hoping to run two questions by you. I imported the shared TOS links you provided, but a couple of the lines came out a different color for me, so I'm having trouble matching this up to the very helpful Tips Photo you provided. In your tips photo you show a Safe buy when the MACD crosses the SMA. In your photo is your arrow pointing to the white line or the brown line?

I'm struggling to figure out which is the SMA plot, because on mine they turned into different colors. Is the SMA line referring to the Avg plot or the midline1 plot? Just trying to figure out which one should be brown.

Photo in reference:

Thank you again!
 
@rovo Sorry for delayed rsponse.

AVG line is white line labeled SMA in your photo in post 54
midline is safe buy = orange line

Stages would be;
1. Break off outer band if following an outer band
2. Color change of MACD line
3. Cross AVG line
4. Cross midline

Main signal is cross of MACD and midline.
 

Similar threads

Not the exact question you're looking for?

Start a new thread and receive assistance from our community.

87k+ Posts
262 Online
Create Post

Similar threads

Similar threads

The Market Trading Game Changer

Join 2,500+ subscribers inside the useThinkScript VIP Membership Club
  • Exclusive indicators
  • Proven strategies & setups
  • Private Discord community
  • ‘Buy The Dip’ signal alerts
  • Exclusive members-only content
  • Add-ons and resources
  • 1 full year of unlimited support

Frequently Asked Questions

What is useThinkScript?

useThinkScript is the #1 community of stock market investors using indicators and other tools to power their trading strategies. Traders of all skill levels use our forums to learn about scripting and indicators, help each other, and discover new ways to gain an edge in the markets.

How do I get started?

We get it. Our forum can be intimidating, if not overwhelming. With thousands of topics, tens of thousands of posts, our community has created an incredibly deep knowledge base for stock traders. No one can ever exhaust every resource provided on our site.

If you are new, or just looking for guidance, here are some helpful links to get you started.

What are the benefits of VIP Membership?
VIP members get exclusive access to these proven and tested premium indicators: Buy the Dip, Advanced Market Moves 2.0, Take Profit, and Volatility Trading Range. In addition, VIP members get access to over 50 VIP-only custom indicators, add-ons, and strategies, private VIP-only forums, private Discord channel to discuss trades and strategies in real-time, customer support, trade alerts, and much more. Learn all about VIP membership here.
How can I access the premium indicators?
To access the premium indicators, which are plug and play ready, sign up for VIP membership here.
Back
Top