# https://www.tradingview.com/v/aM7pePxC/
#//@taufan_ganas
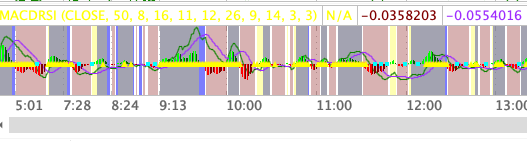
#indicator(title='Ultimate MACD')
# converted by Sam4Cok@Samer800 - 09/2023 - request form ww.usethinkscript.com member
declare lower;
input source = close;
input RSIstrength = 50;# (defval=50, title='RSI Strength Level', group=grp_1)
input fastLength = 8;# minval=1, title='MACD Fast Length', group=grp_2)
input slowLength = 16;# minval=1, title='MACD Slow Length', group=grp_2)
input signalLength = 11;# minval=1, title='MACD Signal Length', group=grp_2)
input fastLength1 = 12;#, minval=1, title='MACD Fast Length', group=grp_3)
input slowLength1 = 26;# minval=1, title='MACD Slow Length', group=grp_3)
input signalLength1 = 9;# minval=1, title='MACD Signal Length', group=grp_3)
input periodK = 14;# title='K', minval=1)
input periodD = 3;# title='D', minval=1)
input smoothK = 3;# title='Smooth', minval=1)
def na = Double.NaN;
def pos = Double.POSITIVE_INFINITY;
def neg = Double.NEGATIVE_INFINITY;
def fastMA = ExpAverage(source, fastLength);
def slowMA = ExpAverage(source, slowLength);
def macd = fastMA - slowMA;
def signal = Average(macd, signalLength);
def hist = macd - signal;
#//RSI Color
def rsivalue = rsi(Price = close,Length = 14);
def colorsi = rsivalue >= RSIstrength;
#//Plot RSI
plot rsiPlot = if colorsi then 0 else na;
rsiPlot.SetPaintingStrategy(PaintingStrategy.TRIANGLES);
rsiPlot.SetDefaultColor(Color.YELLOW);
#//Plot MACD
plot macdHist = hist;#, title='Histogram'
macdHist.SetLineWeight(4);
macdHist.SetPaintingStrategy(PaintingStrategy.HISTOGRAM);
macdHist.AssignValueColor(if hist >= 0 then if hist[1] < hist then Color.GREEN else Color.DARK_GREEN else
if hist[1] < hist then Color.DARK_RED else Color.RED);
plot sigLine = signal;#, color=color.new(color.red, 0), linewidth=1)
plot macLine = macd;#, color=color.new(color.blue, 0), linewidth=1)
sigLine.SetDefaultColor(GetColor(8));
macLine.SetDefaultColor(GetColor(1));
# 'SLOW MACD SETTINGS:'
def fastMA1 = ExpAverage(source, fastLength1);
def slowMA1 = ExpAverage(source, slowLength1);
def macd1 = fastMA1 - slowMA1;
def signal1 = Average(macd1, signalLength1);
AddCloud(if macd1 >= signal1 then pos else na, neg, Color.BLUE);
def intersection1 = macd >= signal;
def intersection2 = macd1 >= signal1;
AddCloud(if !intersection1 and !intersection2 then pos else na, neg, Color.DARK_RED);
AddCloud(if intersection2 then pos else na, neg, Color.BLUE);
AddCloud(if intersection1 then pos else na, neg, Color.YELLOW);
# //Stochastic
def k = StochasticFull(KPeriod = periodK, DPeriod = periodD, slowing_period = smoothK).FullK;
def d = StochasticFull(KPeriod = periodK, DPeriod = periodD, slowing_period = smoothK).FullD;
def stobull = Crosses(k, d, CrossingDirection.ABOVE) and k <= 20;# ? #3179f5 : na
def stobear = Crosses(d, k, CrossingDirection.ABOVE) and k >= 80;# ? #ff3b7d : na
plot CrossUp = if stobull then 0 else na;#, color=stobull, style=plot.style_cross, linewidth=4)
plot CrossDn = if stobear then 0 else na;#, color=stobear, style=plot.style_cross, linewidth=4)
CrossUp.SetDefaultColor(Color.CYAN);
CrossDn.SetDefaultColor(Color.MAGENTA);
CrossUp.SetPaintingStrategy(PaintingStrategy.SQUARES);
CrossDn.SetPaintingStrategy(PaintingStrategy.SQUARES);
#-- END of CODE