Fibonacci Zone Oscillator With MACD For ThinkOrSwim

jackaltr8s

New member
The author states:
Strategy and Use:
Blue column: Close in uptrend area, 4 supports, 0 resistance, ready to rally up.
Green column: Close in buyers area, 3 supports, 1 resistance, looking up.
Gray column: Close in center area 2 supports, 2 resistances, undecided.
Yellow column: Close in sellers area 1 support, 3 resistances, looking down.
Red column: Close in downtrend area, 0 support, 4 resistances, ready to rally down.
I use this indicator in a layout with three timeframes which I use for stock picking, I pick all stocks with a blue column in every timeframe, the indicator is so clear that I can flip through the 50 charts of my universe of high liquid European blue chips in 15 minutes to make a list of these stocks.
Because I use it in conjunction with KeltCOG I also gave it a ‘script sets lookback’ option which can be checked with a feedback label and switched off in the inputs.

The MACD histogram
I admire the MACD because it is spot on when predicting tops and bottoms. It is also the most sexy indictor in TA. Actually just the histogram is needed, so I don’t show the macd-line and the signal line. I use the same lookback for the slow-ma as for the columns, set the fast-ma to half and the signal-line to a third of the general lookback. Therefore I gave the lookback a minimum value of 6, so the signal gets at least a lookback of 2.
The histogram is plotted three times, first as a whitish area to provide a background, then the colums of the Fibzone Oscillator are plotted, then the histogram as a purple line, which contrasts nicely and then as a hardly visible brown histogram.
The input settings give the option to show columns and histogram separate or together.
Strategy and use:
I think about the columns as showing a ‘longer term chosen momentum’ and about the histogram as a ‘short term power momentum’. I use it as additional information.
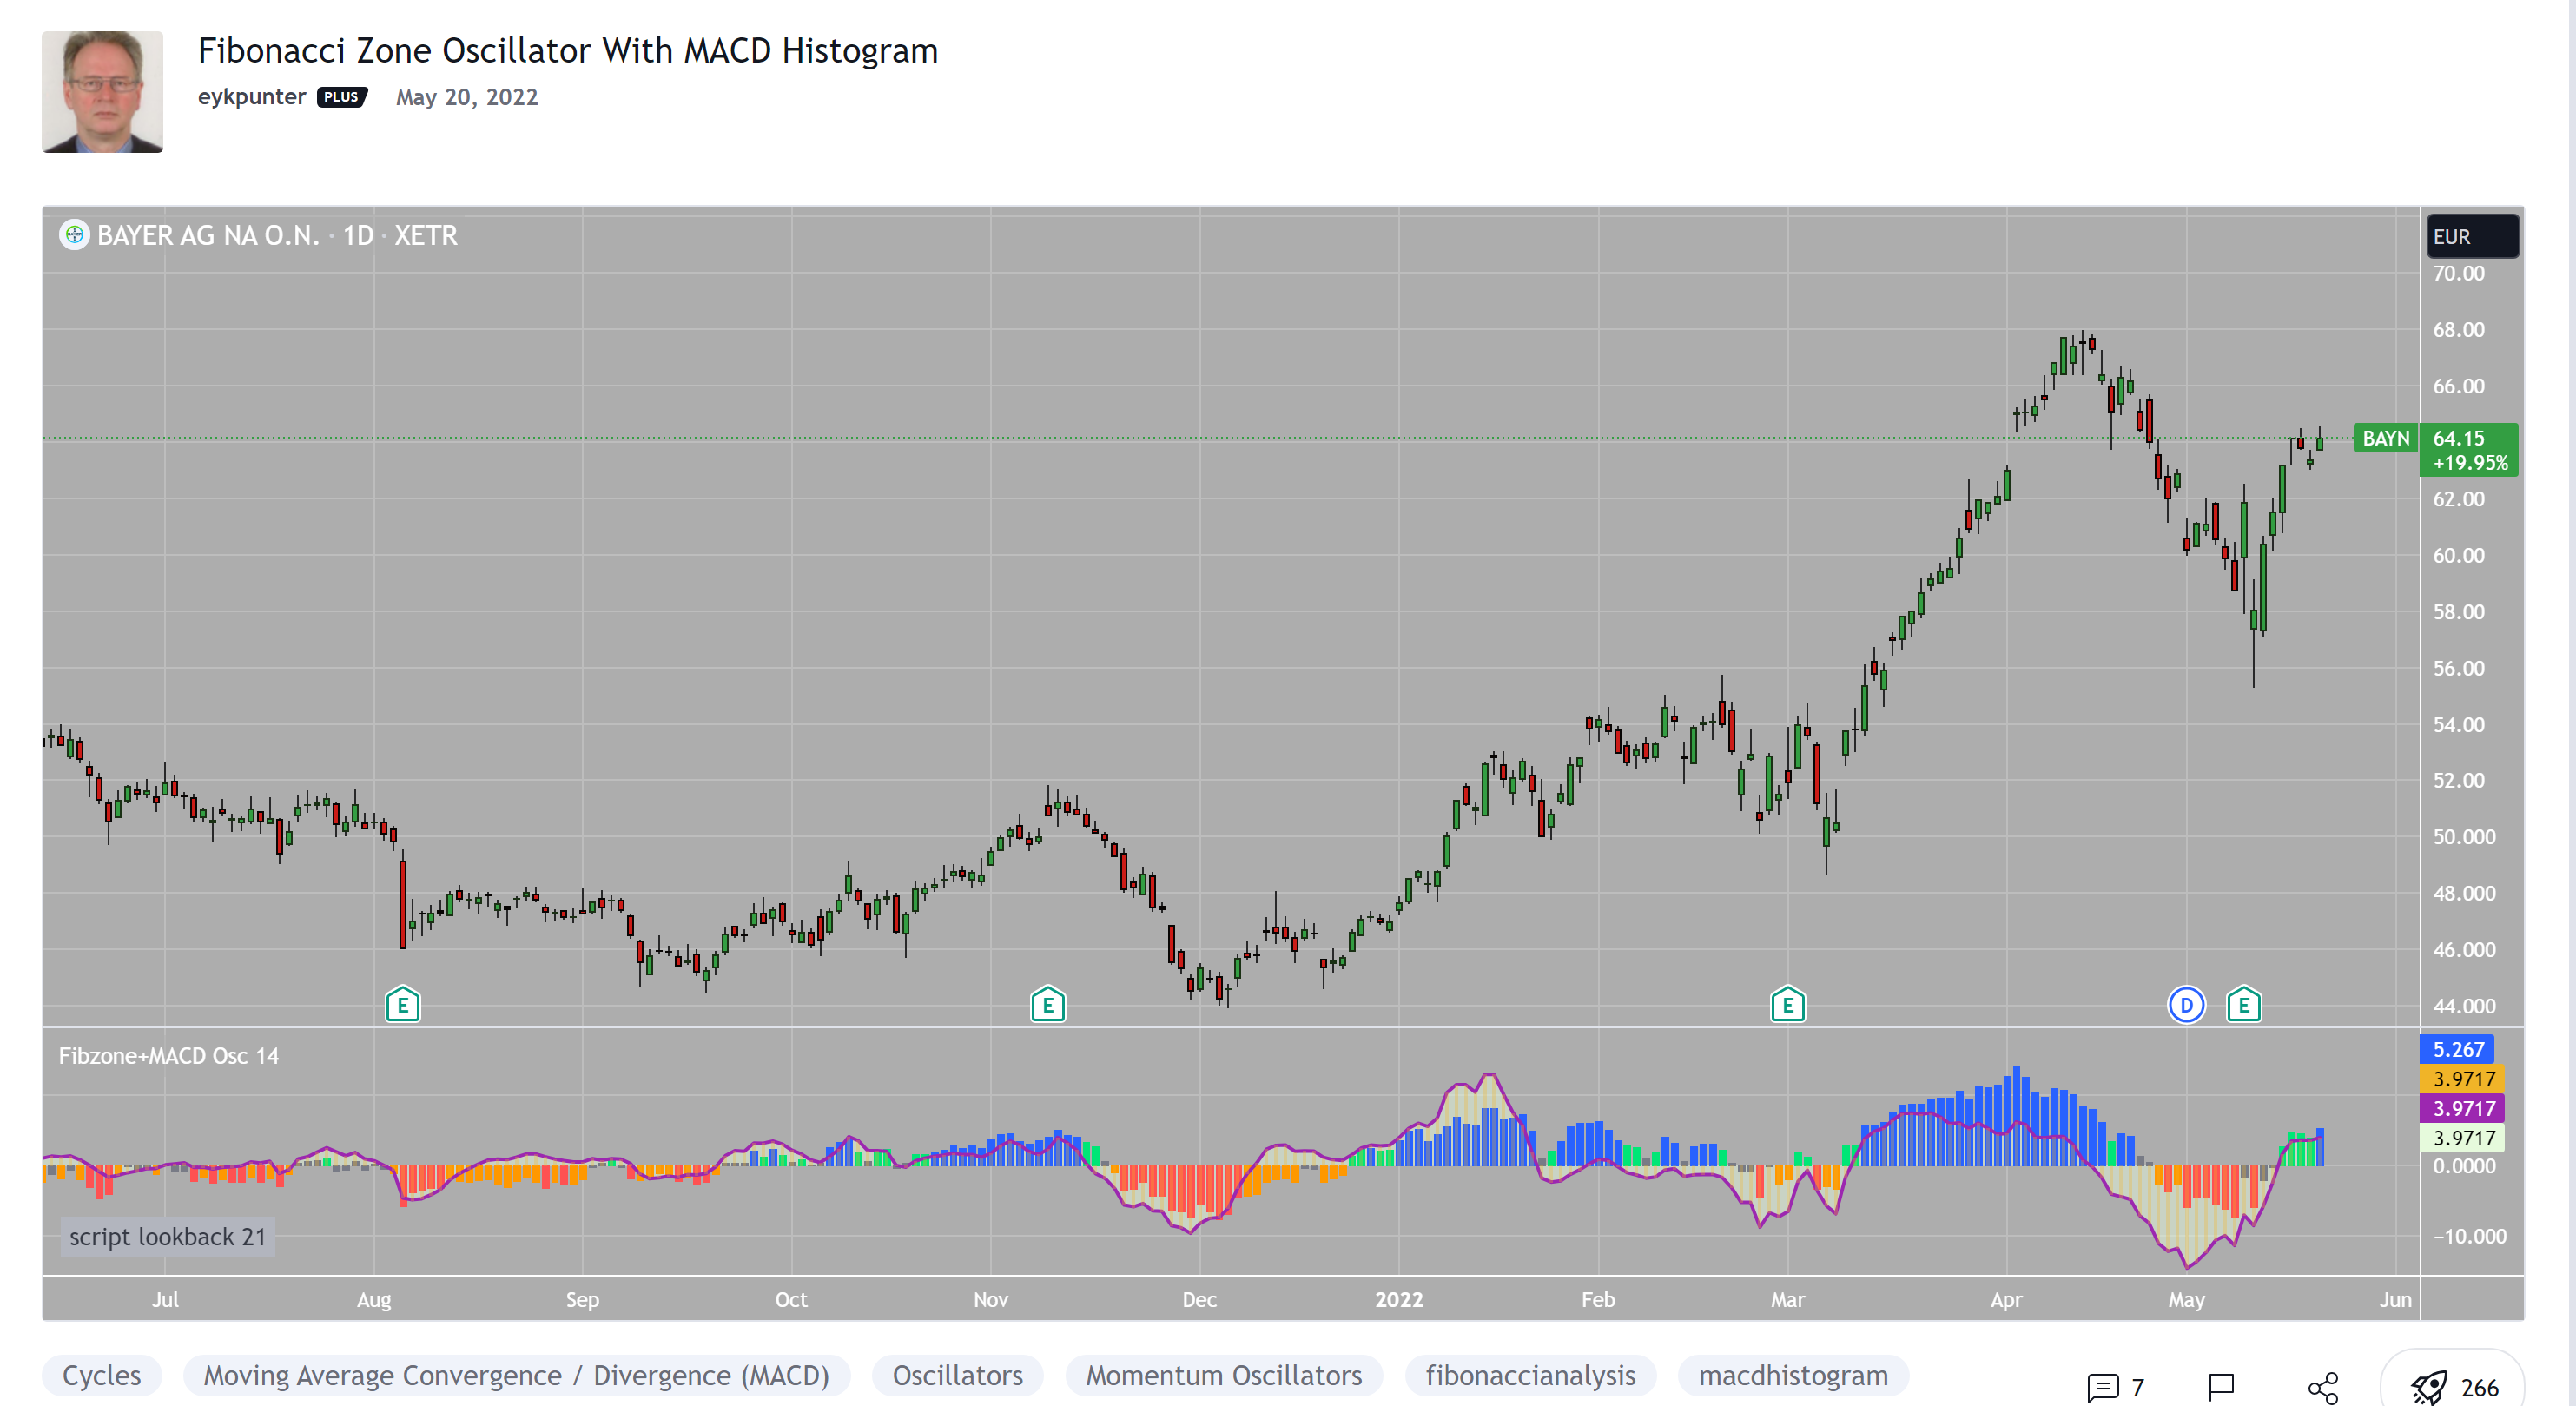
NZQca7f.png

Hi Team - I came across this amazing oscillator and wonder if anyone with good scripting skills could conver to TOS version.
https://www.tradingview.com/script/L2piavbm-Fibonacci-Zone-Oscillator-With-MACD-Histogram/
 
Last edited by a moderator:
Hi Team - I came across this amazing oscillator and wonder if anyone with good scripting skills could conver to TOS version.

https://www.tradingview.com/script/L2piavbm-Fibonacci-Zone-Oscillator-With-MACD-Histogram/

// This source code is subject to the terms of the Mozilla Public License 2.0 at https://mozilla.org/MPL/2.0/
// © eykpunter
//@version=5
indicator("Fibonacci Zone Oscillator With MACD Histogram", shorttitle="Fibzone+MACD Osc", overlay=false)
per=input.int(14, "calculate for last ## bars", minval=6)
perwish=input.bool(true, "script sets lookback")
perfeedback=input.bool(true, "show feedback label about lookback")
//Select all or one group; done this way to make sure someting is plotted.
bothwish=input.bool(true, "togle combination of columns and macd or just one", group="Select all or one")
onewish=input.bool(true, "togle fibzone columns / histgram with volume event marks", group="Select all or one")
fibwish= bothwish or onewish? true:false
macwish= bothwish or not onewish? true:false
//calculate periods by script if perwish == true
setper= 14 //initialize setper
tf=timeframe.period
setper:= tf=="M"? 14: tf=="W"? 14: tf=="D"? 21: tf=="240"? 28: tf=="180"? 28: tf=="120"? 35: tf=="60"? 35: tf=="45"? 35: tf=="30"? 42: tf=="15"? 42: tf=="5"? 49: tf=="3"? 49: tf=="1"? 56: 10
per:= perwish? setper : per
//set lookbacks for MACD histogram
slow = per
fast = math.round(per/2)
signal = math.round(per/3)
//Calculate Donchian Channel
hl=ta.highest(high,per) //High Line (Border)
ll=ta.lowest(low,per) //Low Line (Border)
//Calculate Fibonacci levels
dist=hl-ll //range of the Donchian channel
hf=hl-dist*0.236 //Highest Fibonacci line
cfh=hl-dist*0.382 //Center High Fibonacci line
cfl=hl-dist*0.618 //Center Low Fibonacci line
lf=hl-dist*0.764 //Lowest Fibonacci line
//Calculate relative position of close
posup=close>hf //in uptrend area
posabove=close<=hf and close> cfh //in prudent buyers area
posmiddle=close<=cfh and close>cfl //in center area
posunder=close<=cfl and close>lf //in prudent sellers area
posdown=close<=lf //in downtrend area
//Calculate percents of close
cent=(hl+ll)/2 //used as 100 % level
clocent1=close/cent*100-100 //percent of close for fibonacci oscillator
clocent=fibwish?clocent1:na //show columns if wished in inputs
//MACD histogram with equal percentrange as Fibonaccizone columns
emaF = ta.ema(close, fast)
emaS = ta.ema(close, slow)
emaFperc=emaF/cent*100
emaSperc=emaS/cent*100
macdperc = (emaFperc - emaSperc)
sig = ta.ema(macdperc, signal)
diff1 = (macdperc - sig)
factor=(ta.highest(clocent1, per)-ta.lowest(clocent1,per))/(ta.highest(diff1,per)-ta.lowest(diff1,per)) //factor to make histogram range equal to column range
diff=macwish?diff1*factor:na //show histogram if wished in inputs
//calculate column colors
poscol=posup? color.new(color.blue,00): posabove? color.new(color.lime,00): posmiddle? color.new(color.gray,00): posunder? color.new(color.orange,00): color.new(color.red, 00)
//plots
plot(diff, "diffarea", style=plot.style_area, color=color.rgb(230,250,220, 50), linewidth=0) //macd as area greenish off white
plot(clocent, title="% Close", style=plot.style_columns, color=poscol, linewidth=4) //fibzone oscillator
plot(diff, "diffline", style=plot.style_line, color=diff>0? color.new(color.purple, 00): color.new(color.purple, 00), linewidth=2) //macd as line purple
plot(diff, "diffhist", style=plot.style_histogram, color=color.rgb(240,180,40, 70), linewidth=2)//macd as histgram golden brown, very transparent

//feedback table
var table userorscript = table.new(position=position.bottom_left, columns=1, rows=1)
feedbacktext=perwish? "script lookback " +str.tostring(per) : "user lookback " +str.tostring(per)
if perfeedback == true
table.cell(userorscript, row=0, column=0, text=feedbacktext, bgcolor=color.silver)
else if perfeedback == false
table.clear(userorscript, 0, 0, 0, 0)
check the below

CSS:
#// This source code is subject to the terms of the Mozilla Public License 2.0 at https
#// © eykpunter
#indicator("Fibonacci Zone Oscillator With MACD Histogram", shorttitle="Fibzone+MACD Osc", overlay=false)
#-- Converted by Sam4Cok@Samer800    - 01/2024
declare lower;
input colorBars = yes;
input source = close;
input AutoLookbackBar = yes;     # "script sets lookback")
input manualLoobackBars = 14;    # "calculate for last ## bars"
input macdMovAvgType = {SMA, Default EMA};
input viewOptions = {"Fibonacci Zone", "MACD Histogram", Default "Fib Zone and Macd"};

def na = Double.NaN;
#-- Colors
DefineGlobalColor("cloud", Color.WHITE);
DefineGlobalColor("macdLine", Color.MAGENTA);
DefineGlobalColor("macdHist", CreateColor(97, 70, 7));
DefineGlobalColor("fibExtUp", Color.GREEN);
DefineGlobalColor("fibUp", Color.DARK_GREEN);
DefineGlobalColor("fibExtDn", Color.RED);
DefineGlobalColor("fibDn", Color.DARK_RED);
DefineGlobalColor("fibNorm", Color.GRAY);
#--------------
def ema = macdMovAvgType==macdMovAvgType.EMA;
def fib = viewOptions==viewOptions."Fibonacci Zone";
def mcd = viewOptions==viewOptions. "MACD Histogram";
def fibwish = !mcd;
def macwish = !fib;
def tf = GetAggregationPeriod();
def setper = if tf <= AggregationPeriod.MIN then 56 else
             if tf <= AggregationPeriod.FIVE_MIN then 49 else
             if tf <= AggregationPeriod.THIRTY_MIN then 42 else
             if tf <= AggregationPeriod.TWO_HOURS then 35 else
             if tf <= AggregationPeriod.FOUR_HOURS then 28 else
             if tf <= AggregationPeriod.DAY then 21 else
             if tf <= AggregationPeriod.MONTH then 14 else
             if tf <= AggregationPeriod.THREE_MIN then 49 else 10;
def per = if AutoLookbackBar then if IsNaN(setper) then 14 else setper else manualLoobackBars;
#//set lookbacks for MACD histogram
def slow = per;
def fast = Round(per/2, 0);
def signal = Round(per/3, 0);

#//Calculate Donchian Channel
def hh = highest(high,per);      # //High Line (Border)
def ll = lowest(low,per);        # //Low Line  (Border)
#//Calculate Fibonacci levels
def dist = hh - ll;              # //range of the Donchian channel
def hf   = hh - dist * 0.236;    # //Highest Fibonacci line
def cfh  = hh - dist * 0.382;    # //Center High Fibonacci line
def cfl  = hh - dist * 0.618;    # //Center Low Fibonacci line
def lf   = hh - dist * 0.764;    # //Lowest Fibonacci line

#//Calculate relative position of close
def posup     = source >  hf;                   # //in uptrend area
def posabove  = source <= hf  and source > cfh; # //in prudent buyers area
def posmiddle = source <= cfh and source > cfl; # //in center area
def posunder  = source <= cfl and source > lf;  # //in prudent sellers area
def posdown   = source <= lf;                   # //in downtrend area

#//Calculate percents of close
def cent     = (hh + ll) / 2;                        # //used as 100 % level
def clocent1 = source / cent * 100 - 100;             # //percent of close for fibonacci oscillator
def clocent  = if fibwish then clocent1 else na;     # //show columns if wished in inputs

#//MACD histogram with equal percentrange as Fibonaccizone columns
def emaF     = if ema then ExpAverage(source, fast) else Average(source, fast);
def emaS     = if ema then ExpAverage(source, slow) else Average(source, slow);
def emaFperc = emaF / cent * 100;
def emaSperc = emaS / cent * 100;
def macdperc = (emaFperc - emaSperc);
def sig      = if ema then ExpAverage(macdperc, signal) else Average(macdperc, signal);
def diff1    = (macdperc - sig);
def HiCent   = highest(clocent1, per);
def LoCent   = lowest(clocent1,per);
def HiDiff   = highest(diff1,per);
def LoDiff   = lowest(diff1,per);
def factor   = (HiCent- LoCent)/(HiDiff - LoDiff);
def diff     = if macwish then diff1*factor else na;    # //show histogram if wished in inputs

#//calculate column colors
def poscol = if posup then 2 else
             if posabove then 1 else
             if posmiddle then 0 else
             if posunder then -1 else -2;
#//plots
plot mcdLine = diff;           # "diffline"
plot fibzone = clocent;        # //fibzone oscillator
plot mcdHist = diff;           #, "diffhist"
mcdLine.SetLineWeight(2);
mcdLine.SetDefaultColor(GlobalColor("macdLine"));
fibzone.SetLineWeight(3);
fibZone.SetPaintingStrategy(PaintingStrategy.HISTOGRAM);
fibZone.AssignValueColor(if poscol==2 then GlobalColor("fibExtUp") else
                         if poscol==1 then GlobalColor("fibUp") else
                         if poscol==-1 then GlobalColor("fibDn") else
                         if poscol==-2 then GlobalColor("fibExtDn") else GlobalColor("fibNorm"));
mcdHist.SetPaintingStrategy(PaintingStrategy.HISTOGRAM);
mcdHist.SetDefaultColor(GlobalColor("macdHist"));

AssignPriceColor(if !colorBars then Color.CURRENT else
                 if poscol==2 then GlobalColor("fibExtUp") else
                 if poscol==1 then GlobalColor("fibUp") else
                 if poscol==-1 then GlobalColor("fibDn") else
                 if poscol==-2 then GlobalColor("fibExtDn") else GlobalColor("fibNorm"));
AddCloud(diff, 0, GlobalColor("cloud"), GlobalColor("cloud"));
#- ENd of CODE
 

Join useThinkScript to post your question to a community of 21,000+ developers and traders.

Similar threads

Not the exact question you're looking for?

Start a new thread and receive assistance from our community.

87k+ Posts
453 Online
Create Post

Similar threads

Similar threads

The Market Trading Game Changer

Join 2,500+ subscribers inside the useThinkScript VIP Membership Club
  • Exclusive indicators
  • Proven strategies & setups
  • Private Discord community
  • ‘Buy The Dip’ signal alerts
  • Exclusive members-only content
  • Add-ons and resources
  • 1 full year of unlimited support

Frequently Asked Questions

What is useThinkScript?

useThinkScript is the #1 community of stock market investors using indicators and other tools to power their trading strategies. Traders of all skill levels use our forums to learn about scripting and indicators, help each other, and discover new ways to gain an edge in the markets.

How do I get started?

We get it. Our forum can be intimidating, if not overwhelming. With thousands of topics, tens of thousands of posts, our community has created an incredibly deep knowledge base for stock traders. No one can ever exhaust every resource provided on our site.

If you are new, or just looking for guidance, here are some helpful links to get you started.

What are the benefits of VIP Membership?
VIP members get exclusive access to these proven and tested premium indicators: Buy the Dip, Advanced Market Moves 2.0, Take Profit, and Volatility Trading Range. In addition, VIP members get access to over 50 VIP-only custom indicators, add-ons, and strategies, private VIP-only forums, private Discord channel to discuss trades and strategies in real-time, customer support, trade alerts, and much more. Learn all about VIP membership here.
How can I access the premium indicators?
To access the premium indicators, which are plug and play ready, sign up for VIP membership here.
Back
Top