
Author Message : (Repaint)
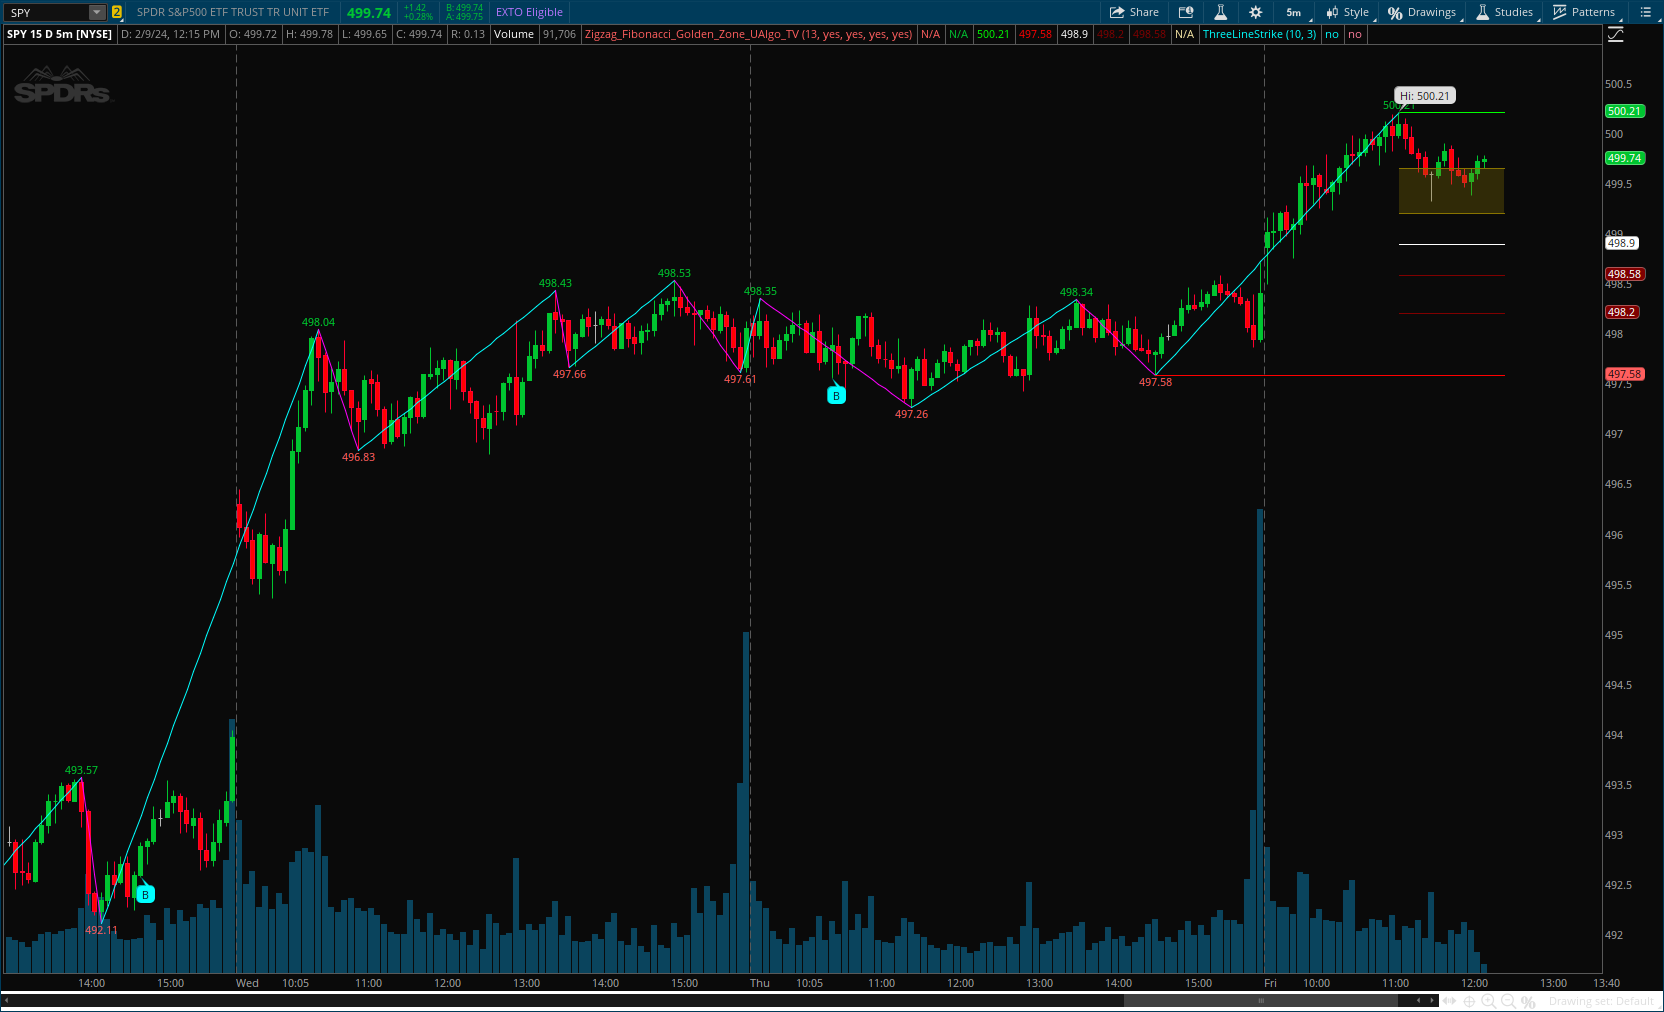
The "Zigzag Fibonacci Golden Zone" aims to identify potential trend pullback points by utilizing a combination of zigzag patterns and Fibonacci "Golden Zone (0.618 - 0.786)" retracement levels. It plots zigzag lines on the price chart, highlighting significant swing highs and swing lows, and overlays Fibonacci retracement levels to indicate potential support and resistance zones. Additionally, it provides options to display buy and sell signals based on specific criteria.
CSS:
#//https://www.tradingview.com/v/Q8eLfEbA/
#// This source code is subject to the terms of the Mozilla Public License 2.0 at https://mozilla.org/MPL/2.0/
#// © UAlgo
#indicator("Zigzag Fibonacci Golden Zone [UAlgo]",overlay=true,max_bars_back=5000)
# Converted by Sam4Cok@Samer800    - 02/2024

input ZigzagLength = 13;    # "Zig Zag Length"
input showZigzag = yes;
input showHiLoLines = yes;
input showPrices = yes;     # 'Show Prices'
input showBuySellSignals = no;    # 'Show Buy / Sell Signals'

def na = Double.NaN;
def last = IsNaN(close[3]);
def bar = BarNumber();
def len = ZigzagLength;
def srcUpper = high;
def srcLower = low;

def upper = Highest(srcUpper, len);
def lower = Lowest(srcLower, len);
def os = if srcUpper[len] >= upper then 0 else if srcLower[len] <= lower then 1 else os[1];
def pl = os == 1 and os[1] != 1;
def ph = os == 0 and os[1] != 0;
def pvtL = if pl[-len] then low else  pvtL[1];
def pvtH = if ph[-len] then high else pvtH[1];
def pLLine = if !IsNaN(pvtL) then pvtL else pLLine[1];
def phLine = if !IsNaN(pvtH) then pvtH else phLine[1];
def InxH = if ph[-len] then bar else InxH[1];
def InxL = if pl[-len] then bar else InxL[1];
def col = if ph[-len] then 1 else if pl[-len] then -1 else col[1];
def top = if bar >= HighestAll(InxH) and !last then phLine else na;
def bot = if bar >= HighestAll(InxL) and !last then pLLine else na;
def diff = (top - bot);
def draw_236 = diff * 0.236 + bot;
def draw_382 = diff * 0.382 + bot;
def draw_618 = diff * 0.618 + bot;
def draw_786 = diff * 0.786 + bot;
#-- Signals
def sellSignal = (close[1] < (pvtH - pvtL) * 0.786 + pvtL and close[1] > (pvtH - pvtL) * 0.618 + pvtL and
                 os == 0 and close[1] < open[1] and !sellSignal[1] and !sellSignal[2] and close < open);
def buySignal = (close[1] > (pvtH - pvtL) * 0.236 + pvtL and close[1] < (pvtH - pvtL) * 0.382 + pvtL and
                 os == 1 and close[1] > open[1] and !buySignal[1] and !buySignal[2] and close > open);

AddCloud(draw_786, draw_618, CreateColor(137, 116, 0), CreateColor(137, 116, 0), yes);
#-- Plots
plot priceL = if showPrices and pvtL != pvtL[1] then low else na;
plot priceH = if showPrices and pvtH != pvtH[1] then high else na;
plot valTopDraw = if !showHiLoLines then na else top;
plot valBotDraw = if !showHiLoLines then na else bot;
plot draw500 = if !showHiLoLines then na else (top + bot) / 2;
plot draw236 = if !showHiLoLines then na else draw_236;
plot draw382 = if !showHiLoLines then na else draw_382;
plot zigZag = if !showZigzag then na else
              if pl[-len] then low else
              if ph[-len] then high else na;
zigZag.EnableApproximation();
zigZag.AssignValueColor(if col[1] > 0 then Color.MAGENTA else Color.CYAN);
valTopDraw.SetDefaultColor(Color.GREEN);
valBotDraw.SetDefaultColor(Color.RED);
draw500.SetDefaultColor(Color.WHITE);
draw236.SetDefaultColor(Color.DARK_RED);
draw382.SetDefaultColor(Color.DARK_RED);
priceL.SetDefaultColor(Color.DOWNTICK);
priceH.SetDefaultColor(Color.UPTICK);
priceL.SetPaintingStrategy(PaintingStrategy.VALUES_BELOW);
priceH.SetPaintingStrategy(PaintingStrategy.VALUES_ABOVE);

AddChartBubble(showBuySellSignals and sellSignal, high , "S", Color.MAGENTA);
AddChartBubble(showBuySellSignals and buySignal, low , "B", Color.CYAN, no);


#-- END of CODE