Repaints AGAIG ZigZag Arrows For ThinkOrSwim

Repaints

csricksdds

Trader Educator
VIP
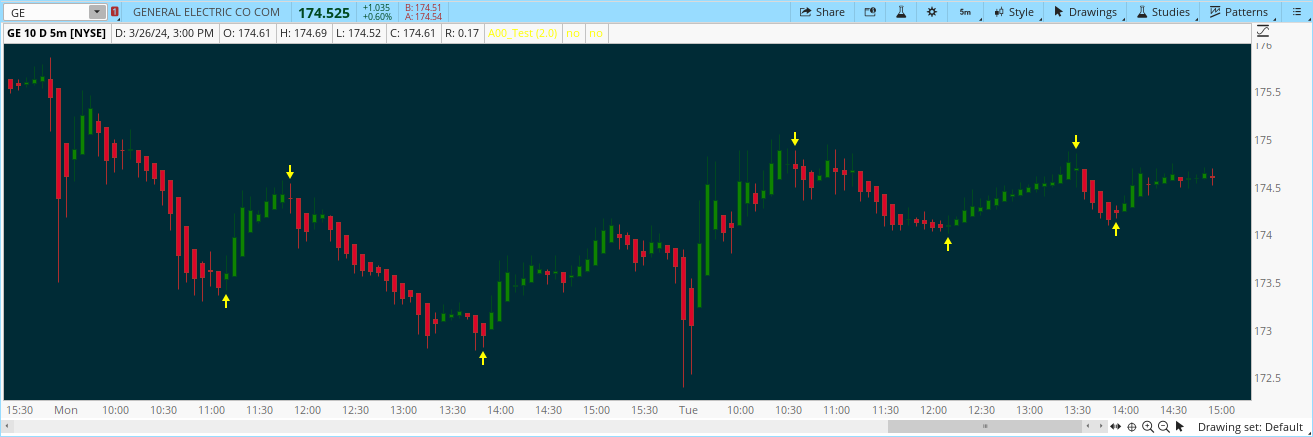
I thought I had posted this before but can't find it on my posts. This is a change in direction indicator.
AsGoodAsItGets Trend Arrows:
HaxmGAP.png

Here is the code:
Ruby:
#CSR Buy/Sell Arrows with Short/LongHaulFilter Bubbles
#Developed 4-9-22 First Edition
#Modified by C. Ricks to show direction arrows only (Large Yellow Arroews Up/Down

declare upper;

input atrreversal = 2.0;#Hint atrreversal: Turn down for more entries, up for less entries. Purple signal indicates low point reversal and close approaching Kijun. Orange signal indicates the price is crossing the Kijun. Green signal indicates the low of the candle holds over the Kijun. Red signal means reversal at a high point.
def priceh = MovingAverage(AverageType.EXPONENTIAL, high, 5);
def pricel = MovingAverage(AverageType.EXPONENTIAL, low, 5);

def EIL = ZigZagHighLow("price h" = priceh, "price l" = pricel, "percentage reversal" = .01, "absolute reversal" = .05, "atr length" = 5, "atr reversal" = atrreversal).lastL;
def EIH = ZigZagHighLow("price h" = priceh, "price l" = pricel, "percentage reversal" = .01, "absolute reversal" = .05, "atr length" = 5, "atr reversal" = atrreversal).lastH;

def tenkan_period = 9;
def kijun_period = 26;
def Kijun = (Highest(high, kijun_period) + Lowest(low, kijun_period)) / 2;
def avgPerc = ((Kijun - close) / Kijun) * 100;

plot signaldown = !isNAN(EIH);
signaldown.SetPaintingStrategy(PaintingStrategy.BOOLEAN_ARROW_down);
signaldown.setdefaultcolor (CreateColor (255, 255, 0));


plot signalrevBot = !isNaN(EIL);
signalrevBot.SetPaintingStrategy(PaintingStrategy.BOOLEAN_ARROW_up);
signalrevBot.setdefaultcolor (CreateColor (255, 255, 0));

#End Code
 
Last edited by a moderator:

Join useThinkScript to post your question to a community of 21,000+ developers and traders.

As a trader (AsGoodAsItGets) I am always looking for Trend Continuation. This ZigZag modification I have made carries the trend out to eight places (since bars usually move 6-10 bars I have added 8-Bar average placement for this). Under studies and strategies you can click on the wheel and undo show plots for mah and mal if you choose. I also select high_low for my setting. I am using CYAN for down arrows (easy for me to see) and GREEN for up arrows. I also can't find who wrote the original code and hope you will let me know in order to credit. Image attached:


Code:
Ruby:
# used to switch between "zigzag based on high/low of price" and "zigzag based on then high/low of moving averages"
#Not sure who to credit for original code but modified by C. Ricks to show continuing arrows (up to 12) under AGAIG_ZigZag_ContinuationArrows 4/7/24

input method = {default average, high_low};

# data for the built-in zigzag indicator which is referenced in the study. To see the ZigZagHighLow() code, look for it in the built-in TOS studies
def bubbleoffset = .0005;
def percentamount = .01;
def revAmount = .05;
def atrreversal = 2.0;
def atrlength = 5;

# data for the moving averages
def pricehigh = high;
def pricelow = low;
def averagelength = 5;
def averagetype = AverageType.EXPONENTIAL;

# here are the moving averages used for the signals - changed to plots and given colors
plot mah = MovingAverage(averagetype, pricehigh, averagelength);
plot mal = MovingAverage(averagetype, pricelow, averagelength);
mah.setdefaultcolor(color.cyan);
mal.setdefaultcolor(color.cyan);

# continues the switch between the two different zigzag data points
def priceh = if method == method.high_low then pricehigh else mah;
def pricel = if method == method.high_low then pricelow else mal;

# references the built-in zigzag indicator
def EI = ZigZagHighLow("price h" = priceh, "price l" = pricel, "percentage reversal" = percentamount, "absolute reversal" = revAmount, "atr length" = atrlength, "atr reversal" = atrreversal);

# not very clear on how this exactly works - but the end result is to plot the zigzag lines
def reversalAmount = if (close * percentamount / 100) > Max(revAmount < atrreversal * reference ATR(atrlength), revAmount) then (close * percentamount / 100) else if revAmount < atrreversal * reference ATR(atrlength) then atrreversal * reference ATR(atrlength) else revAmount;
rec EISave = if !IsNaN(EI) then EI else GetValue(EISave, 1);
def chg = (if EISave == priceh then priceh else pricel) - GetValue(EISave, 1);
def isUp = chg >= 0;
rec isConf = AbsValue(chg) >= reversalAmount or (IsNaN(GetValue(EI, 1)) and GetValue(isConf, 1));
def EId = if isUp then 1 else 0;


# calculates and plots the arrows
def EIL = if !IsNaN(EI) and !isUp then pricel else GetValue(EIL, 1);
def EIH = if !IsNaN(EI) and isUp then priceh else GetValue(EIH, 1);
def dir = CompoundValue(1, if EIL != EIL[1] or pricel == EIL[1] and pricel == EISave then 1 else if EIH != EIH[1] or priceh == EIH[1] and priceh == EISave then -1 else dir[1], 0);
def signal = CompoundValue(1, if dir > 0 and pricel > EIL then if signal[1] <= 0 then 1 else signal[1] else if dir < 0 and priceh < EIH then if signal[1] >= 0 then -1 else signal[1] else signal[1], 0);
def showarrows = yes;
plot U1 = showarrows and signal > 0 and signal[1] <= 0;
U1.SetPaintingStrategy(PaintingStrategy.BOOLEAN_ARROW_UP);
U1.SetDefaultColor(Color.GREEN);
U1.SetLineWeight(4);
plot D1 = showarrows and signal < 0 and signal[1] >= 0;
D1.SetPaintingStrategy(PaintingStrategy.BOOLEAN_ARROW_DOWN);
D1.SetDefaultColor(Color.Cyan);
D1.SetLineWeight(4);

plot D2 = showarrows and signal < 0 and signal[2] >= 0;
D2.SetPaintingStrategy(PaintingStrategy.BOOLEAN_ARROW_DOWN);
D2.SetDefaultColor(Color.Cyan);
D2.SetLineWeight(4);

plot D3 = showarrows and signal < 0 and signal[3] >= 0;
D3.SetPaintingStrategy(PaintingStrategy.BOOLEAN_ARROW_DOWN);
D3.SetDefaultColor(Color.Cyan);
D3.SetLineWeight(4);

plot D4 = showarrows and signal < 0 and signal[4] >= 0;
D4.SetPaintingStrategy(PaintingStrategy.BOOLEAN_ARROW_DOWN);
D4.SetDefaultColor(Color.Cyan);
D4.SetLineWeight(4);

plot D5 = showarrows and signal < 0 and signal[5] >= 0;
D5.SetPaintingStrategy(PaintingStrategy.BOOLEAN_ARROW_DOWN);
D5.SetDefaultColor(Color.Cyan);
D5.SetLineWeight(4);

plot D6 = showarrows and signal < 0 and signal[6] >= 0;
D6.SetPaintingStrategy(PaintingStrategy.BOOLEAN_ARROW_DOWN);
D6.SetDefaultColor(Color.Cyan);
D6.SetLineWeight(4);

plot D7 = showarrows and signal < 0 and signal[7] >= 0;
D7.SetPaintingStrategy(PaintingStrategy.BOOLEAN_ARROW_DOWN);
D7.SetDefaultColor(Color.Cyan);
D7.SetLineWeight(4);

plot D8 = showarrows and signal < 0 and signal[8] >= 0;
D8.SetPaintingStrategy(PaintingStrategy.BOOLEAN_ARROW_DOWN);
D8.SetDefaultColor(Color.Cyan);
D8.SetLineWeight(4);


plot U2 = showarrows and signal > 0 and signal[2] <= 0;
U2.SetPaintingStrategy(PaintingStrategy.BOOLEAN_ARROW_UP);
U2.SetDefaultColor(Color.GREEN);
U2.SetLineWeight(4);

plot U3 = showarrows and signal > 0 and signal[3] <= 0;
U3.SetPaintingStrategy(PaintingStrategy.BOOLEAN_ARROW_UP);
U3.SetDefaultColor(Color.GREEN);
U3.SetLineWeight(4);

plot U4 = showarrows and signal > 0 and signal[4] <= 0;
U4.SetPaintingStrategy(PaintingStrategy.BOOLEAN_ARROW_UP);
U4.SetDefaultColor(Color.GREEN);
U4.SetLineWeight(4);

plot U5 = showarrows and signal > 0 and signal[5] <= 0;
U5.SetPaintingStrategy(PaintingStrategy.BOOLEAN_ARROW_UP);
U5.SetDefaultColor(Color.GREEN);
U5.SetLineWeight(4);

plot U6 = showarrows and signal > 0 and signal[6] <= 0;
U6.SetPaintingStrategy(PaintingStrategy.BOOLEAN_ARROW_UP);
U6.SetDefaultColor(Color.GREEN);
U6.SetLineWeight(4);

plot U7 = showarrows and signal > 0 and signal[7] <= 0;
U7.SetPaintingStrategy(PaintingStrategy.BOOLEAN_ARROW_UP);
U7.SetDefaultColor(Color.GREEN);
U7.SetLineWeight(4);

plot U8 = showarrows and signal > 0 and signal[8] <= 0;
U8.SetPaintingStrategy(PaintingStrategy.BOOLEAN_ARROW_UP);
U8.SetDefaultColor(Color.GREEN);
U8.SetLineWeight(4);


##End Code
 
Last edited by a moderator:

Similar threads

Not the exact question you're looking for?

Start a new thread and receive assistance from our community.

87k+ Posts
368 Online
Create Post

Similar threads

Similar threads

The Market Trading Game Changer

Join 2,500+ subscribers inside the useThinkScript VIP Membership Club
  • Exclusive indicators
  • Proven strategies & setups
  • Private Discord community
  • ‘Buy The Dip’ signal alerts
  • Exclusive members-only content
  • Add-ons and resources
  • 1 full year of unlimited support

Frequently Asked Questions

What is useThinkScript?

useThinkScript is the #1 community of stock market investors using indicators and other tools to power their trading strategies. Traders of all skill levels use our forums to learn about scripting and indicators, help each other, and discover new ways to gain an edge in the markets.

How do I get started?

We get it. Our forum can be intimidating, if not overwhelming. With thousands of topics, tens of thousands of posts, our community has created an incredibly deep knowledge base for stock traders. No one can ever exhaust every resource provided on our site.

If you are new, or just looking for guidance, here are some helpful links to get you started.

What are the benefits of VIP Membership?
VIP members get exclusive access to these proven and tested premium indicators: Buy the Dip, Advanced Market Moves 2.0, Take Profit, and Volatility Trading Range. In addition, VIP members get access to over 50 VIP-only custom indicators, add-ons, and strategies, private VIP-only forums, private Discord channel to discuss trades and strategies in real-time, customer support, trade alerts, and much more. Learn all about VIP membership here.
How can I access the premium indicators?
To access the premium indicators, which are plug and play ready, sign up for VIP membership here.
Back
Top