
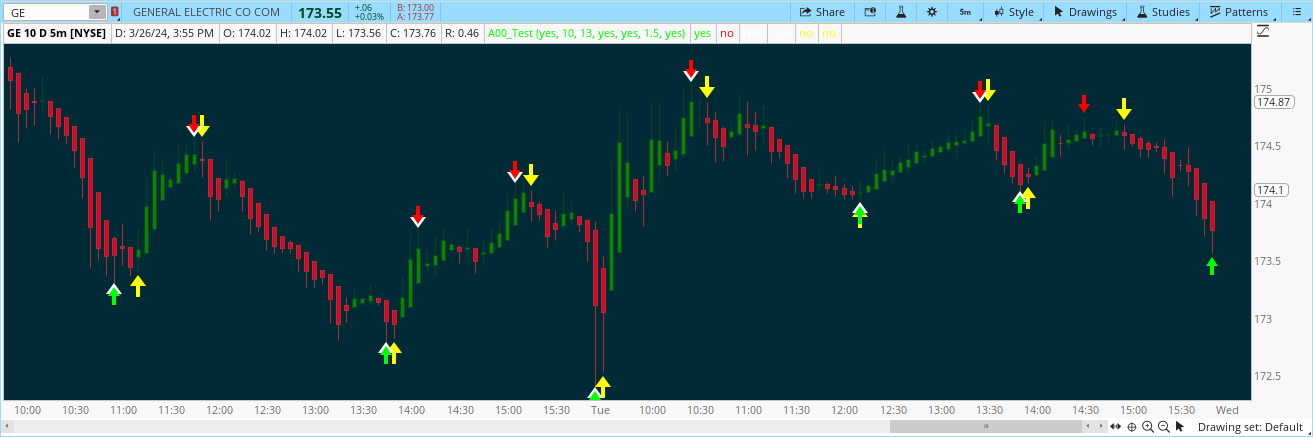
This is a fun AsGoodAsItGets 3-Trend Indicator which contains Highs/Lows/Peaks/Valleys/AGIG Trend Arrows.
https://usethinkscript.com/threads/agaig-zigzag-arrows-for-thinkorswim.18303/
https://usethinkscript.com/threads/agaig-highlow-peaksvalleys-for-thinkorswim.18301/
Occasionally all three arrows will show at the same time!
Code:
https://usethinkscript.com/threads/agaig-zigzag-arrows-for-thinkorswim.18303/
https://usethinkscript.com/threads/agaig-highlow-peaksvalleys-for-thinkorswim.18301/
Occasionally all three arrows will show at the same time!
Code:
Ruby:
#AsGoodAsItGets-3Trend Indicator 3/26/24
##AsGood-HiLo-PeaksValleys-Arrows indicator 3/26/24
# find peaks and valleys
# https://usethinkscript.com/threads/...y-demand-zones-for-thinkorswim.172/#post-7048
# robert payne code
#Modified by C. Ricks 2/21/24

def na = double.nan;
def bn = BarNumber();
def lastbn = highestall(if isnan(close) then 0 else bn);
def lastcls = if lastbn then close else lastcls[1];
#def lastbar = (!isnan(close) and isnan(close[-1]));

input show_peak_valley_arrows = yes;
def spva = show_peak_valley_arrows;

input len = 10;
def offset = Min(len - 1, lastbn - bn);
#def swingLow = low < Lowest(low[1], len - 1) and low == GetValue(Lowest(low, len), -offset);

#--------------------------
#valley section
#def Valley = low < Lowest(low[1], len) and low < Lowest(low[-len], len);
def valley = low < Lowest(low[1], len - 1) and low == GetValue(Lowest(low, len), -offset);
def valley_pr = if valley then low else na;

plot ArrowUP = if spva then Valley else na;
ArrowUP.SetPaintingStrategy(PaintingStrategy.BOOLEAN_ARROW_UP);
ArrowUP.SetDefaultColor(Color.Green);
ArrowUP.SetLineWeight(3);

#---------------------------
#peak section
#def Peak = high > highest(high[1], len) and high > highest(high[-len], len);
def peak = high > highest(high[1], len - 1) and high == GetValue(highest(high, len), -offset);
def peak_pr = if peak then high else na;

plot ArrowDN = if spva then Peak else na;
ArrowDN.SetPaintingStrategy(PaintingStrategy.BOOLEAN_ARROW_DOWN);
ArrowDN.SetDefaultColor(Color.RED);
ArrowDN.SetLineWeight(3);

# -------------------------

##AsGood-HighLowPivot-Arrows


input length = 13;
def lastBar = HighestAll(if IsNaN(close) then 0 else bn);

input ignore_last_bar = yes;
def ignorelast = if (ignore_last_bar and bn == lastbar) then 0 else 1;

def HighPoint = ignorelast and high > highest(high[1], length - 1) and high == GetValue(highest(high, length), -offset);
def Lowpoint = ignorelast and low < Lowest(low[1], length - 1) and low == GetValue(Lowest(low, length), -offset);


input show_Arrows_on_Highpoints_Lowpoints = yes;
def vert = 0.001;

def prange = highPoint – lowPoint;
def plotHighest = highpoint + prange * .3;
def plotLowest = lowpoint - prange * 3.0;

plot BuyCriteria = if LowPoint then Low else double.NaN ;
plot SellCriteria = if HighPoint then High else double.NaN ;

BuyCriteria.SetPaintingStrategy(PaintingStrategy.ARROW_UP) ;
BuyCriteria.SetDefaultColor(color.WHITE);
BuyCriteria.SetLineWeight(5);
SellCriteria.SetPaintingStrategy(PaintingStrategy.ARROW_DOWN) ;
SellCriteria.SetDefaultColor(color.WHITE);
SellCriteria.SetLineWeight(5);

#CSR Buy/Sell Arrows with Short/LongHaulFilter Bubbles
#Developed 4-9-22 First Edition
#Modified by C. Ricks to show direction arrows only (Large Yellow Arroews Up/Down

declare upper;

input atrreversal = 1.5;#Hint atrreversal: Turn down for more entries, up for less entries. Purple signal indicates low point reversal and close approaching Kijun. Orange signal indicates the price is crossing the Kijun. Green signal indicates the low of the candle holds over the Kijun. Red signal means reversal at a high point.
def priceh = MovingAverage(AverageType.EXPONENTIAL, high, 5);
def pricel = MovingAverage(AverageType.EXPONENTIAL, low, 5);

def EIL = ZigZagHighLow("price h" = priceh, "price l" = pricel, "percentage reversal" = .01, "absolute reversal" = .05, "atr length" = 5, "atr reversal" = atrreversal).lastL;
def EIH = ZigZagHighLow("price h" = priceh, "price l" = pricel, "percentage reversal" = .01, "absolute reversal" = .05, "atr length" = 5, "atr reversal" = atrreversal).lastH;

def tenkan_period = 9;
def kijun_period = 26;
def Kijun = (Highest(high, kijun_period) + Lowest(low, kijun_period)) / 2;
def avgPerc = ((Kijun - close) / Kijun) * 100;

plot signaldown = !isNAN(EIH);
signaldown.SetPaintingStrategy(PaintingStrategy.BOOLEAN_ARROW_down);
signaldown.setdefaultcolor (CreateColor (255, 255, 0));
signaldown.setlineweight(5);


plot signalrevBot = !isNaN(EIL);
signalrevBot.SetPaintingStrategy(PaintingStrategy.BOOLEAN_ARROW_up);
signalrevBot.setdefaultcolor (CreateColor (255, 255, 0));
signalrevbot.setlineweight(5);


input usealerts = yes;
alert(usealerts and SellCriteria[1] == 1, "Short", alert.bar, sound.ring);
alert(usealerts and BuyCriteria[1] == 1, "Long", alert.bar, sound.ring);

#End Code
Last edited by a moderator: