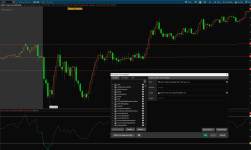
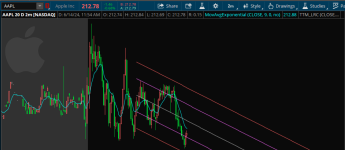
I just have the RSI now.hi @JoseB do you mine to share the bottom indicator, look pretty accurate. thanks
You are using an out of date browser. It may not display this or other websites correctly.
You should upgrade or use an alternative browser.
You should upgrade or use an alternative browser.
Trust The Levels - Trade Options In ThinkOrSwim
- Thread starter METAL
- Start date
- Status
- Not open for further replies.
Join useThinkScript to post your question to a community of 21,000+ developers and traders.
hi @JoseB do you mine to share the bottom indicator, look pretty accurate. thanks
Attachments
I also had a problem with my TOS not acting right - all I had to do was to clear the cache. Hope this works for you too,What should I do? I used the exact link you provided.
No. I believe some are working on it though. Not sure.Does someone have a chart for long term trading? I could only get the short term 2 minute working but since I trade when I can between travel, I'd like to apply this strategy at the 1-4h level where I am making a long term trade for a few days or a weeks etc.
That is how I found this specific setting. Having it anchored is the key.@METAL im glad it works for you…. But why not just use the regression channel on that TOS provides in their drawing menu?
Will it be Okay for you to share the Workspace @METAL, Top one.Which one? the top or bottom?
I was reading all the pages and bit confused which one to use.
Thanks. I cleared the cache and it kind of looks more normal now but not exactly what @METAL has.I also had a problem with my TOS not acting right - all I had to do was to clear the cache. Hope this works for you too,
Attachments
Last edited by a moderator:
Drum Rocker
Member
Hey Metal, I have been following since your first post and have been watching your YouTube videos. Thank you for all the time you have put into this thread! I have done a handful of live trades using just the LRC lines and unfortunately all were losing trades, so I have stopped using it for now. It seems your manually drawn trendlines are more effective, but I could not find what your using to base those off of. Perhaps it's just me and my interpretation of the strategy.Monday! Another Green Day! Please let me know if you guys are using this strategy. I would love to hear how you are doing with it.
MSFT:
View attachment 22128
QQQ for a loss:
View attachment 22129
SPX :
View attachment 22130
The support and resistance lines are drawn manually. Can you provide some of your trades so I may review them. I have some losses but very few with this strategy.Hey Metal, I have been following since your first post and have been watching your YouTube videos. Thank you for all the time you have put into this thread! I have done a handful of live trades using just the LRC lines and unfortunately all were losing trades, so I have stopped using it for now. It seems your manually drawn trendlines are more effective, but I could not find what your using to base those off of. Perhaps it's just me and my interpretation of the strategy.
Drum Rocker
Member
Hi Metal, Thanks for the reply. The trades were a few weeks ago and I wish I would have taken a screen grab. I am going to try again after watching your recent YouTube videos and will capture them. Thanks for helping out!The support and resistance lines are drawn manually. Can you provide some of your trades so I may review them. I have some losses but very few with this strategy.
I do use the S/R levels to help with the direction of my entries. If I have a Resistance Level just above the LRC, then I will wait until I am over the R level If I intend to enter calls. I also use the LRC as a scale out and take profit level.At Metal, still trying to understand because to me it seems that your entries are driven by your manual trendlines vs the actual indicator. Using this example chart below, would you have entered a short at position 1 or would you have waited until position 2 to enter?
View attachment 22151
Last edited:
Friday was another great day. Super clean trades. Had 5 trades and all were GREEN!
TSM:
View attachment 22063
ARM:
View attachment 22064
Thanks so much for the videos and sharing the strategies.
I loaded the chart on my TOS and am confused about the different regression channels even if the anchor is at the same time. Do you know why the channel slopes are so different with different indicators?
I also wanted to know as to about how much money approx. do you put on each trade.
Thanks so much again!!
Apperformance
New member
Hey folks, I recently switched to Schwab from IBRK (100% happier btw) and found this thread by a happy accident. These linear regression lines are a+. I’m very visual person and this help with price action confluence on entry/exit. Great trading today with this group today. Recommend 

- Status
- Not open for further replies.
Similar threads
-
Money Zone Auto Fib Levels For ThinkOrSwim
- Started by BrooklynMintCapital
- Replies: 12
-
Hourly CCI -200/200 levels For ThinkOrSwim
- Started by autoloader
- Replies: 3
-
Swing Trade Stocks Outperforming Market In ThinkOrSwim
- Started by tellyt
- Replies: 15
-
Not the exact question you're looking for?
Start a new thread and receive assistance from our community.
87k+
Posts
1440
Online
Similar threads
-
Money Zone Auto Fib Levels For ThinkOrSwim
- Started by BrooklynMintCapital
- Replies: 12
-
Hourly CCI -200/200 levels For ThinkOrSwim
- Started by autoloader
- Replies: 3
-
Swing Trade Stocks Outperforming Market In ThinkOrSwim
- Started by tellyt
- Replies: 15
-
Similar threads
-
Money Zone Auto Fib Levels For ThinkOrSwim
- Started by BrooklynMintCapital
- Replies: 12
-
Hourly CCI -200/200 levels For ThinkOrSwim
- Started by autoloader
- Replies: 3
-
Swing Trade Stocks Outperforming Market In ThinkOrSwim
- Started by tellyt
- Replies: 15
-
The Market Trading Game Changer
Join 2,500+ subscribers inside the useThinkScript VIP Membership Club
- Exclusive indicators
- Proven strategies & setups
- Private Discord community
- ‘Buy The Dip’ signal alerts
- Exclusive members-only content
- Add-ons and resources
- 1 full year of unlimited support
Frequently Asked Questions
What is useThinkScript?
useThinkScript is the #1 community of stock market investors using indicators and other tools to power their trading strategies. Traders of all skill levels use our forums to learn about scripting and indicators, help each other, and discover new ways to gain an edge in the markets.
How do I get started?
We get it. Our forum can be intimidating, if not overwhelming. With thousands of topics, tens of thousands of posts, our community has created an incredibly deep knowledge base for stock traders. No one can ever exhaust every resource provided on our site.
If you are new, or just looking for guidance, here are some helpful links to get you started.
- The most viewed thread:
https://usethinkscript.com/threads/repainting-trend-reversal-for-thinkorswim.183/ - Our most popular indicator:
https://usethinkscript.com/threads/buy-the-dip-indicator-for-thinkorswim.3553/ - Answers to frequently asked questions:
https://usethinkscript.com/threads/answers-to-commonly-asked-questions.6006/
What are the benefits of VIP Membership?
VIP members get exclusive access to these proven and tested premium indicators: Buy the Dip, Advanced Market Moves 2.0, Take Profit, and Volatility Trading Range. In addition, VIP members get access to over 50 VIP-only custom indicators, add-ons, and strategies, private VIP-only forums, private Discord channel to discuss trades and strategies in real-time, customer support, trade alerts, and much more. Learn all about VIP membership here.
How can I access the premium indicators?
To access the premium indicators, which are plug and play ready, sign up for VIP membership here.


