Triple Exhaustion Indicator For ThinkOrSwim

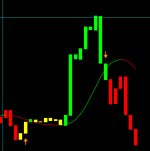
watching the indicator this morning with NQ. After the breakout waited for the down arrow, took the short. I was watching on the 5 min, the 1 min was too busy but it looks like the 3 min might have been better at nailing the top. Update: I think taking the short after a fast breakout will enhance the chance of success.
tPZBSDE.png
TAHnhni.png
 

Attachments

  • tPZBSDE.png
    tPZBSDE.png
    7.4 KB · Views: 776
Last edited by a moderator:

Join useThinkScript to post your question to a community of 21,000+ developers and traders.

Yes there are capital letters VinceField#3962 but I'm not sure if that makes a difference. Another member here added me on Discord the other day and I assume he used the lowercase letters like I initially wrote. What is your username, I'll try to add you.
Hi @Chence27 can you add me as well? Jonas99#8623. Thanks!
 
@Chence27
More I dig into this and more I find this indicator powerful. I would love to go deeper playing with it. Really good job, thank you.
I am not really a day trader and 1h chart is my main tool for swings.

Now, I am wondering how this react if you incorporate some indication from a higher timeframe. ex: add 4h info versus the 1h that I am looking.
Any one has field experience on that? How would you find the right balance between capitalizing on the opportunities in catching the extremes in smaller timeframe versus stronger confirmation from higher timeframes?
 
I put this code in the scanner and it showed no results on the 5 min......Is the code valid to scan?

## Triple Exhaustion Indicator
##
##
## CREDITS
## Requested by @Chence27 from criteria listed here https://usethinkscript.com/threads/triple-exhaustion-indicator.9001/
##
##
## Removing the header Credit credits and description is not permitted, any modification needs to be shared.
##
## V 1.0 : @cos251 - Initial release per request from www.usethinkscript.com forum thread:
## : https://usethinkscript.com/threads/triple-exhaustion-indicator.9001/
##
##
##

declare upper;

# --- Inputs
input over_bought = 80;
input over_sold = 20;
input KPeriod = 10;
input DPeriod = 10;
input priceH = high;
input priceL = low;
input priceC = close;
input averageType = AverageType.SIMPLE;
input length = 1000;
input paintBars = yes;
input showLabels = yes;


# --- Indicators - StochasticSlow / MACD / MACD StDev / DMI+/-
def SlowK = reference StochasticFull(over_bought, over_sold, KPeriod, DPeriod, priceH, priceL, priceC, 3, averageType).FullK;
def MACD = reference MACD()."Value";
def priceMean = Average(MACD, length);
def MACD_stdev = (MACD - priceMean) / StDev(MACD, length);
def dPlus = reference DMI()."DI+";
def dMinus = reference DMI()."DI-";
# --- End Indicators

# --- Conditions
def sellerRegular = SlowK < 20 and MACD_stdev < -1 and dPlus < 15;
def sellerExtreme = SlowK < 20 and MACD_stdev < -2 and dPlus < 15;
def buyerRegular = SlowK > 80 and MACD_stdev > 1 and dMinus < 15;
def buyerExtreme = SlowK > 80 and MACD_stdev > 2 and dMinus < 15;
# --- End Conditions

# -- Price Color


# --- Arrows/Triggers
plot RegularBuy = if sellerRegular[1] and !sellerRegular then low else Double.NaN;

i think this scan is only for futures? Or i have something wrong
 
i think for the scan, you'll see results when the market is open. you're looking for results at a lower timeframe.. 1, 2 or 5 mins.
 
@fingerlakes It is not possible to say where you went astray based on the details that you have provided. Are you sure there are valid signals available at the time you ran the scan? If so:
  • Try setting your scan to look for the previous candle. This indicator is not valid until after the candle closes, otherwise:
    • Please provide a chart that shows the signal on the candle that you scanned for. Include the WHOLE chart not just a snippet. We need to see all your settings in order to re-create what you see. Unsure of how to upload screenshots to the forum, Here are directions.
    • Please provide a screen grab of your scanner which is not showing the trigger that appears on your chart.
A review of your posts show that you tend to run the scanner during times when the market is tanking. This a a upward trending indicator.
So there won't be many signals in a downtrend.
 
Last edited:
Let's see how this does catching the DIS knife. Daily chart says buy and the True Momentum Oscillator says buy. First time the two have lined up during this selloff. Let's go Mouse!

I do need to wait for this daily candle to print with the buy signal. Volatile day like today and it may not print.
EXACTLY!
The buy signal has been triggering on / off all day today. At the moment, it has disappeared. You won't know if it is a valid signal until after the candle closes.
rRqoH9n.png

Shared chart link: http://tos.mx/dUeaY8i Click here for --> Easiest way to load shared links
 
Last edited:
hi all. I can only mostly scalp/day trade due to my full time job. What do you recommend is the best time frame to use this indicator with?
 
I've made some small modifications to better approximate the color system of the original study. Also, there are no buy/sell entry signals for the extreme condition, so I got rid of those as well.

CKRP56L.png


Code:
## Triple Exhaustion Indicator
##
##
## CREDITS
## Requested by @Chence27 from criteria listed here https://usethinkscript.com/threads/triple-exhaustion-indicator.9001/
##
##
## Removing the header Credit credits and description is not permitted, any modification needs to be shared.
##
## V 1.0 :    @cos251 - Initial release per request from www.usethinkscript.com forum thread:
##       :    https://usethinkscript.com/threads/triple-exhaustion-indicator.9001/
## V 1.1 : @chence27 - modifcations to better approximate original study
##
##
##

declare upper;

# --- Inputs
input over_bought = 80;
input over_sold = 20;
input KPeriod = 10;
input DPeriod = 10;
input priceH = high;
input priceL = low;
input priceC = close;
input averageType = AverageType.SIMPLE;
input length = 1000;
input paintBars = yes;
input showLabels = yes;


# --- Indicators - StochasticSlow / MACD / MACD StDev / DMI+/-
def SlowK = reference StochasticFull(over_bought, over_sold, KPeriod, DPeriod, priceH, priceL, priceC, 3, averageType).FullK;
def MACD = reference MACD()."Value";
def priceMean = Average(MACD, length);
def MACD_stdev =  (MACD - priceMean) / StDev(MACD, length);
def dPlus = reference DMI()."DI+";
def dMinus = reference DMI()."DI-";
# --- End Indicators

# --- Conditions
def sellerRegular = SlowK < 20 and MACD_stdev < -1 and dPlus < 15;
def sellerExtreme = SlowK < 20 and MACD_stdev < -2 and dPlus < 15;
def buyerRegular = SlowK > 80 and MACD_stdev > 1 and dMinus < 15;
def buyerExtreme = SlowK > 80 and MACD_stdev > 2 and dMinus < 15;
# --- End Conditions

# -- Price Color
AssignPriceColor( if paintBars and sellerExtreme then Color.CYAN else if buyerExtreme and paintBars then Color.MAGENTA else if paintBars and sellerRegular then Color.GREEN else if buyerRegular and paintBars then Color.RED else if paintBars then Color.GRAY else Color.Current);

# --- Arrows/Triggers
plot RegularBuy = if sellerRegular[1] and !sellerRegular then low else Double.NaN;

RegularBuy.SetPaintingStrategy(PaintingSTrategy.ARROW_UP);

RegularBuy.SetDefaultColor(Color.GREEN);


plot RegularSell = if buyerRegular[1] and !buyerRegular then high else Double.NaN;

RegularSell.SetPaintingStrategy(PaintingSTrategy.ARROW_Down);

RegularSell.SetDefaultColor(Color.RED);


# --- Labels
AddLabel(showLabels,"SellerRegular",Color.RED);
AddLabel(showLabels,"SellerExtreme",Color.MAGENTA);
AddLabel(showLabels,"BuyerRegular",Color.GREEN);
AddLabel(showLabels,"BuyerExtreme",Color.CYAN);


Can this indicator be converted to watch list, with the same color codes logic. Thank you.
 
Looking at the 15m for AAPL, the buy/sell signals seem to be setting me up for failure. Checking multiple other time frames for AAPL specifically, the indicator is not even painting so maybe that's part of the issue?

 
Last edited:
Looking at the 15m for AAPL, the buy/sell signals seem to be setting me up for failure. Checking multiple other time frames for AAPL specifically, the indicator is not even painting so maybe that's part of the issue?

If you are using the indicator by itself, I would agree. Looks like AAPL on 5m there was 1 trade. It was also on the same downtrend and never broke it till the end of the day.

XniZrHM.jpg
 
If you are using the indicator by itself, I would agree. Looks like AAPL on 5m there was 1 trade. It was also on the same downtrend and never broke it till the end of the day.

XniZrHM.jpg
shouldnt I have seen a sell signal at the top of that trend though?
 
Have someone been able to figure out why this indicator on some symbols/timeframes there is no candle painting according to the study?
For example, have a look at symbol CFVI today using a 5min timeframe
 

Similar threads

Not the exact question you're looking for?

Start a new thread and receive assistance from our community.

87k+ Posts
196 Online
Create Post

Similar threads

Similar threads

The Market Trading Game Changer

Join 2,500+ subscribers inside the useThinkScript VIP Membership Club
  • Exclusive indicators
  • Proven strategies & setups
  • Private Discord community
  • ‘Buy The Dip’ signal alerts
  • Exclusive members-only content
  • Add-ons and resources
  • 1 full year of unlimited support

Frequently Asked Questions

What is useThinkScript?

useThinkScript is the #1 community of stock market investors using indicators and other tools to power their trading strategies. Traders of all skill levels use our forums to learn about scripting and indicators, help each other, and discover new ways to gain an edge in the markets.

How do I get started?

We get it. Our forum can be intimidating, if not overwhelming. With thousands of topics, tens of thousands of posts, our community has created an incredibly deep knowledge base for stock traders. No one can ever exhaust every resource provided on our site.

If you are new, or just looking for guidance, here are some helpful links to get you started.

What are the benefits of VIP Membership?
VIP members get exclusive access to these proven and tested premium indicators: Buy the Dip, Advanced Market Moves 2.0, Take Profit, and Volatility Trading Range. In addition, VIP members get access to over 50 VIP-only custom indicators, add-ons, and strategies, private VIP-only forums, private Discord channel to discuss trades and strategies in real-time, customer support, trade alerts, and much more. Learn all about VIP membership here.
How can I access the premium indicators?
To access the premium indicators, which are plug and play ready, sign up for VIP membership here.
Back
Top