The Triple Exhaustion Indicator is extremely resource-intensive. Attempts at scanning will not be reliable.I can not get this scan to work. Do I set the condition to 'close is equal to (scan name) "Regular Buy Arrow" ' ?
You are using an out of date browser. It may not display this or other websites correctly.
You should upgrade or use an alternative browser.
You should upgrade or use an alternative browser.
Triple Exhaustion Indicator For ThinkOrSwim
- Thread starter Chence27
- Start date
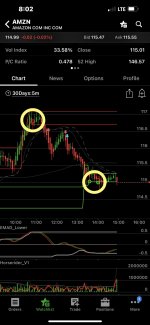
I’ve tried a couple versions of the study in this thread, none seem to be mobile friendly. Any chance you could share the version that is mobile friendly?Yes it is mobile friendly... you will not see the colored candles only the arrows which indicates the end of exhaustion. I use it with my mobile setup.
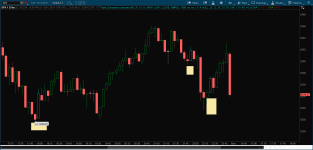
Here is a screenshot of /ES 5min chart …
The red and green circles are Triple Exhastion… the circle that is dark inside is extreme exhaustion the circle with the lighter color inside is regular exhaustion
It would not be possible to use this indicator on mobileI’ve tried a couple versions of the study in this thread, none seem to be mobile friendly. Any chance you could share the version that is mobile friendly?
If your looking for the candles to paint… Mobile does not have that functionality. If you load the original version of Triple exhaustion then open in mobile and change the arrows to dots (or leave the arrows) you may also need to add more days to your charts or change the length in settings to 900 or 1000.I’ve tried a couple versions of the study in this thread, none seem to be mobile friendly. Any chance you could share the version that is mobile friendly?
The yellow circles show the green and red dots they are the “end of exhaustion” aka when the candles stop painting.
Attachments
@HODL-Lay-HE-hoo! Hi HODL, I’ve also tried a couple of versions of the Triple Exhaustion Indicator study in this thread, but none of them are working on mobile. I tried to change the length in settings to 1000, but it is still not working. Your version seems to be working well on mobile. Would you be willing to share your code or link? Really interested to see it on mobile. Thank you.
If your looking for the candles to paint… Mobile does not have that functionality. If you load the original version of Triple exhaustion then open in mobile and change the arrows to dots (or leave the arrows) you may also need to add more days to your charts or change the length in settings to 900 or 1000.
The yellow circles show the green and red dots they are the “end of exhaustion” aka when the candles stop painting.
Scroll down to the “Mobile Setup” post it shows my triple exhaustion settings (regularbuy RegularSell extremebuy ExtremeSell)@HODL-Lay-HE-hoo! Hi HODL, I’ve also tried a couple of versions of the Triple Exhaustion Indicator study in this thread, but none of them are working on mobile. I tried to change the length in settings to 1000, but it is still not working. Your version seems to be working well on mobile. Would you be willing to share your code or link? Really interested to see it on mobile. Thank you.
If you screenshot your settings it would be easier to help you. That being said if the version you are using has more than one aggregation (MTF) then the study will not work at all - you will need to use the non mtf variation.
https://usethinkscript.com/threads/the-confirmation-trend-chart-setup-the-end-all-be-all-for-thinkorswim.15257/post-124252
Hello, I found this script for a "Tripple Exhaustion Indicator". I wish to add a sound alert in the script in the "Arrows / Triggers" section for each "Arrow Up Or Arrow down statement. I found an example of "how to " on the web however I have not been able to successfully do it. I would really appreciate if some one can do it or show me how. I have below the original script I need modified and then below that the sample I found. Thanks.
## Triple Exhaustion Indicator
##
##
## CREDITS
## Requested by @Chence27 from criteria listed here https://usethinkscript.com/threads/triple-exhaustion-indicator.9001/
##
##
## Removing the header Credit credits and description is not permitted, any modification needs to be shared.
##
## V 1.0 : @cos251 - Initial release per request from www.usethinkscript.com forum thread:
## : https://usethinkscript.com/threads/triple-exhaustion-indicator.9001/
## V 1.1 : @Chence27 - modifcations to better approximate original study
##
##
##
declare upper;
# --- Inputs
input over_bought = 80;
input over_sold = 20;
input KPeriod = 10;
input DPeriod = 10;
input priceH = high;
input priceL = low;
input priceC = close;
input averageType = AverageType.SIMPLE;
input length = 1000;
input paintBars = yes;
input showLabels = yes;
# --- Indicators - StochasticSlow / MACD / MACD StDev / DMI+/-
def SlowK = reference StochasticFull(over_bought, over_sold, KPeriod, DPeriod, priceH, priceL, priceC, 3, averageType).FullK;
def MACD = reference MACD()."Value";
def priceMean = Average(MACD, length);
def MACD_stdev = (MACD - priceMean) / StDev(MACD, length);
def dPlus = reference DMI()."DI+";
def dMinus = reference DMI()."DI-";
# --- End Indicators
# --- Conditions
def sellerRegular = SlowK < 20 and MACD_stdev < -1 and dPlus < 15;
def sellerExtreme = SlowK < 20 and MACD_stdev < -2 and dPlus < 15;
def buyerRegular = SlowK > 80 and MACD_stdev > 1 and dMinus < 15;
def buyerExtreme = SlowK > 80 and MACD_stdev > 2 and dMinus < 15;
# --- End Conditions
# -- Price Color
AssignPriceColor( if paintBars and sellerExtreme then Color.CYAN else if buyerExtreme and paintBars then Color.MAGENTA else if paintBars and sellerRegular then Color.GREEN else if buyerRegular and paintBars then Color.RED else if paintBars then Color.GRAY else Color.Current);
# --- Arrows/Triggers
plot RegularBuy = if sellerRegular[1] and !sellerRegular then low else Double.NaN;
RegularBuy.SetPaintingStrategy(PaintingSTrategy.ARROW_UP);
RegularBuy.SetDefaultColor(Color.GREEN);
plot RegularSell = if buyerRegular[1] and !buyerRegular then high else Double.NaN;
RegularSell.SetPaintingStrategy(PaintingSTrategy.ARROW_Down);
RegularSell.SetDefaultColor(Color.RED);
# --- Labels
AddLabel(showLabels,"SellerRegular",Color.RED);
AddLabel(showLabels,"SellerExtreme",Color.MAGENTA);
AddLabel(showLabels,"BuyerRegular",Color.GREEN);
AddLabel(showLabels,"BuyerExtreme",Color.CYAN);
Here is another one where we utilize two different alert sounds. You'll hear a chime when there is an up arrow and a bell sound when there is a down arrow.
Ruby:
#
# TD Ameritrade IP Company, Inc. (c) 2017-2020
#
input price = close;
input length = 9;
input displace = 0;
plot AvgExp = ExpAverage(price[-displace], length);
plot UpSignal = price crosses above AvgExp;
plot DownSignal = price crosses below AvgExp;
AvgExp.SetDefaultColor(GetColor(1));
UpSignal.SetDefaultColor(Color.UPTICK);
UpSignal.SetPaintingStrategy(PaintingStrategy.BOOLEAN_ARROW_UP);
DownSignal.SetDefaultColor(Color.DOWNTICK);
DownSignal.SetPaintingStrategy(PaintingStrategy.BOOLEAN_ARROW_DOWN);
# Alerts
Alert(UpSignal, "Price crossing above 9 EMA", Alert.Bar, Sound.Chimes);
Alert(DownSignal, "Price crossing below 9 EMA", Alert.Bar, Sound.Bell);
###################################Hello, I found this script for a "Tripple Exhaustion Indicator". I wish to add a sound alert in the script in the "Arrows / Triggers" section for each "Arrow Up Or Arrow down statement. I found an example of "how to " on the web however I have not been able to successfully do it. I would really appreciate if some one can do it or show me how. I have below the original script I need modified and then below that the sample I found. Thanks.
## Triple Exhaustion Indicator
##
##
## CREDITS
## Requested by @Chence27 from criteria listed here https://usethinkscript.com/threads/triple-exhaustion-indicator.9001/
##
##
## Removing the header Credit credits and description is not permitted, any modification needs to be shared.
##
## V 1.0 : @cos251 - Initial release per request from www.usethinkscript.com forum thread:
## : https://usethinkscript.com/threads/triple-exhaustion-indicator.9001/
## V 1.1 : @Chence27 - modifcations to better approximate original study
##
##
##
declare upper;
# --- Inputs
input over_bought = 80;
input over_sold = 20;
input KPeriod = 10;
input DPeriod = 10;
input priceH = high;
input priceL = low;
input priceC = close;
input averageType = AverageType.SIMPLE;
input length = 1000;
input paintBars = yes;
input showLabels = yes;
# --- Indicators - StochasticSlow / MACD / MACD StDev / DMI+/-
def SlowK = reference StochasticFull(over_bought, over_sold, KPeriod, DPeriod, priceH, priceL, priceC, 3, averageType).FullK;
def MACD = reference MACD()."Value";
def priceMean = Average(MACD, length);
def MACD_stdev = (MACD - priceMean) / StDev(MACD, length);
def dPlus = reference DMI()."DI+";
def dMinus = reference DMI()."DI-";
# --- End Indicators
# --- Conditions
def sellerRegular = SlowK < 20 and MACD_stdev < -1 and dPlus < 15;
def sellerExtreme = SlowK < 20 and MACD_stdev < -2 and dPlus < 15;
def buyerRegular = SlowK > 80 and MACD_stdev > 1 and dMinus < 15;
def buyerExtreme = SlowK > 80 and MACD_stdev > 2 and dMinus < 15;
# --- End Conditions
# -- Price Color
AssignPriceColor( if paintBars and sellerExtreme then Color.CYAN else if buyerExtreme and paintBars then Color.MAGENTA else if paintBars and sellerRegular then Color.GREEN else if buyerRegular and paintBars then Color.RED else if paintBars then Color.GRAY else Color.Current);
# --- Arrows/Triggers
plot RegularBuy = if sellerRegular[1] and !sellerRegular then low else Double.NaN;
RegularBuy.SetPaintingStrategy(PaintingSTrategy.ARROW_UP);
RegularBuy.SetDefaultColor(Color.GREEN);
plot RegularSell = if buyerRegular[1] and !buyerRegular then high else Double.NaN;
RegularSell.SetPaintingStrategy(PaintingSTrategy.ARROW_Down);
RegularSell.SetDefaultColor(Color.RED);
# --- Labels
AddLabel(showLabels,"SellerRegular",Color.RED);
AddLabel(showLabels,"SellerExtreme",Color.MAGENTA);
AddLabel(showLabels,"BuyerRegular",Color.GREEN);
AddLabel(showLabels,"BuyerExtreme",Color.CYAN);
Here is another one where we utilize two different alert sounds. You'll hear a chime when there is an up arrow and a bell sound when there is a down arrow.
Ruby:
#
# TD Ameritrade IP Company, Inc. (c) 2017-2020
#
input price = close;
input length = 9;
input displace = 0;
plot AvgExp = ExpAverage(price[-displace], length);
plot UpSignal = price crosses above AvgExp;
plot DownSignal = price crosses below AvgExp;
AvgExp.SetDefaultColor(GetColor(1));
UpSignal.SetDefaultColor(Color.UPTICK);
UpSignal.SetPaintingStrategy(PaintingStrategy.BOOLEAN_ARROW_UP);
DownSignal.SetDefaultColor(Color.DOWNTICK);
DownSignal.SetPaintingStrategy(PaintingStrategy.BOOLEAN_ARROW_DOWN);
##Alerts
###################################
Alert(regularbuy[1], "Buy", Alert.BAR, Sound.DING);
Alert(regularsell[1], "Sell", Alert.BAR, Sound.DING);
this alert will trigger after the bar with the arrow closes… remove the “[1]” if you want the alert to trigger as the arrow appears though you will likely get multiple alerts rather than one.
Essentially I want to plot/display a text value of either "buy", "BUY", "sell", "SELL" or "" based upon the 4 variables. I don't want to post the code I tried to use as I tried what feels like 20 different variations to no avail. I also feel like you can't reassign a value to a variable in thinkScript? I beg you to humble me as to how simple this is, I am banging my head against the wall and chewing on crayons. TIA.
UPDATE: After finishing the box of crayons, I found a solution.
UPDATE: After finishing the box of crayons, I found a solution.
Code:
# --- Conditions
def sellerRegular = SlowK < 20 and MACD_stdev < -1 and dPlus < 15;
def sellerExtreme = SlowK < 20 and MACD_stdev < -2 and dPlus < 15;
def buyerRegular = SlowK > 80 and MACD_stdev > 1 and dMinus < 15;
def buyerExtreme = SlowK > 80 and MACD_stdev > 2 and dMinus < 15;
# --- End Conditions

#background color
AssignBackgroundColor(if sellerRegular or buyerRegular then color.Gray else if sellerExtreme then color.green else if buyerExtreme then color.red else color.black);

#label text
AddLabel(1, if sellerRegular or sellerExtreme then "buy" else if buyerRegular or buyerExtreme then "sell" else " ", if sellerExtreme then color.green else if buyerExtreme then color.red else color.white);
Attachments
Last edited by a moderator:
Join useThinkScript to post your question to a community of 21,000+ developers and traders.
| Thread starter | Similar threads | Forum | Replies | Date |
|---|---|---|---|---|
| H | Triple TSI For ThinkOrSwim | Indicators | 12 | |
|
|
Triple 3 Inside Bars Indicator and Scanner for ThinkorSwim | Indicators | 94 | |
|
|
4 & 20 Period Historical Volatility - Reversals and Trend Exhaustion | Indicators | 6 | |
|
|
Leledc Exhaustion Indicator for ThinkorSwim | Indicators | 46 | |
|
|
Trend Exhaustion Indicator for ThinkorSwim | Indicators | 28 |
Similar threads
-
-
-
4 & 20 Period Historical Volatility - Reversals and Trend Exhaustion
- Started by autoloader
- Replies: 6
-
-
Not the exact question you're looking for?
Start a new thread and receive assistance from our community.
87k+
Posts
2245
Online
Similar threads
-
-
-
4 & 20 Period Historical Volatility - Reversals and Trend Exhaustion
- Started by autoloader
- Replies: 6
-
-
Similar threads
-
-
-
4 & 20 Period Historical Volatility - Reversals and Trend Exhaustion
- Started by autoloader
- Replies: 6
-
-
The Market Trading Game Changer
Join 2,500+ subscribers inside the useThinkScript VIP Membership Club
- Exclusive indicators
- Proven strategies & setups
- Private Discord community
- ‘Buy The Dip’ signal alerts
- Exclusive members-only content
- Add-ons and resources
- 1 full year of unlimited support
Frequently Asked Questions
What is useThinkScript?
useThinkScript is the #1 community of stock market investors using indicators and other tools to power their trading strategies. Traders of all skill levels use our forums to learn about scripting and indicators, help each other, and discover new ways to gain an edge in the markets.
How do I get started?
We get it. Our forum can be intimidating, if not overwhelming. With thousands of topics, tens of thousands of posts, our community has created an incredibly deep knowledge base for stock traders. No one can ever exhaust every resource provided on our site.
If you are new, or just looking for guidance, here are some helpful links to get you started.
- The most viewed thread:
https://usethinkscript.com/threads/repainting-trend-reversal-for-thinkorswim.183/ - Our most popular indicator:
https://usethinkscript.com/threads/buy-the-dip-indicator-for-thinkorswim.3553/ - Answers to frequently asked questions:
https://usethinkscript.com/threads/answers-to-commonly-asked-questions.6006/
What are the benefits of VIP Membership?
VIP members get exclusive access to these proven and tested premium indicators: Buy the Dip, Advanced Market Moves 2.0, Take Profit, and Volatility Trading Range. In addition, VIP members get access to over 50 VIP-only custom indicators, add-ons, and strategies, private VIP-only forums, private Discord channel to discuss trades and strategies in real-time, customer support, trade alerts, and much more. Learn all about VIP membership here.
How can I access the premium indicators?
To access the premium indicators, which are plug and play ready, sign up for VIP membership here.


