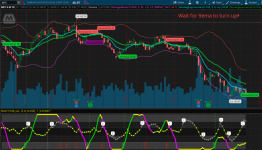
Repaints Trend Reversal for ThinkorSwim

Repaints
Status
Not open for further replies.
@mc01439 The concept of the RSI Laguerre and The Fractal Energy Indicator has been around for quite awhile.

I have seen a few variations of what you did. Your color scheme looks good. If it helps, that's great.

You can find variations of this study in the "Universe of Thinkscript", along with extensive notes on how to use it.

BTW, These two studies can be found in TradingView. FE is called Chop Indicator there.

Also, good job on the scripting, more creative than I am, for sure!

 
Last edited:

New Indicator: Buy the Dip

Check out our Buy the Dip indicator and see how it can help you find profitable swing trading ideas. Scanner, watchlist columns, and add-ons are included.

Download the indicator

Match the RSILg indicator with the Trend Reversal Indicator and it's probably a formidable day trading combo.

@BenTen , sorry I messed up this thread, I should have put the RSILg in it's own thread.

Using this indicator with Expected Move is a good package for weekly options, I am told.

 
Last edited:
@markos if you don't mind me asking, i understand the concept of the gamma and fractal energy but i cannot understand how the laguerre rsi would help especially in day trading. could you enlighten me plz. i am having hard time understanding the laguerre rsi. thanks

 
Last edited:
@theelderwand Well done. Worked for me. @ukwildcat1998 Please give it a try 😀

 
Last edited:
Hi all, new here...when I try to load @theelderwand version of the scanner, I get "Exactly one plot expected". Any ideas?

BTW, Great stuff!

 
Last edited:
@hurricane5 Did you try to load it on a chart? If so, use the actual indicator above instead. This one should be loaded via the Scan tab instead.

 
Last edited:
@hurricane5 When you use it scanner use like the following

plot Data = TrendReversalScanner().upArrow or downArrow. There are two plots defined, choose wisely :)

 
Last edited:
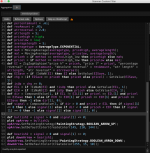
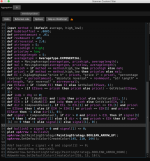
@theelderwand @BenTen I ended up having to comment out the "bearish2 def" (and vice versa for bullish2) to allow it it save, but I'm not sure this is what you had intended. Is there another way that I should be loading to the scanner or should I end up creating 2 different custom scans?


1ZDRYJL.png


H5aRfNW.png


Attachments

  • 1ZDRYJL.png
    1ZDRYJL.png
    351.9 KB · Views: 259
  • H5aRfNW.png
    H5aRfNW.png
    349.8 KB · Views: 280
Last edited:
@hurricane5 It's fairly simple to do it. Add the code as an indicator (but do not use it on your chart since it's intended to be used in the Scan tab). Once you have it added, switch over to the Scanner section.

Click on Add Study Filter > Study > type in the name of the indicator > and select upArrow or downArrow.

Like this:

DGntbAS.png
 
Last edited:
@cherif Click on the link, thinkscript Universe, Search for Mobius in the search box under the indicators tab. There should be copious amounts of info there. Unfortunately, I do not day trade.
 
Last edited by a moderator:
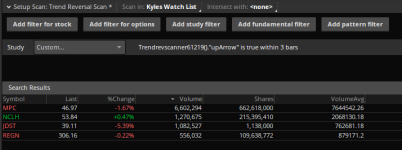
@theelderwand Thanks guys. I appreciate your patience. I scanned against my watchlist of 50 stocks that I watch. It suggested MPC $47.42, NCLH $52.53, REGN $303.51. I like swing trades so I will check in a week to see if they were good buys.

 
Last edited:
@ukwildcat1998 Awesome to hear that. Can you share an actual scan list that shows results. Maybe that'll help folks readily consume

 
Last edited:
@ukwildcat1998 Way to go buddy!! Glad to see this working and probably useful to someone. I got PANW and VMW in my alerts, will be placing a test stock buy on these.

 
Last edited:
@ukwildcat1998 I'm currently using the higher TF signals as a direction for trend and lower TF for entry. I'll be testing a few different strategies around this indicator. Do let me know if you guys find anything cool.

 
Last edited:
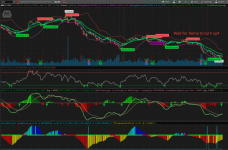
Here's my 6 month chart on screen 1 for MPC.

sXI8yPN.png


Here's my 1 year chart on screen 2.

3GoDO5k.png


Attachments

  • 3GoDO5k.png
    3GoDO5k.png
    320.2 KB · Views: 271
  • sXI8yPN.png
    sXI8yPN.png
    299.1 KB · Views: 269
Last edited:
Great site and great indicator, I appreciate your generous sharing. I downloaded the indicator scanner from

Ttheelderwand://tos.mx/ace3eC , but when I used it, giving me an Error: "Trying to self-assign a non-initialized rec : state."

Thanks in advance for any advice.

 
Last edited:
@Falconuc This means that you are using a very large scan set. Reduce it to a watchlist of stocks that you are intensive. As you can guess, this scanner is pretty CPU intensive. i have a scan list of 20 odd stocks and it works well. Hope this helps.

 
Last edited:
Status
Not open for further replies.

Volatility Trading Range

VTR is a momentum indicator that shows if a stock is overbought or oversold based on its Weekly and Monthly average volatility trading range.

Download the indicator

Similar threads

Not the exact question you're looking for?

Start a new thread and receive assistance from our community.

87k+ Posts
305 Online
Create Post

Similar threads

Similar threads

The Market Trading Game Changer

Join 2,500+ subscribers inside the useThinkScript VIP Membership Club
  • Exclusive indicators
  • Proven strategies & setups
  • Private Discord community
  • ‘Buy The Dip’ signal alerts
  • Exclusive members-only content
  • Add-ons and resources
  • 1 full year of unlimited support

Frequently Asked Questions

What is useThinkScript?

useThinkScript is the #1 community of stock market investors using indicators and other tools to power their trading strategies. Traders of all skill levels use our forums to learn about scripting and indicators, help each other, and discover new ways to gain an edge in the markets.

How do I get started?

We get it. Our forum can be intimidating, if not overwhelming. With thousands of topics, tens of thousands of posts, our community has created an incredibly deep knowledge base for stock traders. No one can ever exhaust every resource provided on our site.

If you are new, or just looking for guidance, here are some helpful links to get you started.

What are the benefits of VIP Membership?
VIP members get exclusive access to these proven and tested premium indicators: Buy the Dip, Advanced Market Moves 2.0, Take Profit, and Volatility Trading Range. In addition, VIP members get access to over 50 VIP-only custom indicators, add-ons, and strategies, private VIP-only forums, private Discord channel to discuss trades and strategies in real-time, customer support, trade alerts, and much more. Learn all about VIP membership here.
How can I access the premium indicators?
To access the premium indicators, which are plug and play ready, sign up for VIP membership here.
Back
Top