You should upgrade or use an alternative browser.
- Status
- Not open for further replies.

New Indicator: Buy the Dip
Check out our Buy the Dip indicator and see how it can help you find profitable swing trading ideas. Scanner, watchlist columns, and add-ons are included.
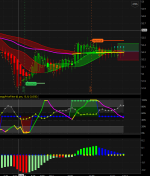
For the RSI Laguerre with Fractal Energy, the "standard settings" are 8-13-8. The RSILg Auto-Adjusts for time, so once you find the settings you like, Keep them that way for all time frames. Please be sure to read the tutorial I placed in the tutorial section.
https://tos.mx/K1jtyx I like the coloring of @mc01439 on the RSILg indicator. You may not even need the FE indicator. It is lipstick according to it's creator.
Clam-shell
New member
ukwildcat1998
New member
I'm currently using the higher TF signals as a direction for trend and lower TF for entry. I'll be testing a few different strategies around this indicator. Do let me know if you guys find anything cool.
Hi
Thanks for your sharing and i am impressed with the stuff you shared. I would like to seek some clarifications on how we should interpret both the RSI and FE indicator.
- 1. RSI line is the momentum indicator that defines the potential entry points whenever it crosses 0.1 when it changes from yellow to green when the stock is oversold
- 2. when RSI is bought, and line change from yellow to RED at 0.9 indicates a potential sell signal.
Here is my qns, how do we interpret the FE in conjunction with the price action? Or do we interpret the FE with the RSI?
When FE is Consolidation and FE line maintains abv 0.38, does it mean the trend is still up?
In consolidation will look for breakouts and remain in open trades until I have addition signs that trade may turn against me.
Im using the first script on the charts which works really good but The only issue I'm having is when I use the second script for the scanner and scan it, I get an error message saying :Trying to self assign a non initialized rec: state. Not sure what I'm doing wrong
> This means that you are using a very large scan set. Reduce it to a watchlist of stocks that you are intensive. As you can guess, this scanner is pretty CPU intensive. i have a scan list of 20 odd stocks and it works well. Hope this helps.
Thanks for the quick response!!
- Status
- Not open for further replies.

BenTen's Watchlist + Setup + Trade Recaps
Get access to Ben's watchlist, swing trading strategy, ThinkorSwim setup, and trade examples.
| Thread starter | Similar threads | Forum | Replies | Date |
|---|---|---|---|---|
|
|
Repaints Enhanced Trend Reversal Indicator for ThinkorSwim | Indicators | 125 | |
|
|
Reversal Candles (Saikou / Hikui) Trend Change for ThinkorSwim | Indicators | 10 | |
| C | AGAIG Trend Vertical Line For ThinkOrSwim | Indicators | 11 | |
| D | Trend Trader Buy/Sell Signals For ThinkOrSwim | Indicators | 9 | |
|
|
LNL Trend System for ThinkOrSwim | Indicators | 27 |
Similar threads
-
Repaints Enhanced Trend Reversal Indicator for ThinkorSwim
- Started by BenTen
- Replies: 125
-
Reversal Candles (Saikou / Hikui) Trend Change for ThinkorSwim
- Started by BenTen
- Replies: 10
-
-
-
Not the exact question you're looking for?
Start a new thread and receive assistance from our community.
Similar threads
-
Repaints Enhanced Trend Reversal Indicator for ThinkorSwim
- Started by BenTen
- Replies: 125
-
Reversal Candles (Saikou / Hikui) Trend Change for ThinkorSwim
- Started by BenTen
- Replies: 10
-
-
-
Similar threads
-
Repaints Enhanced Trend Reversal Indicator for ThinkorSwim
- Started by BenTen
- Replies: 125
-
Reversal Candles (Saikou / Hikui) Trend Change for ThinkorSwim
- Started by BenTen
- Replies: 10
-
-
-
The Market Trading Game Changer
- Exclusive indicators
- Proven strategies & setups
- Private Discord community
- ‘Buy The Dip’ signal alerts
- Exclusive members-only content
- Add-ons and resources
- 1 full year of unlimited support
Frequently Asked Questions
useThinkScript is the #1 community of stock market investors using indicators and other tools to power their trading strategies. Traders of all skill levels use our forums to learn about scripting and indicators, help each other, and discover new ways to gain an edge in the markets.
We get it. Our forum can be intimidating, if not overwhelming. With thousands of topics, tens of thousands of posts, our community has created an incredibly deep knowledge base for stock traders. No one can ever exhaust every resource provided on our site.
If you are new, or just looking for guidance, here are some helpful links to get you started.
- The most viewed thread:
https://usethinkscript.com/threads/repainting-trend-reversal-for-thinkorswim.183/ - Our most popular indicator:
https://usethinkscript.com/threads/buy-the-dip-indicator-for-thinkorswim.3553/ - Answers to frequently asked questions:
https://usethinkscript.com/threads/answers-to-commonly-asked-questions.6006/

