Trend Exhaustion Indicator for ThinkorSwim

BenTen

Administrative
Staff member
Staff
VIP
Lifetime
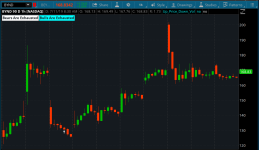
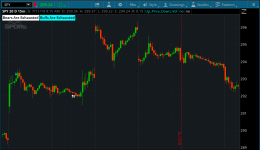
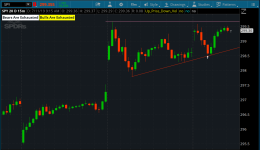
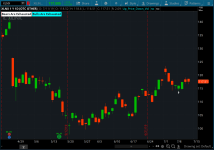
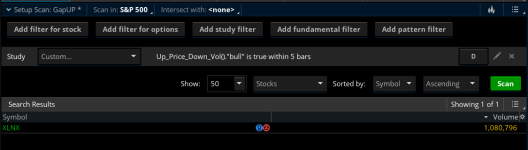
This indicator uses pure price action and volume to identify when a trend is near exhaustion. It can be used as a warning sign for a potential reversal.
  • When Bulls are Exhausted: Volume is decreasing while the price continues to increase. We suspect that the move up is being driven by retail traders.
  • When Bears are Exhausted: Price is going down while volume is also decreasing. Could be a sign of trend exhaustion.
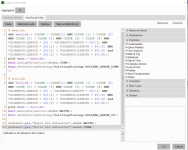
You can use this for intraday trading or on the higher timeframe to spot an exhausted trading trend. You can also use the ThinkorSwim's StockHacker to scan for bearish and bullish signals.

GbjbHo8.png

sS66kQN.png

Rlwbvmo.png


thinkScript Code

Code:
# Trend Exhaustion Indicator for ThinkorSwim
# Assembled by BenTen at useThinkScript.com

# Bearish
def bearish = (CLOSE > CLOSE[1] AND CLOSE [1] > CLOSE [2] AND CLOSE [2] > CLOSE [3] AND CLOSE [3] > CLOSE [4] AND VOLUMEAVG(LENGTH = 20) < VOLUMEAVG(LENGTH = 20)[1] AND VOLUMEAVG(LENGTH = 20)[1] < VOLUMEAVG(LENGTH = 20)[2] AND VOLUMEAVG(LENGTH = 20)[2] < VOLUMEAVG(LENGTH = 20)[3] and VOLUMEAVG(LENGTH = 20)[3] < VOLUMEAVG(LENGTH = 20)[4]);
plot bear = bearish;
bear.AssignValueColor(Color.CYAN);
bear.SetPaintingStrategy(PaintingStrategy.BOOLEAN_ARROW_DOWN);

# Bullish
def bullish = (CLOSE < CLOSE[1] AND CLOSE [1] < CLOSE [2] AND CLOSE [2] < CLOSE [3] AND CLOSE [3] < CLOSE [4] AND VOLUMEAVG(LENGTH = 20) < VOLUMEAVG(LENGTH = 20)[1] AND VOLUMEAVG(LENGTH = 20)[1] < VOLUMEAVG(LENGTH = 20)[2] AND VOLUMEAVG(LENGTH = 20)[2] < VOLUMEAVG(LENGTH = 20)[3] and VOLUMEAVG(LENGTH = 20)[3] < VOLUMEAVG(LENGTH = 20)[4]);
plot bull = bullish;
bull.AssignValueColor(Color.WHITE);
bull.SetPaintingStrategy(PaintingStrategy.BOOLEAN_ARROW_UP);

AddLabel(yes,"Bears Are Exhausted",color.WHITE);
AddLabel(yes,"Bulls Are Exhausted",color.CYAN);

# Alerts
Alert(bullish, " ", Alert.Bar, Sound.Chimes);
Alert(bearish, " ", Alert.Bar, Sound.Bell);

Shareable Link

https://tos.mx/RBR6Kp
 

Attachments

  • Rlwbvmo.png
    Rlwbvmo.png
    64.8 KB · Views: 198
  • sS66kQN.png
    sS66kQN.png
    77.7 KB · Views: 188
  • GbjbHo8.png
    GbjbHo8.png
    78.3 KB · Views: 195
Last edited:

Join useThinkScript to post your question to a community of 21,000+ developers and traders.

Ben I just created the indicator but nothing shows up on the chart arrow wise, I also tried to create a scan but got an error message Add Label not allowed in this context. Thanks
 
Ben I just created the indicator but nothing shows up on the chart arrow wise, I also tried to create a scan but got an error message Add Label not allowed in this context. Thanks

Were you able to see the labels on the chart? If so, then there is nothing wrong with the indicator. Try switching timeframes and checking multiple timeframes. You can remove the last 2 lines from the code and it should fix the scanner issue.
 
Were you able to see the labels on the chart? If so, then there is nothing wrong with the indicator. Try switching timeframes and checking multiple timeframes. You can remove the last 2 lines from the code and it should fix the scanner issue.
The labels are on the chart and I did try different time frames. When I take out the add label I get exactly one plot expected
 
@tenacity11 The scanner is working for me, even with the default code above. Please check again.

LrjWriE.png

WuHGquf.png
 

Attachments

  • WuHGquf.png
    WuHGquf.png
    81.7 KB · Views: 110
  • LrjWriE.png
    LrjWriE.png
    45.9 KB · Views: 118
@tenacity11 You are not supposed to paste the entire indicator into the scanner. Add a new Study filter > select the indicator’s name > choose which type of signal you’re looking to scan.
 
@thinky There is no yellow (it was in the first screenshot because I originally included yellow as the primary color instead of CYAN). Refer to the definitions in the original post above.
 
Ok, if bearish the arrow is cyan (Bulls Are Exhausted label) and points down, when bullish it is white (Bears Are Exhausted) and points up. Or you can comment out the labels and look at the direction of the arrow.

# Bearish
bear.AssignValueColor(Color.CYAN);
bear.SetPaintingStrategy(PaintingStrategy.BOOLEAN_ARROW_DOWN);

# Bullish
bull.AssignValueColor(Color.WHITE);
bull.SetPaintingStrategy(PaintingStrategy.BOOLEAN_ARROW_UP);
 
@thinky That's up to you. Added the labels for myself because I also have other indicators with arrows too (and I assume I'm not the only one). The labels help to identify which signals are which.
 
@thinky There is no yellow (it was in the first screenshot because I originally included yellow as the primary color instead of CYAN). Refer to the definitions in the original post above.
This is a hilarious thread. Sorry new here and snooping around. lol! 🤣
 
@MBF Keep snooping, your time will come. :eek: Actually, no problem, we all need to keep a sense of humor.
No doubt, at least seven times a day. I chuckle because I am like this at times and it was funny to see I'm not the only one. Especially at the beginning. Yes I do have quite a sense of humor. Learning TOS is a feat in itself. cheers.:)🧠⚡My brain is fried! What a room this is!
 

Similar threads

Not the exact question you're looking for?

Start a new thread and receive assistance from our community.

87k+ Posts
313 Online
Create Post

Similar threads

Similar threads

The Market Trading Game Changer

Join 2,500+ subscribers inside the useThinkScript VIP Membership Club
  • Exclusive indicators
  • Proven strategies & setups
  • Private Discord community
  • ‘Buy The Dip’ signal alerts
  • Exclusive members-only content
  • Add-ons and resources
  • 1 full year of unlimited support

Frequently Asked Questions

What is useThinkScript?

useThinkScript is the #1 community of stock market investors using indicators and other tools to power their trading strategies. Traders of all skill levels use our forums to learn about scripting and indicators, help each other, and discover new ways to gain an edge in the markets.

How do I get started?

We get it. Our forum can be intimidating, if not overwhelming. With thousands of topics, tens of thousands of posts, our community has created an incredibly deep knowledge base for stock traders. No one can ever exhaust every resource provided on our site.

If you are new, or just looking for guidance, here are some helpful links to get you started.

What are the benefits of VIP Membership?
VIP members get exclusive access to these proven and tested premium indicators: Buy the Dip, Advanced Market Moves 2.0, Take Profit, and Volatility Trading Range. In addition, VIP members get access to over 50 VIP-only custom indicators, add-ons, and strategies, private VIP-only forums, private Discord channel to discuss trades and strategies in real-time, customer support, trade alerts, and much more. Learn all about VIP membership here.
How can I access the premium indicators?
To access the premium indicators, which are plug and play ready, sign up for VIP membership here.
Back
Top