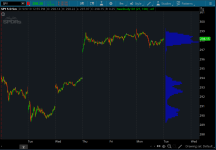
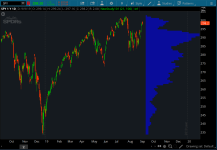
This is an interesting one. I assume it's similar to VWAP but they use Time instead of Volume. Found in the thinkScript lounge.


Time Weighted Average Price _Mobius
Code:
# Time Weighted Average Price
# Mobius
# Mobius at MyTrade
# TWAP in algorithmic trading is the even distribution of a large order over an even amount of time using the (V)olume (W)eighted (A)verage (P)rice. This is NOT that. This is an attempt to weight an average price using the values for the largest areas of distribution by time.

input n = 20;
input ValueAreaPercent = 70;
input SDmult = 2;
input ATRmult = 1.5;
input Time = {default chart, day};

def c = close;
def agg = getAggregationPeriod();
def TPOperiod = agg * n;
def allchart = 0;
def yyyymmdd = getYyyyMmDd();
def seconds = secondsFromTime(0);
def month = getYear() * 12 + getMonth();
def day_number = daysFromDate(first(yyyymmdd)) + getDayOfWeek(first(yyyymmdd));
def dom = getDayOfMonth(yyyymmdd);
def dow = getDayOfWeek(yyyymmdd - dom + 1);
def expthismonth = (if dow > 5
                    then 27
                    else 20) - dow;
def exp_opt = month + (dom > expthismonth);
def period = countTradingDays(Min(first(yyyymmdd), yyyymmdd), yyyymmdd) - 1;
def count = CompoundValue(1, if period != period[1]
                             then (count[1] + period - period[1]) % 1
                             else count[1], 0);
def cond = count < count[1] + period - period[1];
def timeSwitch = if Time  then cond else allchart;
profile tpo = timeProfile("startNewProfile" = timeswitch, "onExpansion" = yes, "numberOfProfiles" = 1000, "pricePerRow" = ticksize(), "value area percent" = valueAreaPercent);
tpo.Show("color"=Color.DARK_GRAY, "poc color" = Color.LIGHT_GRAY, "va color" = Color.GRAY, "open color" = Color.WHITE, "close color" = Color.YELLOW, "ib color" = Color.BLUE, "volume va color" = Color.CYAN, "volume poc color" = Color.DARK_ORANGE);
def PPR = PriceperRow.ticksize;

def hVA = if IsNaN(tpo.getHighestValueArea())
          then hVA[1]
          else tpo.getHighestValueArea();
def lVA = if IsNaN(tpo.getLowestValueArea())
          then lVA[1]
          else tpo.getLowestValueArea();
def pc = if IsNaN(tpo.getPointOfControl())
         then pc[1]
         else tpo.getPointOfControl();
def Wt = (1-(pc / ((hva - lva) + pc)));
def SD = StDev(c, n);
def ATR = Average(TrueRange(high, close, low), n);

plot TWAP = ExpAverage((sum(c, n) + sum(wt, n)) / n, n);
     TWAP.SetStyle(Curve.Firm);
     TWAP.SetLineWeight(1);
     TWAP.AssignValueColor(if TWAP < TWAP[1]
                           then Color.Red
                           else Color.Green);

plot TWAPupper = TWAP + (SDmult * SD);
     TWAPupper.SetDefaultColor(Color.Yellow);

plot TWAPatr = TWAP + (ATRmult * ATR);
     TWAPatr.SetDefaultColor(Color.Red);

plot TWAPlower = TWAP + (-SDmult * SD);
     TWAPlower.SetDefaultColor(Color.Yellow);

plot TWAPatrDn = TWAP - (ATRmult * ATR);
     TWAPatrDn.SetDefaultColor(Color.Red);

AddCloud(TWAPatr, TWAPupper, CreateColor(50,50,50), Color.Current);
AddCloud(TWAPatrDn, TWAPlower, Color.Current, CreateColor(50,50,50));

# End Code TWAP
TWAP: Time Weighted Average Price: Regular Trading Hours
Code:
# TWAP: Time Weighted Average Price: Regular Trading Hours
# DMonkey
# 2.7.2018

# Uses Regular Trading Hours to define Time Weighted Price Average for the day.

# This study essentially is cumulative price divided by each sum
# The longer the time frame the flatter it will become
#
# price 1 + price 2 / 2...
# price 1,2,3 / 3...

#Inputs:
input price = ohlc4;
input OpenTime = 0930;
input CloseTime = 1600;

def active = if SecondsFromTime(OpenTime) >= 0 and
                SecondsTillTime(CloseTime) > 0
                then active[1] + 1
                else 0;
def Data =  fold i = 0 to active + 1
            with p
            while active
            do p + 1;
def TWAP_ = (fold q = 0 to data
            with r
            do r + GetValue(price, q) / (data));
plot TWAP = if active
            then (TWAP_ )
            else double.nan;

TWAP.SetpaintingStrategy(PaintingStrategy.LINE);
TWAP.SetDefaultColor(Color.PLUM);

# End Code
Attachments
Last edited:


