Time Weighted Average Price (TWAP) Indicator for ThinkorSwim

BenTen

Administrative
Staff member
Staff
VIP
Lifetime
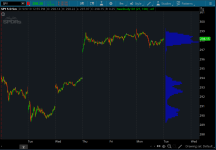
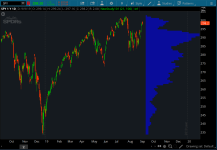
This is an interesting one. I assume it's similar to VWAP but they use Time instead of Volume. Found in the thinkScript lounge.

KVngXVF.png

dR8eT1C.png


Time Weighted Average Price _Mobius

Code:
# Time Weighted Average Price
# Mobius
# Mobius at MyTrade
# TWAP in algorithmic trading is the even distribution of a large order over an even amount of time using the (V)olume (W)eighted (A)verage (P)rice. This is NOT that. This is an attempt to weight an average price using the values for the largest areas of distribution by time.

input n = 20;
input ValueAreaPercent = 70;
input SDmult = 2;
input ATRmult = 1.5;
input Time = {default chart, day};

def c = close;
def agg = getAggregationPeriod();
def TPOperiod = agg * n;
def allchart = 0;
def yyyymmdd = getYyyyMmDd();
def seconds = secondsFromTime(0);
def month = getYear() * 12 + getMonth();
def day_number = daysFromDate(first(yyyymmdd)) + getDayOfWeek(first(yyyymmdd));
def dom = getDayOfMonth(yyyymmdd);
def dow = getDayOfWeek(yyyymmdd - dom + 1);
def expthismonth = (if dow > 5
                    then 27
                    else 20) - dow;
def exp_opt = month + (dom > expthismonth);
def period = countTradingDays(Min(first(yyyymmdd), yyyymmdd), yyyymmdd) - 1;
def count = CompoundValue(1, if period != period[1]
                             then (count[1] + period - period[1]) % 1
                             else count[1], 0);
def cond = count < count[1] + period - period[1];
def timeSwitch = if Time  then cond else allchart;
profile tpo = timeProfile("startNewProfile" = timeswitch, "onExpansion" = yes, "numberOfProfiles" = 1000, "pricePerRow" = ticksize(), "value area percent" = valueAreaPercent);
tpo.Show("color"=Color.DARK_GRAY, "poc color" = Color.LIGHT_GRAY, "va color" = Color.GRAY, "open color" = Color.WHITE, "close color" = Color.YELLOW, "ib color" = Color.BLUE, "volume va color" = Color.CYAN, "volume poc color" = Color.DARK_ORANGE);
def PPR = PriceperRow.ticksize;

def hVA = if IsNaN(tpo.getHighestValueArea())
          then hVA[1]
          else tpo.getHighestValueArea();
def lVA = if IsNaN(tpo.getLowestValueArea())
          then lVA[1]
          else tpo.getLowestValueArea();
def pc = if IsNaN(tpo.getPointOfControl())
         then pc[1]
         else tpo.getPointOfControl();
def Wt = (1-(pc / ((hva - lva) + pc)));
def SD = StDev(c, n);
def ATR = Average(TrueRange(high, close, low), n);

plot TWAP = ExpAverage((sum(c, n) + sum(wt, n)) / n, n);
     TWAP.SetStyle(Curve.Firm);
     TWAP.SetLineWeight(1);
     TWAP.AssignValueColor(if TWAP < TWAP[1]
                           then Color.Red
                           else Color.Green);

plot TWAPupper = TWAP + (SDmult * SD);
     TWAPupper.SetDefaultColor(Color.Yellow);

plot TWAPatr = TWAP + (ATRmult * ATR);
     TWAPatr.SetDefaultColor(Color.Red);

plot TWAPlower = TWAP + (-SDmult * SD);
     TWAPlower.SetDefaultColor(Color.Yellow);

plot TWAPatrDn = TWAP - (ATRmult * ATR);
     TWAPatrDn.SetDefaultColor(Color.Red);

AddCloud(TWAPatr, TWAPupper, CreateColor(50,50,50), Color.Current);
AddCloud(TWAPatrDn, TWAPlower, Color.Current, CreateColor(50,50,50));

# End Code TWAP

TWAP: Time Weighted Average Price: Regular Trading Hours

Code:
# TWAP: Time Weighted Average Price: Regular Trading Hours
# DMonkey
# 2.7.2018

# Uses Regular Trading Hours to define Time Weighted Price Average for the day.

# This study essentially is cumulative price divided by each sum
# The longer the time frame the flatter it will become
#
# price 1 + price 2 / 2...
# price 1,2,3 / 3...

#Inputs:
input price = ohlc4;
input OpenTime = 0930;
input CloseTime = 1600;

def active = if SecondsFromTime(OpenTime) >= 0 and
                SecondsTillTime(CloseTime) > 0
                then active[1] + 1
                else 0;
def Data =  fold i = 0 to active + 1
            with p
            while active
            do p + 1;
def TWAP_ = (fold q = 0 to data
            with r
            do r + GetValue(price, q) / (data));
plot TWAP = if active
            then (TWAP_ )
            else double.nan;

TWAP.SetpaintingStrategy(PaintingStrategy.LINE);
TWAP.SetDefaultColor(Color.PLUM);

# End Code
 

Attachments

  • KVngXVF.png
    KVngXVF.png
    86.5 KB · Views: 143
  • dR8eT1C.png
    dR8eT1C.png
    85.3 KB · Views: 134
Last edited:
@BenTen - Thanks for posting. Been working on something like this for some time, this is much better than what I came up with!
 
It looks like Volume profile on a visible chart. Where highest volume profile acts as magnet to pull price towards it. Its pretty cool to see when price is falling from low volume profile..
 
It looks like Volume profile on a visible chart. Where highest volume profile acts as magnet to pull price towards it. Its pretty cool to see when price is falling from low volume profile..
@drdarshil16 - The Profile portion is almost like TOS Monkey Bars but with a few more peaks. What I like best about this indicator is the code that was used for the TWAP plot - (plot TWAP = ExpAverage((sum(c, n) + sum(wt, n)) / n, n);).
 
I understand there is already a twap study, however i believe this one to be different, i was hoping someone could add deviation lines to this study as well as possibly make an anchored version of this scrip.

Code:
input price = FundamentalType.HLC3;
input timeFrame = {default Day, Week, Month, Chart};

script TimeWAP {

    input price = hlc3;
    input timeFrame = {default Day, Week, Month, Chart};


    def yyyyMmDd = GetYYYYMMDD();
    def periodIndx;
    switch (timeFrame) {
    case Day:
        periodIndx = yyyyMmDd;
    case Week:
        periodIndx = Floor((DaysFromDate(First(yyyyMmDd)) + GetDayOfWeek(First(yyyyMmDd))) / 7);
    case Month:
        periodIndx = RoundDown(yyyyMmDd / 100, 0);
    case Chart:
        periodIndx = 0;
}

    def newday = CompoundValue(1, periodIndx != periodIndx[1], yes);
    rec cumeprice = if newday then price else price + cumeprice[1];
    rec cumebarnumber = if newday then 1 else 1 + cumebarnumber[1];

    plot TWAP = Round(cumeprice / cumebarnumber, 4);

}


plot TWAP = TimeWAP(Fundamental(price));
TWAP.AssignValueColor(if TWAP > TWAP[1] then Color.DARK_GREEN else if TWAP is equal to TWAP[1] then Color.GRAY else Color.DARK_RED);
TWAP.SetStyle(Curve.SHORT_DASH);
TWAP.SetLineWeight(2);
TWAP.HideBubble();
 
@germanburrito Here is the stdv calculation from the original VWAP.

Code:
def deviation = Sqrt(Max(volumeVwap2Sum / volumeSum - Sqr(price), 0));

plot VWAP = price;
plot UpperBand = price + numDevUp * deviation;
plot LowerBand = price + numDevDn * deviation;

I got to this part, still not sure how to transfer the actual deviation over:

Code:
input numDevDn = -2.0;
input numDevUp = 2.0;
plot UpperBand = TWAP + numDevUp * deviation;
plot LowerBand = TWAP + numDevDn * deviation;
 
@arod49 I don't see any reason why you couldn't add standard deviation bands...

Actually, see the implementation by Mobius, HERE, which has them... I had already installed the code on my systems and found it after my initial reply...
 
Last edited:
can standard deviation bands be plotted to TWAP indicator? (time weighted average price)
yes you can pretty much give any line standard deviations, however theres a few ways to do it, the first one is giving the hole line a standard devition with the stdevition command, second is with the standard devition all command sort of like what bollinger bands have, and the third is like vwap does it, where it expands from the beginning of the day, that one is the most diffucult to code and i have not been able to do.

@arod49 I don't see any reason why you couldn't add standard deviation bands...

Actually, see the implementation by Mobius, HERE, which has them... I had already installed the code on my systems...
the problems is not adding bands, because bands do not expand, look at how vwap implements standard deviations, it doesnt do it like bollingers.
 
@germanburrito I believe the three red bands are the TWAP and StdDev bands and Mobius added more code for detecting squeezes similar to how TTM_Squeeze uses Bollinger Bands and Keltner Channels for detection... Example of TWAP Bollinger Band Squeeze below...

LcAKGcb.jpg
 
Last edited:
@germanburrito I believe the three red bands are the TWAP and StdDev bands and Mobius added more code for detecting squeezes similar to how TTM_Squeeze uses Bollinger Bands and Keltner Channels for detection...
well thats a problem becuse it shouldnt contract, the deviation lines on a vwap do not contract they only expand, and this is very helpful, i do find mobious script to be helpful in dictating where price might move away from, i ovelay it with volume profiles, if the time prifiles in red extand pass volume profile this means that the stock is just sitting there and not generating enough as much volume as time, meaaning that market makers and brokers are not making money on commision, so i sometimes find price moving away from this areas into areas of more liquidity, just and idea to go along with the thread.
eFNjdaO.png
 
look at how vwap only expands, this is twap should do to hug price like this, what mobious code did was just standard dev the whole line, but i believe you have to square price and subtract something, im not sure how to code it.
7I10Dcn.png
 
@germanburrito But we aren't talking about VWAP in this topic, we are talking about TWAP and therein lies the difference... Many indicators use standard deviation lines and they all don't look like VWAP do they...??? Nope...!!! Bollinger Bands, Keltner Channels, Gremans Bands, TWAP, and more... I'll go ahead and rewrite TWAP w/StdDev bands and post it here in a bit if I have the time...
 
i understad that, trust me this is the way i primarily trade, with vwap and twap, but it does seem to work better when twap works like vwap, heres a german video on youtube that will explain it, you can translate the cc to english
. but it would be amazin if you could do that.
 
@germanburrito In researching it appears that there are two schools of thought on implementation of TWAP... One is to have it work like VWAP where is is constrained within the trading day... The other is to run perpetual TWAP and with that method it more closely resembles Keltner Channels or MA w/StdDev... Comparing the version by Mobius with DMonkey's version there is a definite difference in implementation... DMonkey's is constrained within the trading session like VWAP...
 
yes, i believe so, both ways can give you different readings, i been exploring this idea for 3 months now, there lies a huge secret, price, time, and volume.
 
Last edited:

Join useThinkScript to post your question to a community of 21,000+ developers and traders.

Similar threads

Not the exact question you're looking for?

Start a new thread and receive assistance from our community.

87k+ Posts
429 Online
Create Post

Similar threads

Similar threads

The Market Trading Game Changer

Join 2,500+ subscribers inside the useThinkScript VIP Membership Club
  • Exclusive indicators
  • Proven strategies & setups
  • Private Discord community
  • ‘Buy The Dip’ signal alerts
  • Exclusive members-only content
  • Add-ons and resources
  • 1 full year of unlimited support

Frequently Asked Questions

What is useThinkScript?

useThinkScript is the #1 community of stock market investors using indicators and other tools to power their trading strategies. Traders of all skill levels use our forums to learn about scripting and indicators, help each other, and discover new ways to gain an edge in the markets.

How do I get started?

We get it. Our forum can be intimidating, if not overwhelming. With thousands of topics, tens of thousands of posts, our community has created an incredibly deep knowledge base for stock traders. No one can ever exhaust every resource provided on our site.

If you are new, or just looking for guidance, here are some helpful links to get you started.

What are the benefits of VIP Membership?
VIP members get exclusive access to these proven and tested premium indicators: Buy the Dip, Advanced Market Moves 2.0, Take Profit, and Volatility Trading Range. In addition, VIP members get access to over 50 VIP-only custom indicators, add-ons, and strategies, private VIP-only forums, private Discord channel to discuss trades and strategies in real-time, customer support, trade alerts, and much more. Learn all about VIP membership here.
How can I access the premium indicators?
To access the premium indicators, which are plug and play ready, sign up for VIP membership here.
Back
Top