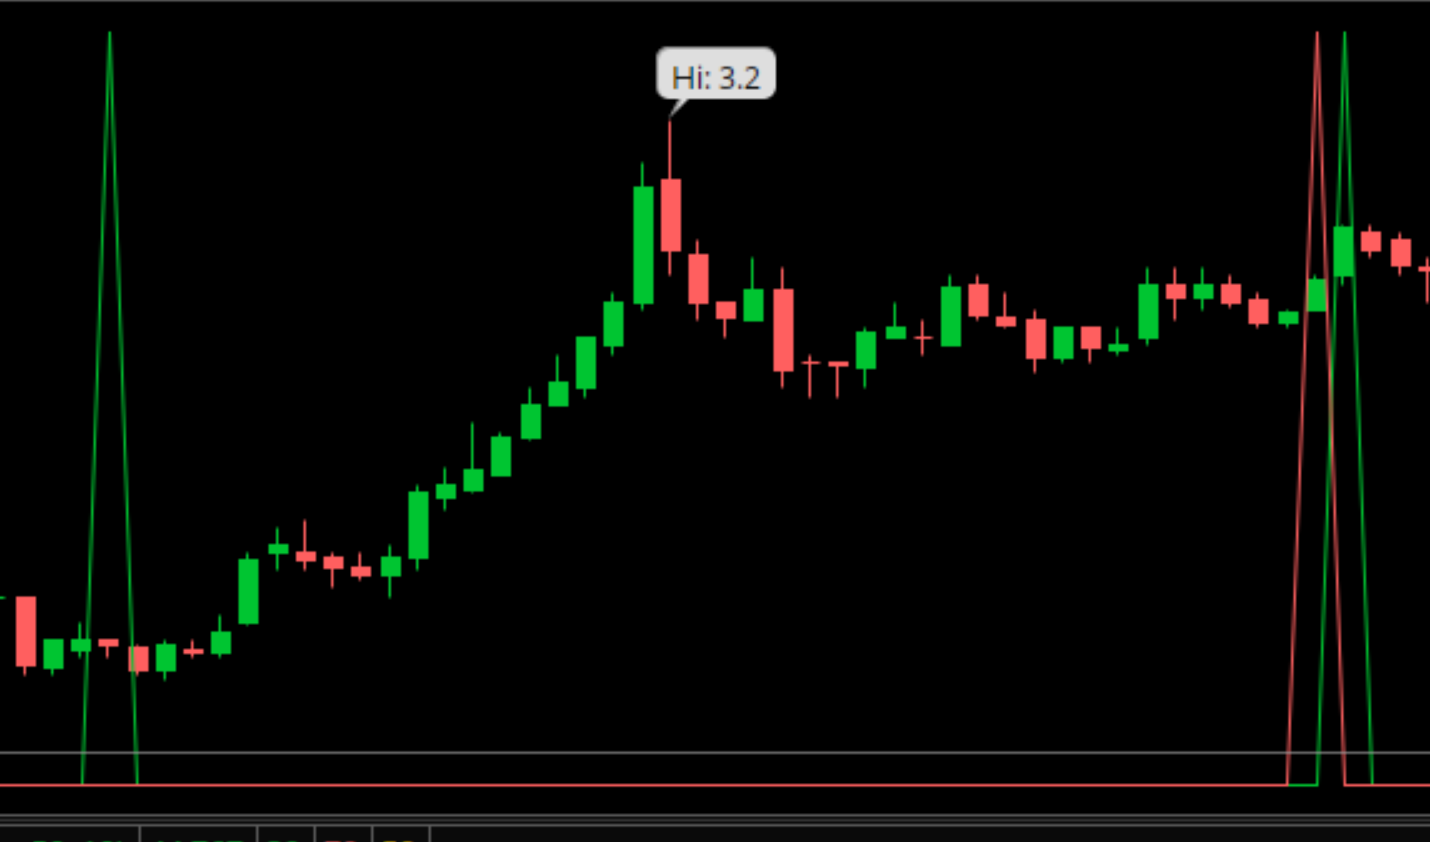
Volume Weighted Moving Average (VWMA) for ThinkorSwim

Code:
input vwmaLength = 20;
input maLength = 20;
input averageType = AverageType.SIMPLE;

def VWMA = Sum(volume * close, vwmaLength) / Sum(volume, vwmaLength);
def MA = MovingAverage(averageType, close, maLength);

def priceCrossBelowSMA = VWMA [1] > MA [1] and VWMA < MA;

plot Scandown = priceCrossBelowSMA;


def priceCrossAboveSMA = VWMA [1] < MA [1] and VWMA > MA;

plot Scanup = priceCrossAboveSMA;
 

veerasareddy

New member
Could you please help me to give the scanner for VWMA Breakout strategy in ThinkorSwim. When the Blue line crosses above or below the Pink line in Daily / 4h Chart.

4pyCzcE.png


Thank you.
 

Attachments

  • 4pyCzcE.png
    4pyCzcE.png
    405.7 KB · Views: 206
Here you go. Save this as a study. Then switch over to the Scanner and scan for buy and sell signals.

Code:
# VWMA Breakout Strategy
# TD Ameritrade IP Company, Inc. (c) 2017-2019
# Modified by BenTen at useThinkScript.com
# Added arrows to use with the Scanner

input vwmaLength = 50;
input maLength = 70;
input averageType = AverageType.SIMPLE;

plot VWMA = Sum(volume * close, vwmaLength) / Sum(volume, vwmaLength);
plot MA = MovingAverage(averageType, close, maLength);
VWMA.SetDefaultColor(GetColor(1));
MA.SetDefaultColor(GetColor(2));

def buy = VWMA crosses above MA;
def sell = VWMA crosses below MA;

plot bullish = buy;
bullish.SetPaintingStrategy(PaintingStrategy.BOOLEAN_Arrow_UP);
bullish.SetDefaultColor(Color.LIME);
bullish.SetLineWeight(1);

plot bearish = sell;
bearish.SetPaintingStrategy(PaintingStrategy.BOOLEAN_Arrow_DOWN);
bearish.SetDefaultColor(Color.LIME);
bearish.SetLineWeight(1);
 
@BenTen Thank you so much. I saved as a study. But I'm not able to scan BUY / SELL as per your instructions. Could you please help one more step. Thank you for your kindness. Probably a screen shot of the scanner code.
 
Code:
MovAvgWeighted("length" = 50) crosses above SimpleMovingAverage("length" = 70) within 3 bars
MovAvgWeighted("length" = 50) crosses below SimpleMovingAverage("length" = 70) within 3 bars

Just try scan similiar to above , Do not have ToS open so unsure if the "SimpleMovingAverage" is the correct spelling for that study. If not just look in studies for the correct wording.
 
@veerasareddy Switch to Scan tab, Add new filter study > Select the study I sent you above > Under Plot select the type of signal you want to scan for and also within how many bars.

TiagVil.png
 
Last edited:
Folks, I looking for the VWMA. I have searched far and wide, but can't find the code or link for it, only lots of talk about how it works.

This is not the VWMA Breakout, which is already part of ThinkorSwim.

Thanks for your help,
WayneG
 
No, it is the Volume Weighted Moving Average (VWMA), the VWAP throws price into the mix.

Volume Weighted Moving Average

The Volume Weighted Moving Average (VWMA) study calculates the average weighted price by volume over a period of N bars. The formula is as follows: SUM(vol*price)/SUM(vol). The user may change the input (close), period and shift.

HOW ABOUT THIS?

Code:
input LENGTH = 5;
input displace = 0;

def VWMA = Sum(volume * close) / Sum(volume);
plot MYVWMA = Average(VWMA[-displace], LENGTH);
 
I'm using 2 VWMA indicators - one for when it's up (Green Plot) and one for when it comes down (Red Plot).

Can someone help with 2 items?

1- Combine the two scripts into one Script
2- Instead of having the Plots on the chart, an alternative option where Green Plot stays green until it turns red

VWMA Crossover Up (Green Plot);
Code:
# MyVWMACrossoverUp

input vwmaLength = 20;
input maLength = 20;
input averageType = AverageType.simple;

def VWMA = Sum(volume * close, vwmaLength) / Sum(volume, vwmaLength);
def MA = MovingAverage(averageType, close, maLength);

def priceCrossAboveSMA = VWMA [1] < MA [1] and VWMA > MA;

plot Scan1 = priceCrossAboveSMA;


VWMA Crossover Down (Red Plot);
Code:
# MyVWMACrossoverDown

input vwmaLength = 20;
input maLength = 20;
input averageType = AverageType.SIMPLE;

def VWMA = Sum(volume * close, vwmaLength) / Sum(volume, vwmaLength);
def MA = MovingAverage(averageType, close, maLength);

def priceCrossBelowSMA = VWMA [1] > MA [1] and VWMA < MA;

plot Scan1 = priceCrossBelowSMA;

Here is what it looks like on my chart;


Thank you!
 
Hi @horserider,

EDIT: Thanks for this. Weird but I have to add "Declare Lower;" to the script then move it to the top but it works great as one Study.

Now if I can get some help in plotting it similar to this;
- Green above and Red Below (it's a SuperTrend Study)


Thanks again.
 
Last edited:
Code:
input vwmaLength = 20;

plot VWMA = Sum(volume * close, vwmaLength) / Sum(volume, vwmaLength);

VWMA.AssignValueColor(if VWMA > close then Color.RED else Color.GREEN);
 
mtf VWMA (multi-timeframe Volume Weighted Moving Average)
The key differences between VWAP and VWMA are: VWAP is cumulative of average price with respect to volume. ... VWMA is a type of moving averages. The indicator calculates the average of closing prices with respect to the volume.

This was a poster request. I haven't traded with this indicator personally. If you use it, please leave feedback.
Er9TSVn.png

Ruby:
# ########################################################
# VWMA MTF
# @MerryDay 7/2021
# ########################################################
# MTF definitions
input agg = aggregationPeriod.HOUR ;
def mtf_volume = volume(period = agg) ;
def mtf_price  = close(period = agg) ;
# ########################################################

input vwmaLength = 50;
input averageType = AverageType.SIMPLE;
plot VWMA = Sum(mtf_volume * mtf_price, vwmaLength) / Sum(mtf_volume, vwmaLength);
VWMA.SetDefaultColor(color.violet) ;
Shared Study Link: http://tos.mx/eKiuc3p
Click here for --> Easiest way to load shared links
 
I was reading about volume-weighted moving average and this was what I could come up with. I noticed that when I used the simple moving average for shorter periods the value would be quite low, so I calculated the exponential moving average instead, also when I calculated the 50 periods it would vary widely on the chart, I am not sure if I made a mistake in the code. I am hoping someone could possibly simplify/audit the codes

10 Period Volume Weighted Exponential Moving Average
Ruby:
def total_volume = sum(volume,10);
def vw = (volume/total_volume);
def vw2 = (volume()[1]/total_volume);
def vw3 = (volume()[2]/total_volume);
def vw4 = (volume()[3]/total_volume);
def vw5 = (volume()[4]/total_volume);
def vw6 = (volume()[5]/total_volume);
def vw7 = (volume()[6]/total_volume);
def vw8 = (volume()[7]/total_volume);
def vw9 = (volume()[8]/total_volume);
def vw10 = (volume()[9]/total_volume);
def vwp = close * vw;
def vwp2 = close[1] * vw2;
def vwp3 = close[2] * vw3;
def vwp4 = close[3] * vw4;
def vwp5 = close[4] * vw5;
def vwp6 = close[5] * vw6;
def vwp7 = close[6] * vw7;
def vwp8 = close[7] * vw8;
def vwp9 = close[8] * vw9;
def vwp10 = close[9]* vw10;

plot ema = expaverage(vwp + vwp2 + vwp3 + vwp4 + vwp5 + vwp6 + vwp7 + vwp8 + vwp9 + vwp10 );

ema.SetDefaultColor(GetColor(1));


20 Period Volume Weighted Exponential Moving Average
Code:
def total_volume = sum(volume,20);
def vw = (volume/total_volume);
def vw2 = (volume()[1]/total_volume);
def vw3 = (volume()[2]/total_volume);
def vw4 = (volume()[3]/total_volume);
def vw5 = (volume()[4]/total_volume);
def vw6 = (volume()[5]/total_volume);
def vw7 = (volume()[6]/total_volume);
def vw8 = (volume()[7]/total_volume);
def vw9 = (volume()[8]/total_volume);
def vw10 = (volume()[9]/total_volume);
def vwp = close * vw;
def vwp2 = close[1] * vw2;
def vwp3 = close[2] * vw3;
def vwp4 = close[3] * vw4;
def vwp5 = close[4] * vw5;
def vwp6 = close[5] * vw6;
def vwp7 = close[6] * vw7;
def vwp8 = close[7] * vw8;
def vwp9 = close[8] * vw9;
def vwp10 = close[9]* vw10;
def vw11 = (volume[10]/total_volume);
def vw12 = (volume()[11]/total_volume);
def vw13 = (volume()[12]/total_volume);
def vw14 = (volume()[13]/total_volume);
def vw15 = (volume()[14]/total_volume);
def vw16 = (volume()[15]/total_volume);
def vw17 = (volume()[16]/total_volume);
def vw18 = (volume()[17]/total_volume);
def vw19 = (volume()[18]/total_volume);
def vw20 = (volume()[19]/total_volume);
def vwp11 = close[10] * vw11;
def vwp12 = close[11] * vw12;
def vwp13 = close[12] * vw13;
def vwp14 = close[13] * vw14;
def vwp15 = close[14] * vw15;
def vwp16 = close[15] * vw16;
def vwp17 = close[16] * vw17;
def vwp18 = close[17] * vw18;
def vwp19 = close[18] * vw19;
def vwp20 = close[19]*  vw20;
plot ema = expaverage(vwp + vwp2 + vwp3 + vwp4 + vwp5 + vwp6 + vwp7 + vwp8 + vwp9 + vwp10 + vwp11 + vwp12 + vwp13 + vwp14 + vwp15 + vwp16 + vwp17 + vwp18 + vwp19 +vwp20 );

ema.SetDefaultColor(GetColor(1));

50 Period Volume Weighted Simple Moving Average
Code:
def total_volume = sum(volume,50);
def vw = (volume/total_volume);
def vw2 = (volume()[1]/total_volume);
def vw3 = (volume()[2]/total_volume);
def vw4 = (volume()[3]/total_volume);
def vw5 = (volume()[4]/total_volume);
def vw6 = (volume()[5]/total_volume);
def vw7 = (volume()[6]/total_volume);
def vw8 = (volume()[7]/total_volume);
def vw9 = (volume()[8]/total_volume);
def vw10 = (volume()[9]/total_volume);
def vwp = close * vw;
def vwp2 = close[1] * vw2;
def vwp3 = close[2] * vw3;
def vwp4 = close[3] * vw4;
def vwp5 = close[4] * vw5;
def vwp6 = close[5] * vw6;
def vwp7 = close[6] * vw7;
def vwp8 = close[7] * vw8;
def vwp9 = close[8] * vw9;
def vwp10 = close[9]* vw10;
def vw11 = (volume()[10]/total_volume);
def vw12 = (volume()[11]/total_volume);
def vw13 = (volume()[12]/total_volume);
def vw14 = (volume()[13]/total_volume);
def vw15 = (volume()[14]/total_volume);
def vw16 = (volume()[15]/total_volume);
def vw17 = (volume()[16]/total_volume);
def vw18 = (volume()[17]/total_volume);
def vw19 = (volume()[18]/total_volume);
def vw20 = (volume()[19]/total_volume);
def vwp11 = close[10] * vw11;
def vwp12 = close[11] * vw12;
def vwp13 = close[12] * vw13;
def vwp14 = close[13] * vw14;
def vwp15 = close[14] * vw15;
def vwp16 = close[15] * vw16;
def vwp17 = close[16] * vw17;
def vwp18 = close[17] * vw18;
def vwp19 = close[18] * vw19;
def vwp20 = close[19] *  vw20;
def vw21 = (volume()[20]/total_volume);
def vw22 = (volume()[21]/total_volume);
def vw23 = (volume()[22]/total_volume);
def vw24 = (volume()[23]/total_volume);
def vw25 = (volume()[24]/total_volume);
def vw26 = (volume()[25]/total_volume);
def vw27 = (volume()[26]/total_volume);
def vw28 = (volume()[27]/total_volume);
def vw29 = (volume()[28]/total_volume);
def vw30 = (volume()[29]/total_volume);
def vwp21 = close[20] * vw[21];
def vwp22 = close[21] * vw2[22];
def vwp23 = close[22] * vw3[23];
def vwp24 = close[23] * vw4[24];
def vwp25 = close[24] * vw5[25];
def vwp26 = close[25] * vw6[26];
def vwp27 = close[26] * vw7[27];
def vwp28 = close[27] * vw8[28];
def vwp29 = close[28] * vw9[29];
def vwp30 = close[29] * vw10[30];
def vw31 = (volume()[30]/total_volume);
def vw32 = (volume()[31]/total_volume);
def vw33 = (volume()[32]/total_volume);
def vw34 = (volume()[33]/total_volume);
def vw35 = (volume()[34]/total_volume);
def vw36 = (volume()[35]/total_volume);
def vw37 = (volume()[36]/total_volume);
def vw38 = (volume()[37]/total_volume);
def vw39 = (volume()[38]/total_volume);
def vw40 = (volume()[39]/total_volume);
def vwp31 = close[30] * vw31;
def vwp32 = close[31] * vw32;
def vwp33 = close[32] * vw33;
def vwp34 = close[33] * vw34;
def vwp35 = close[34] * vw35;
def vwp36 = close[35] * vw36;
def vwp37 = close[36] * vw37;
def vwp38 = close[37] * vw38;
def vwp39 = close[38] * vw39;
def vwp40 = close[39] * vw40;
def vw41 = (volume()[40]/total_volume);
def vw42 = (volume()[41]/total_volume);
def vw43 = (volume()[42]/total_volume);
def vw44 = (volume()[43]/total_volume);
def vw45 = (volume()[44]/total_volume);
def vw46 = (volume()[45]/total_volume);
def vw47 = (volume()[46]/total_volume);
def vw48 = (volume()[47]/total_volume);
def vw49 = (volume()[48]/total_volume);
def vw50 = (volume()[49]/total_volume);
def vwp41 = close[40] * vw41;
def vwp42 = close[41] * vw42;
def vwp43 = close[42] * vw43;
def vwp44 = close[43] * vw44;
def vwp45 = close[44] * vw45;
def vwp46 = close[45] * vw46;
def vwp47 = close[46] * vw47;
def vwp48 = close[47] * vw48;
def vwp49 = close[48] * vw49;
def vwp50 = close[49] * vw50;
plot sma = average(vwp + vwp2 + vwp3 + vwp4 + vwp5 + vwp6 + vwp7 + vwp8 + vwp9 + vwp10 + vwp11 + vwp12 + vwp13 + vwp14 + vwp15 +vwp16 + vwp17 + vwp18 +vwp19 +vwp20 +vwp21  + vwp22 + vwp23 + vwp24 + vwp25 + vwp26 +vwp27 + vwp28 + vwp29 + vwp30 + vwp31 + vwp32 + vwp33 + vwp34 + vwp35 + vwp36 + vwp37 + vwp38 + vwp39 + vwp40 + vwp41 + vwp42 + vwp43 + vwp44 + vwp45 + vwp46 + vwp47 + vwp48 + vwp49 + vwp50 );

sma.SetDefaultColor(GetColor(1));
.
 
I was reading about volume-weighted moving average and this was what I could come up with. I noticed that when I used the simple moving average for shorter periods the value would be quite low, so I calculated the exponential moving average instead, also when I calculated the 50 periods it would vary widely on the chart, I am not sure if I made a mistake in the code. I am hoping someone could possibly simplify/audit the codes
.
I moved your post here. You will find the VWMA scripts in this thread, a wee bit more concise.
 
Hello BenTen---Capt Bob here ---I like your study and I've incorporated another study to weed out the false signals and would like the code to the original Vwma ---I assume you wrote the original code or have it . I need it to automate my strat. Is this possible to obtain. Tks Capt Bob

Good evening Benten---This code seems to be locked can I get an unlocked version for my Strat. As I added another study to eliminate some false trades. Thanks Capt.Bob

Hello Benten---can you send me a version that eliminates the words on the chart. The code seems to be locked and all I need is arrows up or down. I'm new to TOS and as I said before I've got another study that will eliminate a lot of false trades but need the code to make it happen please advise if this is possible. Thanks Capt.Bob
 
Last edited by a moderator:
Hello BenTen---Capt Bob here ---I like your study and I've incorporated another study to weed out the false signals and would like the code to the original Vwma ---I assume you wrote the original code or have it . I need it to automate my strat. Is this possible to obtain. Tks Capt Bob

Good evening Benten---This code seems to be locked can I get an unlocked version for my Strat. As I added another study to eliminate some false trades. Thanks Capt.Bob

Hello Benten---can you send me a version that eliminates the words on the chart. The code seems to be locked and all I need is arrows up or down. I'm new to TOS and as I said before I've got another study that will eliminate a lot of false trades but need the code to make it happen please advise if this is possible. Thanks Capt.Bob
Not sure what you are asking. The script in the top post is not 'locked'
Click here for how to cut & paste scripts:
https://usethinkscript.com/threads/how-to-import-existing-thinkscript-code-on-thinkorswim.10/

If you are asking about a ToS 'locked' study then you are correct. ToS copy-protected scripts can be used as is. But the ToS platform does not provide the code or editing / modifying capabilities for its copy-protected scripts.
 

Join useThinkScript to post your question to a community of 21,000+ developers and traders.

Not the exact question you're looking for?

Start a new thread and receive assistance from our community.

87k+ Posts
292 Online
Create Post

The Market Trading Game Changer

Join 2,500+ subscribers inside the useThinkScript VIP Membership Club
  • Exclusive indicators
  • Proven strategies & setups
  • Private Discord community
  • ‘Buy The Dip’ signal alerts
  • Exclusive members-only content
  • Add-ons and resources
  • 1 full year of unlimited support

Frequently Asked Questions

What is useThinkScript?

useThinkScript is the #1 community of stock market investors using indicators and other tools to power their trading strategies. Traders of all skill levels use our forums to learn about scripting and indicators, help each other, and discover new ways to gain an edge in the markets.

How do I get started?

We get it. Our forum can be intimidating, if not overwhelming. With thousands of topics, tens of thousands of posts, our community has created an incredibly deep knowledge base for stock traders. No one can ever exhaust every resource provided on our site.

If you are new, or just looking for guidance, here are some helpful links to get you started.

What are the benefits of VIP Membership?
VIP members get exclusive access to these proven and tested premium indicators: Buy the Dip, Advanced Market Moves 2.0, Take Profit, and Volatility Trading Range. In addition, VIP members get access to over 50 VIP-only custom indicators, add-ons, and strategies, private VIP-only forums, private Discord channel to discuss trades and strategies in real-time, customer support, trade alerts, and much more. Learn all about VIP membership here.
How can I access the premium indicators?
To access the premium indicators, which are plug and play ready, sign up for VIP membership here.
Back
Top