
I want to share part of my system and my intraday. This is a screen I use to monitor state of the market during the day and make decisions based on it. I do not make trades directly of it, but use it whenever I make market correlated intraday decisions.
Grid chart: https://tos.mx/thzmWST
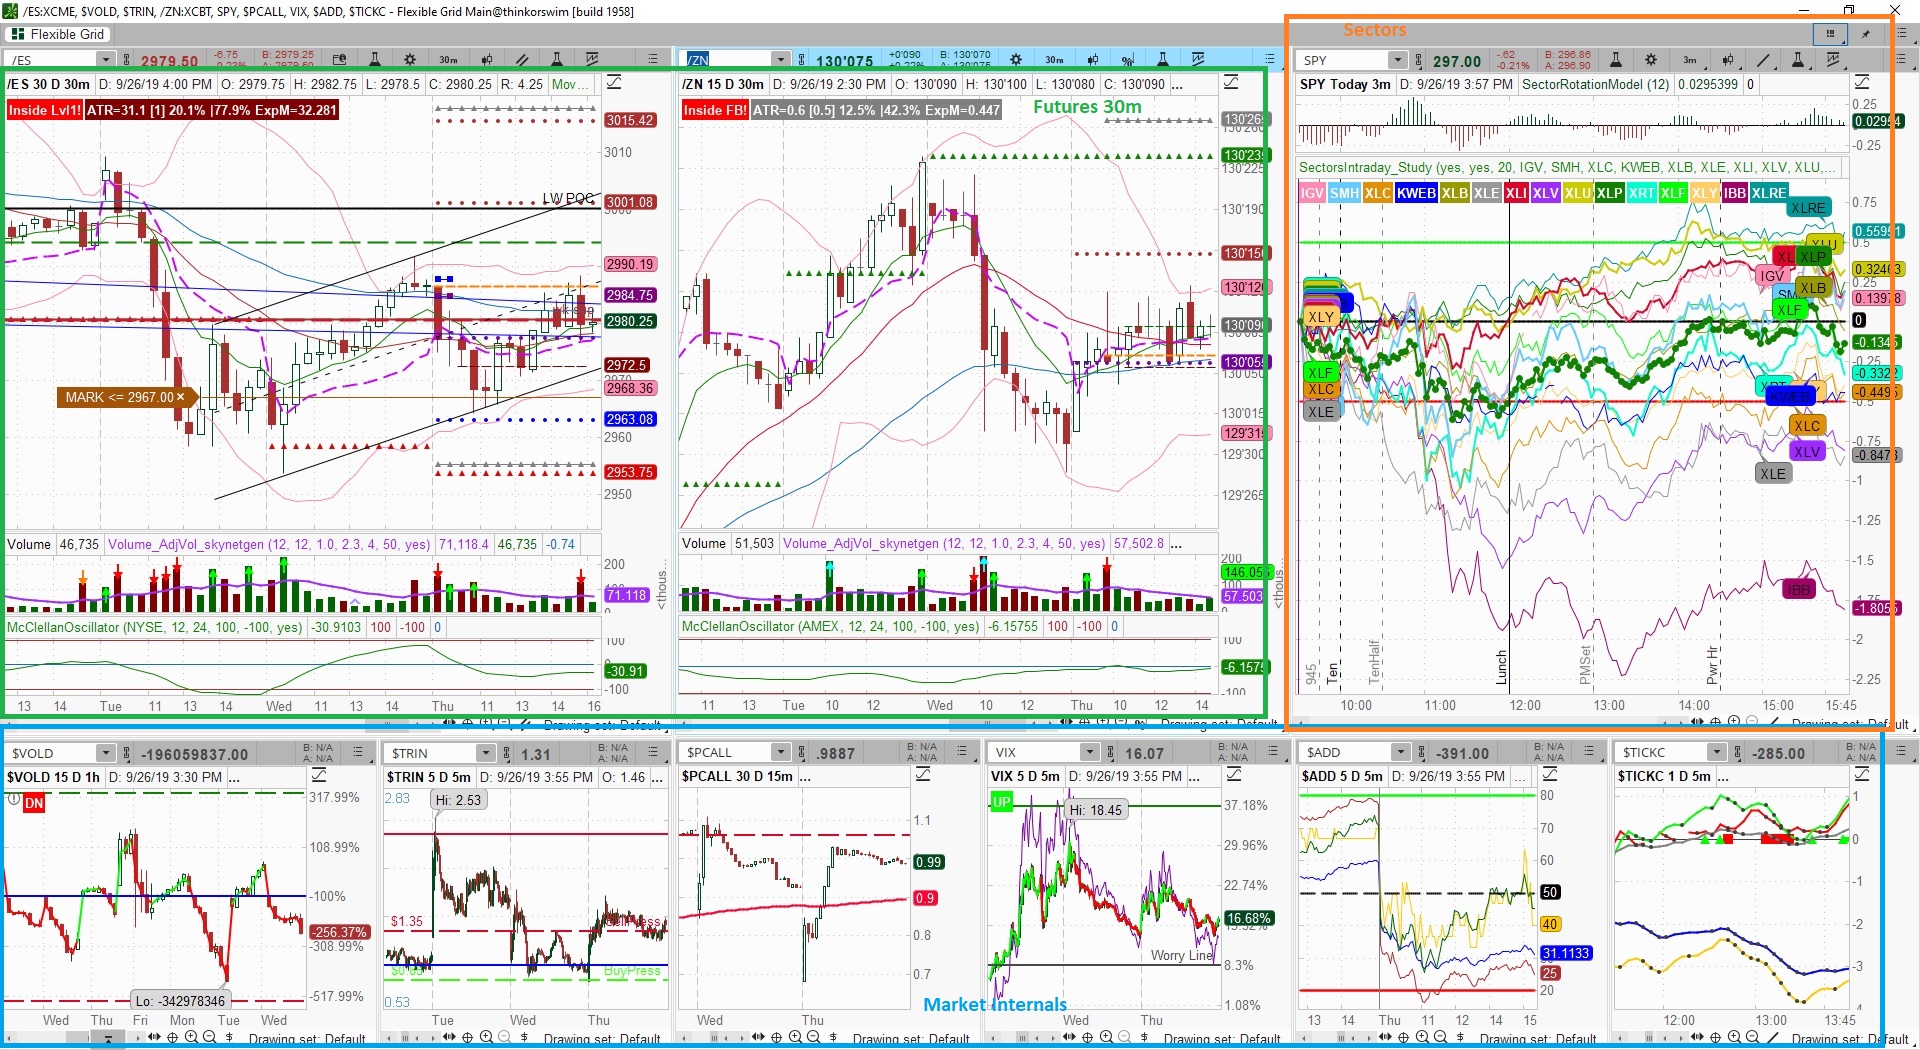
This is 30m charts used to monitor most important market indexes. /ES is always there and right one varies- mostly between /ZN, /CL and /RTY .
I draw and update all important levels premarket
Under it is McLellan oscillator - which is advance/declines on oscillator. Using it mostly to confirm market reversals
2) Intraday sectors
This is normalized chart measuring performance of 15 sectors I track. The performance is normalized on close vs open vs SPY. in between 0.5 and -0.5 is generally chop
at 9:30 to 1000 I use 1m timeframe and switch to 3m timeframe after 10
3) market internals
VOLD - volume done in the market. its to track volume traded and compare across days
$TRIN - a breadth indicator. I mostly use spike to above and below leves
VIX - has VIX9D overlayed
ADD - this is ADD for 4 major market
TICK - comparative tick (similar to how sectors work - close vs open but for tick on 4 major market)
you will see green/red line and label - this is for quick glance whether its trending up or down
Would like some feedback/suggestions/questions
Grid chart: https://tos.mx/thzmWST
It has 3 big parts
1) FuturesThis is 30m charts used to monitor most important market indexes. /ES is always there and right one varies- mostly between /ZN, /CL and /RTY .
I draw and update all important levels premarket
Under it is McLellan oscillator - which is advance/declines on oscillator. Using it mostly to confirm market reversals
2) Intraday sectors
This is normalized chart measuring performance of 15 sectors I track. The performance is normalized on close vs open vs SPY. in between 0.5 and -0.5 is generally chop
at 9:30 to 1000 I use 1m timeframe and switch to 3m timeframe after 10
3) market internals
VOLD - volume done in the market. its to track volume traded and compare across days
$TRIN - a breadth indicator. I mostly use spike to above and below leves
VIX - has VIX9D overlayed
ADD - this is ADD for 4 major market
TICK - comparative tick (similar to how sectors work - close vs open but for tick on 4 major market)
you will see green/red line and label - this is for quick glance whether its trending up or down
Would like some feedback/suggestions/questions
Last edited by a moderator:
